
Abstract
The research question in this article is threefold: To which degree is the financial crisis of 2008 and the subsequent recession associated with reduced well-being among people in the four hardest affected EURO countries? Are individual factors associated with reduced well-being the same in these countries? and Are lower socioeconomic groups more severely hit than the better off?. Data before the crisis are compared with data in 2013/2014 (EU-SILC [European Union Statistics on Income and Living Conditions] survey 2013) for Greece, Portugal, Ireland, and Spain. Finland is used as a reference category. Before control of individual characteristics, regressions demonstrate a small and mostly significant fall in average satisfaction with life in these countries, Portugal being an exception. According to the theory of capability and actual economic and political development, it was hypothesized that Greece—being the worst case in terms of economic development—may experience the greatest fall in life satisfaction. This hypothesis is not supported by the data. In fact, the strongest decline was found in Ireland. In particular, lack of political trust stands in Greece out as having an impact, while poor health is related to Ireland and unemployment to Portugal and Spain. Greatest socioeconomic inequality in life satisfaction was found in Portugal.
Keywords
Introduction
Did the financial crisis of 2008 and the economic, political, and fiscal crisis during 2010 to 2012 lead to a social crisis in 2013/2014? What are the welfare effects of (macro) economic policies (austerity measures) at the micro level on subjective well-being? This is especially a pertinent issue among those EURO-zone countries most hard hit by the crisis, the so-called PIGS-countries, that is, Portugal, Ireland Greece, and Spain. 1 These are the countries in the Euro zone periphery required to adopt budget retrenchment measures (Hardiman, 2012). By contrasting the situation in these PIGS-countries before and after the crisis with that of Finland, the only Nordic country being part of the EURO-zone, we may be better able to understand the most important drivers for health and subjective well-being. Has development in subjective health and satisfaction with life on average worsened among people in these countries, and have socioeconomic inequalities on these welfare parameters increased to the same extent in all these four countries?
I am using data from 2004 as a pre-crisis baseline, comparing them with the latest available dataset in European Social Surveys (ESS) from 2014 (seventh round). In addition, I am also using 2013 EU-SILC (European Union Statistics on Income and Living Conditions). In contrast to earlier studies, this study uses a longer time span (10 years), and aims at incorporating individual data in a country context. Earlier studies have used aggregated data for a huge number of countries (European Union [EU]/Agreement on the European Economic Area [EEA] countries or Organisation for Economic Co-Operation and Development [OECD] countries), or individual longitudinal data for one or two countries, but, as far as I know, have not yet compared the development in the countries presumably worst hit by the crisis with that of a non-crisis country.
Individual satisfaction with life (evaluative well-being) is not only associated with individual factors, but is heavily influenced by country context such as “good governance” (Helliwell, Huang, & Wang, 2015). Yet, aggregate data cannot tell why some individuals have been more hard hit than others. The aim of this article is thus more precisely to move a bit further by identifying such categories, within countries as well as across countries. To study changes in life satisfaction, inequality has in the literature been less developed (Owen & Philips, 2015). Which categories are hardest hit by the recession, and are they similar or dissimilar in the countries under study? The drivers behind changes in well-being may not be the same for all these countries, not least because the causal paths to the crisis differ among these countries (Therborn, 2013). Previous aggregate studies of well-being cannot identify which factors in each crisis country play a role. This study aims at filling these voids.
Theory and Research Questions
I am testing a widespread theory that recessions affect negatively well-being and that their impacts are unequal within as well as between countries. People’s satisfaction with life is determined not only by macro-level economic development but also by their actual experiences and living conditions as well as personality The theoretical point of departure is Amartya Sen’s (1999) capability approach used as an assessment of individual well-being. Capabilities are the freedoms and rights people have to do or be to fulfill their potential for well-being. The basic capability is the freedom to choose (autonomy) a life she or he has reason to value (Sen, 1999). Capabilities are thus “a person’s real freedoms or opportunities to achieve functionings” (Robeyns, 2016, p. 9). These freedoms and opportunities are made feasible and constrained by both internal and external (social and environmental) conversion factors (Robeyns, 2005). The country-level frameworks (space of action) for capabilities can be measured at the national level, traditionally not only by gross domestic product (GDP) per capita, unemployment, or inequality but also, for example, by an aggregate measure of social justice, corruption or a measure of social expenditures. Capabilities restrict whether resources can be converted into functionings as well as choice of functions (Robeyns, 2005, p. 108; 2016). Functionings (achievements), that is what people actually are doing within the institutional constraint of a nation, can be measured by individual characteristics such as labor market status and household’s economic situation. Together, capabilities and functionings determine subjective well-being (satisfaction with life). Sen’s capability approach has been incorporated in a well-being framework, where subjective well-being reflects the “total of an individual’s capabilities to achieve subjective well-being” (Binder, 2014, p. 1211).
Well-being is a multidimensional concept. Satisfaction with life, a sub dimension of well-being—the other being happiness (the hedonic dimension) and meaning (the eudemonic dimension)—is regarded as a valid indicator (Deaton & Stone, 2016). Life satisfaction can be regarded as the most appropriate as a policy goal (Veenhoven, 2010). This subjective measure is meant to represent a cognitive and global appraisal of quality of life as a whole, taking all life circumstances into consideration (Eurofound, 2012). Thus, life satisfaction can be regarded as a valid measure of a person’s functioning. Both past, present, and to a certain extent the future is reflected in peoples’ response to questions of satisfaction with life.
A consequence of the recession has been austerity policies in many European countries, not least in the PIGS-countries (Portugal, Ireland, Greece, Spain), with repercussions on the capabilities of populations in these countries to achieve subjective well-being. Life satisfaction is not a direct function of the economy, but has an indirect impact through changes in peoples’ experience of free choice and having control over their life situation (Helliwell & Wang, 2013). It turns out that the experience of freedom of choice and control predicts satisfaction with life to a greater extent than health, employment, and income, both within and across countries: “Income expands freedoms of choice by definition” (Verme, 2009, p. 7).
The research question is threefold:
Drivers of Satisfaction With Life: Recent Findings
Several studies have demonstrated that economic growth (the natural log of GDP per capita) is important (Deeming & Jones, 2013; O’Connor, 2014), but improved social policy (social protection expenditure) has a greater impact on people’s well-being (Growiec & Growiec, 2014; O’Connor, 2014; Pacek & Radcliff, 2008; Rothstein, 2011).
Finally, economic downturns can have a negative influence on life satisfaction, because it is more sensitive to economic conditions than happiness (Inglehart, Foa, Peterson, & Welzel, 2009). In general, it turns out that income losses have a stronger effect on life satisfaction than income gains (Wolbring, Keuschnigg, & Negele, 2013). Blanchflower and Oswald (2011) have looked at changes in life satisfaction over recent years during a recession using data from Eurobarometer 2007-2010: There has been a decline in the life satisfaction levels both in Greece and Portugal, measured both by a decline in their mean scores as well as in the relative rankings in the regression, but in fact an increase in life satisfaction levels of the Irish.
The impact of economic crisis on happiness has been studied in the case of Iceland. This longitudinal study found that income and unemployment did not predict happiness, but financial difficulties did. A decrease (small, but significant) in happiness (between 2007 and 2009) was detected after the collapse (Gudmundsdottir, 2013).
Findings do not fully support the assertion that “decreases in income at the national level, due to recessions for instance, might with greater certainty cause declines in SWB” (Diener & Biswas-Diener, 2009, p. 135). In fact, some forms of mortality and morbidity (health indicators presumably associated with happiness/well-being) could rise during upturns and decrease during economic downturns (Bacigalupe & Escolar-Pujolar, 2014; Copeland et al., 2015; Karanikolos et al., 2013; Kentikelenis et al., 2011; Ruhm, 2005; Stuckler & Basu, 2013).
Earlier studies have shown that change in the unemployment rate had significant impact on well-being (Arampatzi, Burger, & Veenhoven, 2014).
Furthermore, subjective insecurity and the role of institutions seem to have an impact on well-being (Chung & Mau, 2014). There is a positive association between the degree of democracy and satisfaction with life (Dolan, Peasgood, & White, 2008). Especially in universal welfare states (such as Finland), there are high mutual trust and trust in public institutions and democracy and small corruption (Eurofound, 2012; Rothstein, 2011). Political stability has robustly significant effects on happiness (Wang & Sunny Wong, 2014). During crises, politics change as a response, and will in turn impact on the well-being of those people affected. Good governance is more strongly associated with satisfaction with life than GDP per capita (Helliwell & Huang, 2008; Rothstein, 2011).
Country Descriptions
Capability—regarded as set of alternative functionings that a person can attain, is strongly influenced by the social structures and institutions in each country (Robeyns, 2005). The country descriptions aim at presenting possible constraints on individual freedoms and opportunities (i.e., individual capacity to make autonomous choices and pursue a fulfilling life, Graham & Nikolova, 2014), by using objective capability measures.
Recessions, Fall in GDP and Income, Inequality and Increase of Debts
A recession is defined as a business cycle contraction in two down consecutive quarters. In Greece, it lasted for 63 months (Q3.2008 until Q2.2014); In Ireland, it lasted for 30 months (Q2.2007 until Q3.2007 and Q1.2008 until Q4. 2009); In Portugal, it lasted for 45 months (Q2.2007 until Q3.2007, Q1.2008 until Q1.2009, and Q4 2010 until Q1.2013); In Spain, it lasted for 48 months (Q2.2008 until Q4.2009 and Q2.2011 until Q2.2013): In Finland, it lasted for 30 months (Q1.2008 until Q2.2009, Q2.2012 until Q1.2013) (https://stats.oecd.org/index.aspx?queryid=350; Quarterly national accounts).
Fall in GDP per capita occurred during 2007 to 2009. We saw a recovery in 2010, but a new fall took place in 2011/2012 and a new small recovery in 2013 (Figure 1).
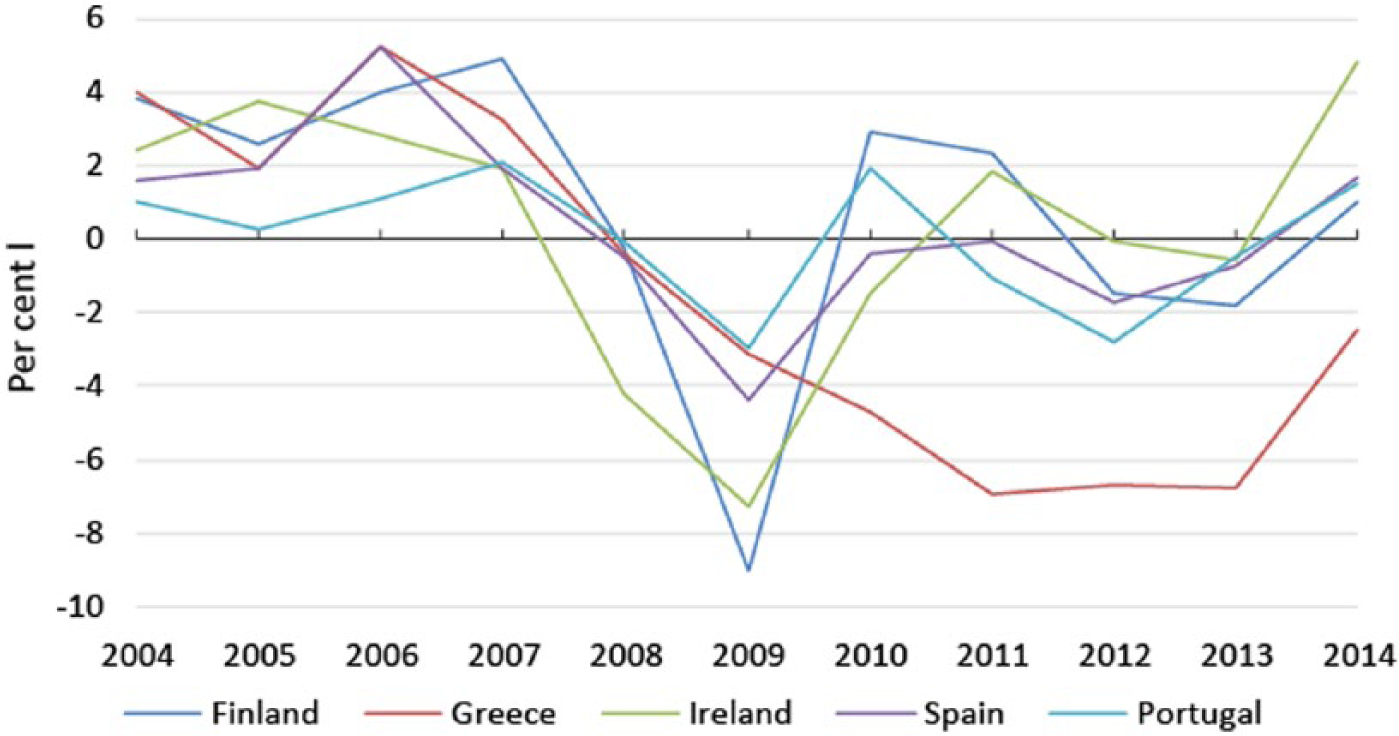
Change in real GDP per capita.
GDP per capita (Purchasing Power Parity [PPS]) has thus decreased strongly in the PIGS-countries. Setting EU28 = 100, it has in Greece fallen from 96 in 2004 to 73 in 2014, in Portugal from 80 to 78, in Ireland from 146 to 134, in Spain from 100 to 91, while in Finland there was stagnation (114 to 113) (Eurostat, 2015a). From 2007 to 2011 (2014), there has been a considerable increase in disposable income inequality in Spain, but not in any of the other countries (Eurostat, 2015c; OECD, 2014a).
Unemployment
Unemployment rates have gone up in all these four countries, in contrast to Finland. The figures have almost tripled from 2002 to 2013/2014 (Eurostat Yearbook, 2013).
Long-term unemployment (as a share of the active population) has quadrupled from 2008 to 2011 in Spain, Greece, Ireland, while it has increased with 50% in Portugal (World Health Organization-Europe, 2013). The economic crisis has only to a limited extent affected the Finnish labor market.
Public Expenditures and Debts
People in all these four PIGS-countries had to pay a heavy price in the form of reduction in public expenditures such as stricter targeting criteria for social benefits, cuts in salaries, cuts in health budgets, pension reform (such as increased pension age), privatization of public sectors companies, lay-offs, and higher taxes.
As a consequence of decreased GDP, government deficits in percentage of GDP have increased and was in 2010: 31.3% (Ireland), 10.6% (Greece), 9.8% (Portugal), and 9.3% (Spain), resulting in higher ratio of government debt to GDP (general gross debt) at the end of 2010. Since 2010, debts have increased strongly in all these countries. In 2012, Greece’s gross debt was 157% of GDP, followed by Portugal (124%), Ireland (117%), and Spain (86%), while in Finland, it was 53%. 2 The highest level of general government gross debt was reached in Greece with 180% of GDP in 2014. The same was the case for Portugal (130%), Ireland (120% in 20012), and Spain (99%) (European Commission, 2014; Eurostat, 2015b).
Percentage change in real public expenditures (2007/2008 to 2012/2013) was especially strong in Greece (−17.6%), while there was an increase in Spain (+17.6%) and Portugal (+4.3%) (Petmesidou & Guillén, 2014).
Health expenditures in real terms per capita fell annually in real terms from 2009 to 2013 with 7.2% in Greece, with 3.3% in Portugal, with 4% in Ireland, with 1.6% in Spain, while there was an 1.3% increase in Finland (OECD, 2015a). Access to health care during the Great Recession has decreased, and co-payments have gone up, while need for medication for depression have gone up (Stuckler & Basu, 2013).
Cuts in cash benefits, and fall in their real values due to inflation, have had the greatest negative impact in Greece. Such cuts in Greece, Ireland, and Portugal have been imposed on them because of the European Union-International Monetary Fund (EU-IMF) loan program. All the four Pigs-countries have met strong pressures to reduce their budget deficit to 3% by 2014, while maximum debt is set at 60% of GDP in accordance with EU’s Stability- and Growth pact. EU’s “Excessive Deficit Procedures” were set in force toward Ireland, Greece, and Spain as early as in October 2008, immediately reducing their loan capacity. Greece had to accept a loan program in 2010 (rescue package 110 billion Euro) and another in February 2012 (rescue package 130 billion Euro). These rescue packages obliged Greece to accept comprehensive cuts in expenditures and large tax increases. 3 Ireland had to use EU-IMF loan in 2010 (rescue package 67.5 billion Euro), Portugal in 2011 (rescue package 78 billion Euro), while Spain in 2012 had to accept a rescue loans for the banks of 100 billion Euro. The stabilization programs imposed by EU-IMF ended for Ireland in December 2013, in Portugal in May 2014, while the second stabilization program for Greece, which started in 2012, will last for three more years. 4 As a result these countries had to undertake labor market reforms, resulting in substantial changes: More or less dismantling of collective bargaining, more insecure, flexible jobs, and lower minimum wages.
It seems that apart from Greece, the other three countries Ireland, Spain, and to a certain extent Portugal were more or less equally hit by the crisis (number of months in recessions, decrease in GDP per capita, and increase in unemployment levels). As a consequence, household disposable income fell from 2007 to 2011 with 21% in Ireland, 13% in Spain, 9% in Portugal (OECD, 2015b), while in Greece it fell with 25% from 2008 to 2011 (OECD, 2013a).
Trust
All these countries, with the exception of Finland, have a population with low trust in government (Eurofound, 2012; OECD, 2014b). We find reduced trust in police and in the legal system especially in Greece (Helliwell & Wang, 2013). Changes in social trust (in the police and the legal system) are found to be the primary contributors to changes over time in subjective well-being in European countries (Helliwell, Huang, & Wang, 2014). Distrust breeds distrust, not least with a perceived increase in corruption (Sachs, 2015): Perception of corruption is negatively and strongly associated with low evaluation of life (happiness) according to regressions on national averages levels (Helliwell et al., 2015).
It is hard to distinguish between countries that were equally hard hit by the economic crisis, but where some have had strong austerity measures and others not, as there is a high correlation between the severity of the crisis and type of austerity measures (OECD, 2014b, see also Saltkjel, Ingelsrud, Dahl, & Halvorsen, in press). On the basis of the theoretical point of departure and country descriptions, I nevertheless tentatively hypothesize that the Greek people have had the most negative development in well-being experiences, followed by the Spaniards and, and to a smaller extent the Irish and the Portuguese, compared with the reference country, Finland.
Accompanied with lower satisfaction with life is lower personal trust (Helliwell & Wang, 2011), which could be seen as a consequence of political instability due to the recession. Therefore, fall in personal and political trust can be expected, being more strongly associated with (low) satisfaction with life in 2013 than in pre-crisis period, particularly in Greece.
Data and Research Design
I am using cross sectional datasets from ESS mainly from the period 2002 (Wave 1) to 2014 (Wave 7) in the PIGS-countries. Especially the South Mediterranean states have been characterized as “familist” welfare states. The role of the Catholic Church and non-governmental organizations (NGOs) has been of great importance in Spain and Portugal, while the Eastern Orthodox Church has played a less important in promoting welfare in Greece (Petmesidou, 2013). The (traditional) families in these states have been used as “social shock absorbers” responding to a wide range of risks (Ferrera, 2010). Also in Ireland being a catholic state, its people have put strong emphasis on the family. Finland, being a secular, universalistic welfare state with an individualistic culture, not much hit by the crisis, is used as a benchmark. Although a EURO-zone country, it is at the same time an example of the well-performing Nordic countries on most indicators of welfare and democratic development. In terms of happiness scores, Finland was ranked sixth among 158 countries in the World Gallup Poll 2012-2014 scores during that period (Helliwell et al., 2015). The strong social fabric of the Finnish society has enabled people to overcome earlier crisis (Böckerman & Ilmakunnas, 2006).
In both waves (ESS, 2004, 2014) used in the comparison, the response rates were at acceptable levels, varying between 50% and 78%. Surveys for the ESS Round 7 were in Spain and Portugal conducted during 2015, which is up to 2 years later than EU-SILC 2013 (see later).
I have used as recommended by ESS design weights/population weights to compensate for skewed distribution on central background variables in the samples.
ESS-data are supplemented with EU-SILC 2013 and its ad hoc well-being module
in order to include the development in Greece, and for the purpose of a robustness check by comparing data from EU-SILC 2013 with European Social Surveys 2014 (7th round). The advantage of EU-SILC 2013 is the greater number of respondents, and as a consequence reduced confidence intervals of coefficients in the regressions. Besides, it also includes data from Greece, which were missing in the 2012 and 2014 rounds of European Social Surveys (www.europeansocialsurveys.org).
EU-SILC 2013 surveys are done partly by personal interviews and partly by telephone interviews. I have used EU-SILC2013 personal weights.
In the comparisons, I am using ordinary least squares (OLS) hierarchical regression in IBM SPSS statistics 23.
The Dependent Variable: Definition and Measurement of Subjective Well-Being
I am using an evaluative dimension of subjective well-being, namely, satisfaction with life—being an overall cognitive assessment of life. The validity and reliability of satisfaction with life has been amply documented to be high (see, for example, Adler & Seligman, 2016; Bok, 2010; Diener, Inglehart, & Tay, 2013; Durand & Smith, 2013; Layard, 2005; OECD, 2013b). As expected, this overall cognitive assessment of life is strongly correlated with material conditions, social relationships, and health (Eurostat, 2015d). It also seems that this indicator is sensitive to change in political measures.
Satisfaction with life is proxied by this item (in ESSs): “All things considered, how satisfied are you with your life as a whole nowadays. Please answer using this card, where 0 means extremely dissatisfied and 10 means extremely satisfied.” This 11-point scale is thus running from 0 to 10. In EU-SILC 2013, satisfaction with life is measured in a similar way, but where score 0 means not at all satisfied and score 10 means fully satisfied for last 4 weeks. This categorical variable can be regarded as continuous, making it feasible to use OLS regressions. Both surveys have the same numbers of response options, but as shown, the wordings are not identical: “extremely dissatisfied/extremely satisfied” versus “not at all satisfied/fully satisfied.” Besides, ESS refers to “nowadays” while EU-SILC refers to “last four weeks.”
Independent Individual Variables
Based on earlier findings, I hypothesize that the main explanatory individual factors explaining variance are supposed to be unemployment, subjective health (Suhrke & Stuckler, 2012), material deprivation (Eurofound, 2013), political and personal trust (Growiec & Growiec, 2014; Helliwell & Wang, 2013; Helliwell et al., 2015; Mertens & Beblo, 2016; Owen & Philips, 2015; Veenhoven, 2008), but being moderated by family network and support/help from family (Mikucka, 2014). Health status is also a good predictor of subjective well-being (Eurofound, 2013), but is here regarded as an independent variable. 5
Household income levels and national wealth have strong effects on social well-being, but particularly for low-income households (Deeming & Jones, 2013; Eurofound, 2012; Eurostat, 2015d; Pew Research Center, 2014). Because the attrition of a household income variable is substantial for several of the countries, I have instead included a variable of self-perceived household financial difficulties. 6 Objective measures of household income show that self-perceived difficulties are real (OECD, 2014b). Especially households with poor savings have difficulties to cope with reduced household income, unless social support measures can compensate for this income loss (OECD, 2014b). Greater economic hardship may also affect negatively social relationships and attitudes toward others (OECD, 2014b).
Mistrust may occur because of bad times and dysfunctional (untrustworthy) government institutions (Rothstein, 2011), and having a negative impact on well-being, mediated through, for example, the extent of optimism about the future (Eurofound, 2012). I control for personal trust and social relationships—being central indicators of social capital (Sachs, 2015). Social networks can protect people against negative impact of financial hardship and well-being (Growiec & Growiec, 2014). Social connectedness (the role of the family and social connections) has been found to be central for well-being promotion (Delle Fave, 2014). I have measured connectedness through a variable based on a question whether the respondent had anyone to talk about personal mattes or not (intimacy). This variable is regarded as a mediating factor in the regressions.
Financial crisis can harm health or improve health as mentioned earlier. Health status has been found to be the most notable predictor for general life satisfaction (Eurostat, 2015d). There seems to be a strong reciprocal relationship between ill health and employment status, due to both selective processes and health effects of unemployment (Heggebø & Dahl, 2015). I have entered self-reported health to represent the health of the individuals (fair, bad, or very bad is coded 1; good or very good is coded 0), as well as a variable about being hampered in daily life due to a chronic long-standing illness (answered yes = 1, no = 0) as independent variables.
Control variables are dummies for sex, age (20-29 years vs. 30 years and older), marital status (being single—living in a one-person household), and finally educational level (primary education versus all other educational levels), as an indicator of socioeconomic status.
Descriptive Statistics
In the following, I am restricting the analyses to age group 20 to 59 years, which is the working age population, most likely hardest hit by the recession.
Both gender and age are quite similar in all samples that I am comparing, while there are dissimilarity between ESS and EU-SILC when it comes to proportion of single persons and people with low education. The most noteworthy of the descriptive statistics is the high proportion having low education in Portugal (results not presented, but are available by contacting the author).
As shown in Table 1, until 2004 (Greece 7 and Ireland) and 2006 (Spain and Portugal), there was an increase in average satisfaction with life, turning downward in 2008 (Greece, Ireland, and Spain), with another reversed trend in 2010 (Portugal) or 2012 (Ireland). In Spain, there has a steady fall in satisfaction with life since 2006. Yet, when using standard deviations as a measure of inequality, it does not seem that there has been greater inequality in satisfaction with life in any of these countries, with Spain and possibly Portugal being exceptions.
Satisfaction With Life by Country (20-59 Years) Means Scores (+ Standard Deviations) 2002-2014. ESS Data: Weight = Design Weight, Population Weight.

Source. European Social Survey, cumulative file first to sixth round, seventh round, EU-SILC 2013.
Note. F test: All differences across countries and within countries are significant at .001 level, except between Greece and Portugal in 2013 EU-SILC. EU-SILC = European Union Statistics on Income and Living Conditions.
Multivariate Analyses
External circumstances are controlled for by entering country as dummy variables in the OLS regressions, 8 using Finland as a reference category (Model 1, Table 2). A dummy variable is meant to represent the different characteristics of the country that we are comparing, but being unobserved. All country coefficients have changed from 2004 to 2013/2014, but not all of them are significant (having overlapping confidence intervals). These changes demonstrate mostly worse satisfaction with life, with the exception of Portugal, where there has been an improvement, although not significant when comparing the 2004 and 2014 data (overlapping confidence intervals), albeit with a lower starting level than the other countries (see Table 1). Yet, the worst development since 2004 according to these data was unexpectedly found in Ireland, followed by Spain and Greece. The next step is to check whether these country differences hold when controlling for individual variables.
OLS Regression Satisfaction With Life as a Whole by Country (2004-2014; Age Group = 20-59 years. Weight by Design Weight/Population Weight).

Note. All coefficients are significant at 0.01% level or lower. EU-SILC = European Union Statistics on Income and Living Conditions; OLS = ordinary least squares; CI = confidence interval.
Table 3 (Model 2) analyzes individual variation in satisfaction with life, including controls for living in a certain country. The country differences are smaller, and none of the coefficient changes from 2004 to 2013/2014 are significant, again with the exception of Portugal. Explained variance increased a lot, both on the 2004 and 2013 data. This suggests that the main changes in aggregate satisfaction with life (Table 1) can be attributed to individual characteristics and changes in these.
OLS Regression Satisfaction With Life by Country and Individual Variables (2004-2014) (Age Group = 20-59 Years; Weight by Design Weight/Personal Weight).

Note. OLS = ordinary least squares; EU-SILC = European Union Statistics on Income and Living Conditions; CI = confidence interval.
EU-SILC 2013: coding 1 includes also “with some difficulty” (see Note 8).
Anyone to discuss personal matters with?
Significant at .05 level, all other coefficients significant at .01 level.
Some of the individual variables are influenced by the crises, such as own unemployment, household’s economic situation, trust, and possibly health. All these factors are associated with satisfaction with life both in 2004 and 2013 (Greece is included in both surveys). Yet, personal trust and political trust are the only independent variables that were of greater significance in 2013 than in 2004 (not overlapping confidence intervals), apart from health and being hampered in daily activities. Keeping in mind that social trust and trust in governments are causally related (Rothstein, 2011), these factors tell us about the political crisis in the PIGS-countries. 9 Economic hardship explains significantly more of the variance in 2014 data compared with 2004, but not compared with 2013 data (EU-SILC). Unemployment does not explain more of the variance in 2013/2014 than in 2004. As demonstrated, the higher the unemployment rate, the weaker the effect of individual unemployment (Heggebø & Dahl, 2015). This may be due to less stigma and self-blame when the unemployment rate is high. There are rather different social compositions of the unemployed in good versus bad times. The reason why being unemployed does not have greater impact in 2013/2014 than in 2004 could also be due to the fact that the reference category includes employed with a greater proportion with temporary contracts in 2013/2014 than in 2004 (Eurostat, 2014). In many respects, temporary workers may experience the same uncertainty about the future as the unemployed.
Yet, changes between 2004 and 2014 in country coefficients compared with Finland as reference category are insignificant when individual characteristics are controlled for, again with the exception of Portugal (significantly to the better). As is demonstrated, individual coefficients explain much more of the variance than country coefficients. The quality of social relations (having someone to talk to about personal matters with) is associated with higher satisfactions with life in all regressions, but particularly in EU-SILC 2013. The importance of quality of social relations is in line with others studies on satisfaction with life/happiness (see, for example, Helliwell et al., 2014).
Keeping in mind that ESS 2014 does not include Greece, in contrast to EU-SILC 2013, coefficients in both surveys have the same sign (living alone is the only exception), but the magnitude is dissimilar, for example, the coefficients of economic hardship and intimacy. Nevertheless, this comparison indicates that the findings are robust.
Table 4 presents interaction effects between country and main explanatory variables (unemployment, financial hardship, health, personal trust, and political trust). These are selected according to existing literature and theory in this field (see “Theory and Research Questions” and “Drivers of Satisfaction With Life: Recent findings” sections) In 2004 (ESS data), due to the small number of respondents, the only significant (at 5% level) interaction effect was found between political trust and Portugal, and between health and Greece (results not presented).
Regression Satisfaction With Life With Interaction Effects Country and Main Independent Variables (EU-SILC 2013, B-coefficients).

Note. All coefficients are significant at 0.01% level, expect those marked ns. All standard errors are between 0.01 and 0.10.
Based on EU-SILC 2013 data, Table 4 (Model 3 with interaction effects) demonstrates that unemployment is associated with lower satisfaction with life in Portugal Spain and Ireland, but only to a small extent in Greece. On the contrary, Greece had the most negative impact of political trust on satisfaction with life compared with the reference category Finland, followed by Portugal and Spain. Being healthy seems to be positively associated with satisfaction with life in Greece, while being of no importance in Spain. Bad subjective health was particularly associated with low satisfaction with life in Ireland.
Finally, Ireland is different with financial hardship being positively associated with satisfaction with life, while there was a small negative association in Greece and no in Spain (all compared to the reference category Finland). Compared to results presented in Table 3, both ESS 2004 and ESS 2014, one may suspect that this is due to different wording of the question about financial hardship in EU-SILC 2013 (see Note 6).
The association between personal trust and country is small but significant in all countries compared to Finland.
The lower satisfaction with life in Greece compared with the reference category (Finland) is thus as hypothesized to a great extent associated with lack of political trust, to a certain extent with households’ economic situation, but not with unemployment or health.
Model 3 (Table 4) with interaction effects improves the model fit (F test in SPSS) from R2 .483 to .487, which is significant at .01 level, but only marginally (results not presented).
Finally, separate regressions were run with interaction effects between country and socioeconomic status (measured through education level). These indicate that low socioeconomic status in 2013 (in contrast to 2004) had the strongest negative impact on satisfaction with life in Portugal, followed by Spain and Greece, with lowest impact in Ireland, again with Finland used as a reference category (results not presented).
Discussion
I have in this article thrown light on three research questions: (1) To which degree the financial crisis of 2008 and the subsequent recession was associated with reduced well-being among people in the four hardest affected EURO-countries? (2) Are there particular mechanisms at the individual level in each country that are responsible for the assumed negative impact of crisis on well-being? and (3) Are lower socioeconomic groups more severely hit than the better off? At country level, the greatest significant fall in satisfaction with life from 2004 to 2013 was in Ireland, followed by Spain and Greece, while there was an improvement in Portugal. These results are not as hypothesized and not fully in accordance with, for example, Blanchflower and Oswald (2011), perhaps due to a different time span. When controlling for individual characteristics, satisfaction with life does not differ significantly among people in Spain, Ireland and Greece, while the Portuguese, having a low starting point, are significantly more satisfied with life in 2013/2014, when comparing with Finland, used as a benchmark. This suggests that individual’s capability and functioning is not only influenced by the economic and political development (macro-factors), but by individual factors such as education, household situation, financial situation, employment status, and health.
Worse subjective health cannot significantly explain more of the variance of satisfaction with life in 2013/2014 than in 2004, in any of the four countries under study, with a possible exception for Ireland. On average, subjective health has improved or been stable. That is also the case for inequality in health being rather stable (as measured by standard deviations) in all five countries (results not presented). Yet, fall in life satisfaction can be regarded as a leading indicator pointing to later serious health problems (OECD, 2014b). Most of the associations between individual characteristics and satisfaction with life are in accordance with previous findings.
The fundamental question is whether these results give support to a hypothesis about a statistical connection between the economic crisis in the PIGS-countries and average satisfaction with life. Such a hypothesis implying that Greece may experience the greatest fall in satisfaction with life is not supported by the data. A 25% fall in GDP per capita have resulted only in a 6% fall in average satisfaction with life. In fact, the strongest decline was found in Ireland (where the crisis ended in 2009/2010) and Spain, while there actually was an improvement in Portugal. Because average subjective well-being within OECD nations also was found to be unaffected by various economic and environmental crises (Veenhoven, 2005), one could perhaps name the development “The Paradox of Happiness in Hardship” (Austin, 2016).
What about increasing socioeconomic differences? During the crisis, there has not been an increase in standard deviations of satisfaction with life (Table 1), but still there could be increasing socioeconomic differences, with, for example, persons with lower education more hard hit by the crisis than others (van der Wel et al., 2016). This seems to be the case: Low education explains more of the variance on satisfaction with life in 2013 than in 2004. This seems to be especially the case in Portugal, where there was on average an increase in satisfaction with life during the crisis. Besides, people having no one to talk intimately with (i.e., being socially isolated) seem to be hardest hit by the economic downturn.
Adaptive preferences may explain why PIGS-countries have not experienced a much greater average fall in satisfaction with life: People seem to get used to worse living conditions and reduce their expectations accordingly (Elster, 1983). According to Sen (1985), this adaption can be regarded as a survival strategy. It is attributed to a necessity of keeping up self-esteem, control, and optimism (Cummins, 2003). Related is a habituation effect of unemployment as it becomes more common (Mertens & Beblo, 2016).
Which alternative factors than economic decline and fall in employment could have an impact on changes in satisfaction with life in these countries? The following aggregate factors have been highlighted in recent research (apart from those already mentioned: institutional trust, social justice, and corruption).
Family resilience: Families, when they can, actively adapt to adverse circumstances, such as drawing on savings or reducing non-essential consumption (OECD, 2014b
A large informal economy in Greece may also have had a buffering impact (Petmesidou, 2013), as well as in Spain: Spain’s black economy was by the end of 2012 24.6% of GDP, up from 17.8%, when the crisis began in 2008 (“Spain’s Black Economy,” 2014).
Multilevel resilience may thus have helped the population to resist and adapt to health threats due to the economic crisis (Karanikolos et al., 2013). Resilience against economic hardship is dealt with through immaterial resources from civil society, but less so among the most deprived (Reeskens & Vandecasteele, 2016). Examples are trends toward refamilialization (particularly in Ireland and Spain, cf. OECD, 2014b), emigration in Spain and Portugal, emergence of local solidarity groups in Greece, and buffers from family (youth living at home and/or getting some support from parents or grandparents), charities, and some regional efforts in Spain. Although macro-level factors play a role in reducing peoples capabilities to achieve subjective well-being, multilevel resilience, from families, the informal economy and voluntary organizations may have played a moderating role.
Strengths and Limitations
The strength of this article is the use of ESSs over a 10-year time span, where the same question about satisfaction with life has been used in all survey rounds. The dependent variable used is highly recommended and has high reliability and validity as an indicator of evaluative well-being. Another advantage is the use of EU-SILC 2013, which gave me the opportunity to conduct a robustness check of the main data, as well as being able to include Greece in the analyses. Because different individuals are interviewed each year (cross-sections), I cannot address the issue of causality. The positive association, for example, between subjective health and satisfaction with life postulates that health impacts on satisfaction with life, but in reality the causality runs both ways (Graham & Nikolova, 2014).
Despite what has been said earlier about the reliability and validity of the dependent variable—satisfaction with life, there is evidence that respondents tend to downplay negative circumstances when answering to such questions in surveys (Ponocny, Weismayer, Stross, & Dressler, 2015). This does not necessarily affect comparisons over time and across countries, although giving a too favorable estimate of the absolute level of satisfaction with life. But there may be a problem if the tendency to downplay negative circumstances differs between various categories of people.
In line with most other comparative studies on changes in satisfaction with life, this study is based on cross-sectional data. To develop further changes over time within as well across countries, panel data (longitudinal data) are much needed in future research on this topic.
Conclusion
The assumption that economic decline with certainty reduces satisfaction with life does not find full support in the analyses presented. I have shown that satisfaction with life has fallen somewhat in the PIGS-countries, Portugal being an exception. Compared with the reference category, the changes are small and/or insignificant (overlapping con-fidence intervals). I hypothesized that Greece who had the greatest decline in economic activity and a subsequent increase in unemployment level would have seen the greatest fall in satisfaction with life. In fact, it was Ireland, where bad health had a strong negative influence shown by the interaction effects. Furthermore, interaction effects between a country’s unemployment and individual unemployment on satisfaction with life were strongest in Ireland and Portugal with lowest level of unemployment, followed by Spain with high levels of unemployment. As expected, there was a great interaction effect between political trust and Greece on satisfaction with life.
Greater socioeconomic inequalities in satisfaction with life due to the recession from 2004 to 2014 seem to be most pronounced in Portugal. In addition, I identified socially isolated persons and low educated as being hardest hit by the crisis. The least satisfied are in the lowest income decile (Pew Research Center, 2014).
In countries heavily affected by the “Great recession,” peoples’ capabilities have been reduced, resulting in worse functionings, in particular due to unemployment, lower incomes, and financial hardship that follow from a recession and austerity measures. The economic crisis has resulted in a political crisis and less trust in the political system/politicians. These factors reduce the freedom to make life choices, most likely resulting in pessimism about the future and hopelessness. Surprisingly, I did not found worse subjective health being a consequence of the recession. The situation in terms of well-being would have been worse in these countries if not multilevel resilience had played a moderating role (by families, NGOs, regions, and municipalities).
However, lower satisfaction with life can influence negatively on peoples’ future health and life chances. Widespread pessimism about the future may in itself contribute to delay the reemergence of a healthy economy. The social policy implications of these findings are apart from the long-term goal of restoring economic growth and improving employment possibilities, to strengthen the social protection schemes. In addition, redistributive income and tax policies would be helpful for easing the financial burden of poor families. Fighting corruption and restoring trust in public institutions will also be necessary, especially in Greece. The very difficult situation in Spain and Greece in 2013/2014 resulted in a political crisis for the traditional political parties, triggering strong popular support for left-wing parties; Syriza in Greece and Podemos in Spain—with uncertain political outcomes at the time of writing.
Footnotes
Declaration of Conflicting Interests
The author(s) declared no potential conflicts of interest with respect to the research, authorship, and/or publication of this article.
Funding
The author(s) disclosed receipt of the following financial support for the research, authorship, and/or publication of this article: The paper is part of the project “Health Inequalities, Economic Crisis and the Welfare State”, financed by the Research Council of Norway (grant number 221037)