
Abstract
Research on teacher outcomes of the School-Wide Positive Behavior Support (SWPBS) model has been scarce. The present study adds to the knowledge base by examining the effects of the Norwegian version of SWPBS (N-PALS) on school staffs’ behavior management practices and on their individual and collective efficacy. Questionnaire data were collected from staff and students (Grades 4-7) at four measurement points across four successive school years in 28 intervention schools and 20 comparison schools. Using longitudinal multilevel analyses, indications of positive 3-year main effects of the N-PALS model were observed for staff-reported collective efficacy, self-efficacy, and positive behavior support practices. The intervention effects as measured by Cohen’s d ranged from .14 to .91. The effects on student perceptions of teachers’ behavior management strategies were, however, not consistent with the positive staff ratings. Results are discussed in relation to prior research, future research, and study limitations.
Keywords
Important relations have been documented between teachers’ behavior and efficacy perceptions and students’ learning and conduct. Prior studies have indicated that low levels of student problem behavior, proactive classroom management, and a positive school climate support teachers’ emotional wellbeing and their sense of efficacy, which in turn facilitate students’ academic and social-emotional learning (e.g., Oliver, Wehby, & Reschly, 2011). Teachers’ ability to organize classrooms and manage the behavior of their students is associated with high perceived efficacy and perseverance and appears to induce positive academic and psycho-social outcomes for students (Gibbs & Powell, 2011). Conversely, teachers struggling with classroom discipline often report high levels of stress and are frequently ineffective (Brouwers & Tomic, 2000).
A promising approach in the endeavor to prevent and manage student misconduct is the School-Wide Positive Behavior Support Model (SWPBS; Sprague & Walker, 2005), in which promoting staff efficacy, establishing more systematic and collective approaches, and more inclusive and supportive learning environments are key priorities. Since 2002, SWPBS has been implemented in more than 200 Norwegian elementary schools (7.5%) under the acronym N-PALS. SWPBS is a longitudinal and demanding model to implement, and to maintain the school staff’s motivation and effort to implement the model with high fidelity across time it is essential to experience positive impacts not only for students but for staff as well. Accordingly, examining potential teacher outcomes is important in its own right, although research on teacher outcomes of SWPBS has been scarce (Ross, Romer, & Horner, 2012). The present study contributes to the knowledge base by examining the effects of N-PALS on school staffs’ behavior management and on staffs’ perceived individual and collective efficacy.
Teacher Self-Efficacy and Collective Efficacy
Based on social cognitive theory, it has been proposed that teachers’ sense of individual and collective efficacy promotes positive teaching practices that in turn result in enhanced student learning (Klassen & Tze, 2014). Within the school context, the construct of self-efficacy has been defined as the individual teacher’s belief in his or her capability to affect student outcomes, particularly for unmotivated or difficult-to-teach students (Tschannen-Moran, Woolfolk Hoy, & Hoy, 2008). Teachers with a strong belief in their own efficacy are assumed to set more challenging goals, take more personal responsibility for student outcomes, and be more open to new teaching methods. Moreover, such teachers are more likely to be successful in implementing new programs, to be motivated to cope effectively with student misconduct, and to successfully manage challenges in the classroom (e.g., Tschannen-Moran et al., 2008). Collective efficacy refers to school staffs’ shared beliefs regarding their combined ability to organize and execute courses of action required to produce student success (Goddard, Hoy, & Woolfolk Hoy, 2004). Teachers’ collective efficacy and teachers’ self-efficacy are related but distinct constructs that vary across schools (e.g., Gibbs & Powell, 2011).
Relations Between Teacher Efficacy and Student Behavior
The majority of studies on efficacy in schools have focused on the relation between teacher self-efficacy and student achievement while there is little empirical evidence regarding how teachers’ efficacy beliefs influence student behavior (Gibbs & Powell, 2011). A small-scale Israeli study indicated a significant positive relation between teacher self-efficacy and responses to student classroom behavior (Almog & Shechtman, 2007). Jordan and Stanovich (2003) found that teachers who expressed lower self-efficacy appeared less tolerant of problem behavior and unusual learning patterns and more likely to use punitive and reactive discipline strategies and seek exclusion of “problematic” students. As concerns the relationship between student problem behavior and teacher collective efficacy, Gibbs and Powell (2011) found that “efficacy for addressing external influences” as a component of the teachers’ collective efficacy beliefs was significantly and inversely associated with the number of students excluded because of problem behavior. In a Norwegian study, Sørlie and Torsheim (2011) found a strong inverse but also reciprocal (bi-directional) relationship between collective efficacy and the level of problem behavior in schools, both concurrently and over time.
Effects of SWPBS on Teacher Efficacy
A few studies examining the effects of SWPBS on teacher self-efficacy have been published although no prior effectiveness study has examined the effects on collective efficacy in schools. Kelm and McIntosh (2012) examined aspects of self-efficacy in a controlled study and identified a large, significant effect of SWPBS on teachers’ self-efficacy when controlling for school effects (d = .80). Ross and Horner (2007) found a significant effect on teachers’ self-efficacy in SWPBS schools with high fidelity scores (n2= .29). A recent study also reported significantly higher perceived self-efficacy in schools with higher SWPBS implementation scores (Ross et al., 2012). Conversely, Oakes, Lane, Jenkins, and Booker (2013) observed no differences in perceived self-efficacy between teachers or between groups of high- and low-implementing teachers in a study of two middle schools that had implemented a model called “Comprehensive, Integrated, Three-Tiered Model of Prevention” for 1 year. This model was an extended version of the original SWPBS model, in which academic, behavioral, and social skills programming were addressed within one integrated framework (Oakes et al., 2013). Also, in a randomized study, Bradshaw, Pas, Goldweber, Rosenberg, and Leaf (2012) compared teacher self-efficacy in 22 schools implementing the standard SWPBS model with 20 schools implementing an adapted version called PBISplus. In PBISplus, implementation of tier two supports is specifically addressed, and the schools are provided tailored training by an external coach in functional behavioral assessments, student support teaming process, cultural adaptation, and evidence-based practices. A significant intervention effect on teacher self-efficacy favoring the adapted version was identified (Bradshaw et al., 2012).
Thus, prior research indicates (a) a consistent, moderate, and most likely reciprocal association between teachers’ efficacy beliefs and student outcomes, both academically and behaviorally and (b) that the SWPBS model may positively affect the teachers’ individual sense of efficacy, particularly in high-implementation schools. We hypothesized that the model as implemented in Norway would have positive influences on staffs’ self-efficacy beliefs as well as on their perceptions of the capability of the entire collegium.
Behavior Management and Student Behavior
Improving teachers’ use of evidence-based, proactive, positive practices in their handling of misconduct and vulnerable students is another “cornerstone” of SWPBS. Teachers’ behavior management is assumed to influence student behavior primarily by reinforcement. Many teachers, however, appear unaware of their influence on student behavior and of the reciprocal relationship between student behavior and the teacher’s own behavior (Sutherland & Oswald, 2005). Student problem behavior is partially fostered by ineffective instruction and punitive disciplinary practices, which often characterize the school system’s response to problem behavior (e.g., Clunies-Ross, Little, & Kienhuis, 2008).
Behavior management comprises both positive behavior support and behavioral corrections and is sometimes referred to as classroom management. Positive behavior support addresses proactive strategies that influence student behavior by teaching and learning the rules and norms of expected behavior and by supporting prosocial behavior such as praise, positive attention, pre-correction, active behavior supervision, and rewards (token economy). Effective behavioral corrections include predictable responses to inappropriate behavior in the form of mild consequences such as reprimands, re-learning of rules/expected behavior, time-outs, or parent reports.
There is no empirical evidence that harsh and intrusive reactions to student problem behavior such as suspension, expulsion, detention or referring students to the principal have any beneficial effects or deter future misconduct (e.g., American Academy of Pediatrics Council on School Health, 2013). Conversely, mild and less intrusive strategies such as verbal reprimands, commands, and removal of reinforcing activities following rule-breaking behavior may have positive effects on disruptive classroom behavior (e.g., Nelson & Roberts, 2000). Such responses appear more effective if combined with contingent reinforcement of prosocial behaviors, as recommended in the SWPBS model (Sprague & Walker, 2005).
Contingent use of positive social reinforcement has repeatedly been shown to have positive effects on student conduct (e.g. Oliver et al., 2011) and an effective classroom management tool (e.g., Maggin, Chafouleas, Goddard, & Johnson, 2011). Moreover, a few, clear, and positively stated rules have been found to increase students’ on-task behavior and willingness to follow school rules (e.g., Gable, Hester, Rock, & Hughes, 2009). As emphasized in SWPBS, effective behavior management, including adequate and systematic responses to disruptive behavior, appears to be a prerequisite for efficient handling students at moderate to high risk of conduct disorder.
Effects of SWPBS on Behavior Management in School
With the exception of two single-school studies, we have not been able to identify relevant prior studies investigating the impacts of SWPBS on the teacher behavior. In their study, DePry and Sugai (2002) followed one sixth-grade teacher in a rural SWPBS school for a month. The focus was on immediate effects of the teacher’s behavior management practices on minor behavioral incidents in class. The data indicated a positive relation between teacher behavior and student behavior: a relatively low level of active supervision and pre-correction resulted in moderate decreases in the students’ problem behavior. Myers, Simonsen, and Sugai (2011) conducted their multiple baseline study among four teachers in a middle school (Grades 5-8) that was in its second year of SWPBS implementation. As hypothesized, the study results indicated that teachers increased their rates of praise statements when provided with a continuum of performance feedback dependent on their individual needs. Parallel to the increase in use of praise, a downward trend in student off-task and disruptive behavior was observed.
Taken together, prior studies indicate positive teacher outcomes SWPBS, although to date, no valid conclusions regarding intervention effects can be drawn. The obvious gap in knowledge regarding teacher outcomes in general and the effects on collective efficacy and behavior management in particular as well as the lack of larger scale studies with rigorous evaluation designs inspired a focus on the impacts of N-PALS on staff behavior and perceived efficacy in the present study.
SWPBS in Norway
The N-PALS is an culturally adapted version of the widely disseminated version of the U.S. SWPBS model developed by Sprague and Walker (2005) and implemented in close collaboration with the program developers at the University of Oregon (Sprague & Walker, 2005). The Norwegian adaptations were mostly surface changes while the following core components remain the same in the two countries: (a) an intervention program with pre-defined components targeting all students, (b) a training program for the staff, and (c) school-wide strategies for the implementation and sustainability of change. One remarkable difference is the Norwegian emphasis on developing a nationwide rather than a community or statewide standardized system of implementation and quality assurance. Although structured, SWPBS/N-PALS is a flexible system-level approach to the prevention of student problem behavior and to the promotion of a positive and inclusive school environment that can facilitate teaching, optimal learning, and psycho-social functioning for all students (e.g., Arnesen, Meek-Hansen, Ogden, & Sørlie, 2014). The focus is on positive, systematic, supportive, collective (school-wide), proactive, and inclusive practices. N-PALS builds on the principle of inclusion, systemic approaches, and competence building at the school level; positive behavior support for all students with interventions at three levels; and assessment, review, and follow-up activities on all three levels. Punishing approaches to problem behavior are replaced with proactive strategies which stress the importance of positive behavior support and consistency in the communication of norms and rules in school. Student problem behavior is prevented and reduced through teaching and learning positively formulated rules, consistent support for positive behavior, and predictable consequences for unwanted or negative behavior. A continuum of evidence-based interventions is targeted to the students’ risk level and the schools’ needs in a three-tiered model organized according to the principle of “response to intervention” (RtI). As a result, a safe and positive learning climate is established for all students at the universal level, while social or behavioral problems among individual students are targeted at the selected and indicated levels (Arnesen et al., 2014).
The universal level builds on the assumption that as many as 80% to 90% of the students are well behaved, but still they deserve praise and encouragement for complying with school expectations. Interventions at this level include (a) teaching school-wide rules and consistent praise and encouragement of positive student behavior; (b) applying predictable, but mild consequences for problem behavior; (c) training teachers in proactive classroom management and good directions; and (d) school-wide monitoring of student behavior using the School-Wide-Information system (SWIS). The 5% to 15% of the students who do not respond satisfactorily to the universal interventions is targeted at the selected level. This group of students may receive time-limited small group training in academic or social skills or they are offered the Check-In/Check-Out (CICO) program (Todd, Campbell, Meyer, & Horner, 2008), which efficiently addresses the students’ needs for intensive and targeted support. Individually tailored interventions are organized at the indicated level for students at high risk of conduct disorder and school failure (1%-5%). Interventions at this level may include (a) individual and multisystemic support plans based on functional behavioral assessment (FBA), (b) individual social skills training (e.g., “Stop-Now-and-Plan”; Augimeri, Farrington, Koegl, & Day, 2007), (c) parent training, and (d) behavior management training for teachers.
Implementation Structure
In Norway, the NCCBD has the sole national responsibility for the implementation and sustainability of N-PALS, including quality assurance procedures. The three-tiered model, the training of coaches and the internal school implementation teams, web-based information systems for regular measurement of implementation quality, and student behavior, are nationally standardized. The implementation process at each school takes about 3 to 5 years, and starts with a formal assessment of the schools’ readiness for implementation, and approval from a majority of the staff (min. 80%) is required, along with active engagement from the school leadership and parental support. The school is also required to define at least one goal of improvement, commit to prioritize the program for 3 to 5 years, and contribute with monitoring and evaluation of the implementation and outcomes.
At each school a team is established with five to seven participants representing school management, teachers, other staff, school psychological services, and parents. A student representative may also be appointed. The school teams are trained and supervised by local coaches (40 hr over 2 years) who are trained for 1 year and certified by the program implementers at the NCCBD. In addition, regional network meetings and booster sessions are provided quarterly. The school team leads and coordinates the activities at the school, including the implementation and evaluation of the school’s action plan which is based on a school-wide assessment of strengths and challenges. The teams also are responsible for continuous data-driven analyses for interventions and sustained implementation fidelity. They keep close contact with the school staff and organize problem-solving discussions and training in key elements of the model and implementation structure.
Research Questions
The research questions were as follows: (a) Do staff in schools that implement the N-PALS model over a 3-year period demonstrate higher perceived efficacy (self-efficacy and collective efficacy) across time than staff in control schools doing “practice-as-usual”? (b) Do the staff in N-PALS and control schools differ in behavior management (i.e., use of positive behavior support and behavioral correction) as observed by students and staff? and (c) Are intervention outcomes moderated by implementation quality?
Method
The effectiveness study was based on a quasi-experimental matched comparison group design (for a detailed description, see Sørlie & Ogden, 2014). The presented results are based on data collected from all staff members (principals, teachers, assistants, special education teachers, after-school personnel) and students in fourth to seventh grades in 28 N-PALS schools and 20 comparison schools doing “regular practice.” The staff and students completed questionnaires at four time points (T1-T4) over a 4-year period. The study had an open cohort design, allowing new staff and students to be enrolled at each measure point. Participants who left the schools were not followed due to a lack of resources. Pre-test (T1) was at the end of the school year prior to N-PALS. T2 was at the beginning of a new school year and close to the initiation of the intervention (6 months past T1). The students participated from T2 forward. T3 and T4 (post-test) were conducted after, respectively, 1 and 3 years of implementation.
Participants
The intervention and control groups were compared at baseline on several school, student, and staff variables such as school size, the proportion of students with immigrant backgrounds, proportion of students in special education, academic test scores, staff gender, and educational background. Significant differences were identified in one of the 29 variables tested (examples below). The baseline analyses indicated that the two school groups were comparable, which is a prerequisite for valid estimates of intervention effects. Possible group differences on unobserved variables can, however, not be ruled out. In the 48 participating schools (Grades 1-7), the student body numbered 13,570 at baseline (N-PALS = 7,964, control = 5,606), of whom 51% were boys and approximately 6% had ethnic minority backgrounds. No initial differences appeared between the intervention and comparison group with the exception of reading performance (test scores in fifth grade). Somewhat lower test scores were observed in the N-PALS group than in the comparison group, F(1, 47) = 4.81, p = .03. The participating schools matched the national average both on school size, standardized test performance scores, and student ratings of the learning environment (Statistics Norway, 2009). At T1, the total staff numbered 1,064 in the intervention schools and 750 in the comparison school. However, only staff members in daily contact with groups of students were invited as respondents (N = 1,266). Sixty-four percent of the school staff was teachers, 16.5% were assistants, and 22% were after-school personnel. Most were trained as teachers (56%), 12% had additional special education training, while 4% had no kind of formal training. About 80% were females and older than 35 years. No initial group differences in staff characteristics were identified.
Procedures
To match the comparison group with the intervention group on key characteristics, all primary schools in 17 municipalities (in southern and western Norway) were matched on schools size (>100 students) and geographical location prior to invitation. Schools actively implementing structured programs other than N-PALS were excluded. Of the 126 schools considered eligible for the study, 52 were randomly selected and invited as intervention schools. Of these, 28 (54%) agreed to participate. Next, another group of schools (n = 44) were randomly selected and invited to participate in a longitudinal study of student behavior and informed that they would serve as comparison schools. Only schools located more than five kilometers away from an intervention school were invited, this to minimize program contamination. Of these, 20 schools agreed to participate (45.5%). No significant differences were found between the participating schools and the declining schools. Questionnaires were completed during ordinary working time or class time. Written instructions were given to standardize the assessment procedures. Informed and written consent from parents was obtained in advance, while agreement from staff was obtained coincident with completing the questionnaire.
Measures
Collective and self-efficacy in school
Perceived collective efficacy in school was measured with a frequently used 12-item scale developed by Goddard (2002), a revised version of the well-validated Collective Efficacy Scale (CES; Goddard, Hoy, & Woolfolk Hoy, 2000). CES assess the extent to which teachers in a school believe in their mutual capability to positively influence the students’ learning and school outcomes. Items were rated by staff on a 5-point scale (1 = never, 5 = very often) and included items such as “teachers here are confident they will be able to motivate their students” and “teachers in this school are able to get through to difficult students.” The internal consistency in the current study was acceptable with Cronbach’s alpha (α) ranging from .82 to .85 across assessment points. Perceived
Behavior management
Strategies to promote positive student behavior and to manage student problem behavior were assessed by both students and staff. A 17-item staff scale and an equivalent 23-item student scale were developed for this study. Factor analyses revealed a two-factor structure: “positive behavior support” (staff: nine items, α from .74 to .76; students: 16 items, α from .88 to .92) and “behavioral correction” (staff: eight items, α from .57 to .66; students: five items, α from .58 to .61). The staff reported the number of times in the last month they had used strategies such as “praised and encouraged expected positive student behavior,” “deliberately ignored undesirable behavior.” The students reported how often in the last month they had experienced teacher practices such as “the teacher praises me when I do as she/he says during lessons,” and “the teacher says what will happen if we violate the rules.” A 7-point scoring scale was used in the staff version, ranging from 0 (0 times) to 7 (more than 20 times) whereas the student version used a 4-point scale, ranging from 1 (never) to 4 (usually). We hypothesized that to reduce the amount of student problem behavior, the ratio between positive supports and behavioral corrections is essential. A rule of thumb in SWPBS/N-PALS is that teachers should encourage and reward the students’ positive behavior three to five times for every behavioral correction.
Implementation quality
To assess the implementation fidelity, the “PBIS Self-Assessment Survey” (SAS, 46 items) was completed by school staff in the intervention schools (Sugai, Horner, & Todd, 2009). SAS has shown satisfactory psychometric qualities in several prior evaluation studies and measures fidelity at respectively the school-wide, classroom, non-classroom, and student level. In the present study, the staff members rated how statements corresponded with the actual situation at their school, using a 3-point scale (1 = in place, 2 = partially in place, 3 = not in place). Examples of statements are “a few (3-5) school rules are positively and clearly defined” (school-wide), “problem behavior is consistently addressed with mild and predictable negative consequences (1:5)” (classroom), “the staff members who have inspection actively supervise the students in all arenas outside the classroom context” (common areas), and “a behavioral support team is immediately established (within 2 days) for students showing severe behavior problems” (individual). The alphas for the sumscale and subscales ranged from .90 to .92 across assessment points.
Because contextual factors may influence both intervention outcomes and implementation quality, several school factors were included as covariates in the analyses of N-PALS effects: school size, proportion of students with immigrant backgrounds, proportion of special education students, proportion of staff without any formal training, and proportion of staff working in after-school services.
Analytic Approach
Multilevel analyses with three levels were conducted to compare change across time in the control and intervention group. The longitudinal data structure, with repeated measurements as Level 1 (T1, T2, T3, T4) nested within staff or students at Level 2 and schools at Level 3, suggested a multilevel approach. The Mixed Linear procedure in IBM SPSS statistics (version 20) was used to account for the hierarchical structures in the data. In the main effect analyses, the control group was used as reference group, baseline was used as the reference time point, and T2 to T4 were included in the analyses. In addition, contextual school variables that could potentially influence the effects were statistically controlled for. All covariates were centered to minimize collinearity, and non-normally distributed variables were log-transformed. Because of the differences in time between measurements, an unstructured residual covariance structure was chosen for residuals at Level 1. At the school level, random intercepts were estimated using a scaled identity covariance structure. Main effects were investigated by including a Time × Group interaction term in the models. Moderating effects of implementation quality in the N-PALS schools were examined in a second series of models. These models included the same variables as the main effect models, but were extended by including a two-way interaction term, Time × Implementation Quality. All relevant lower-order terms were included to ensure balanced regressions equations. Separate analyses were run for the teacher and student rated outcome variables. Missing data were estimated using the direct-likelihood method, assuming a missing-at-random mechanism. We calculated Cohen’s d based on Feingold’s (2013) recommendations for designs with two independent groups and linear models with three or more time points. Confidence intervals were calculated based on the procedure suggested by Grissom and Kim (2005). Unconditional variable descriptives are shown in Table 1.
Unconditional Means and Standard Deviations by Group and Time.
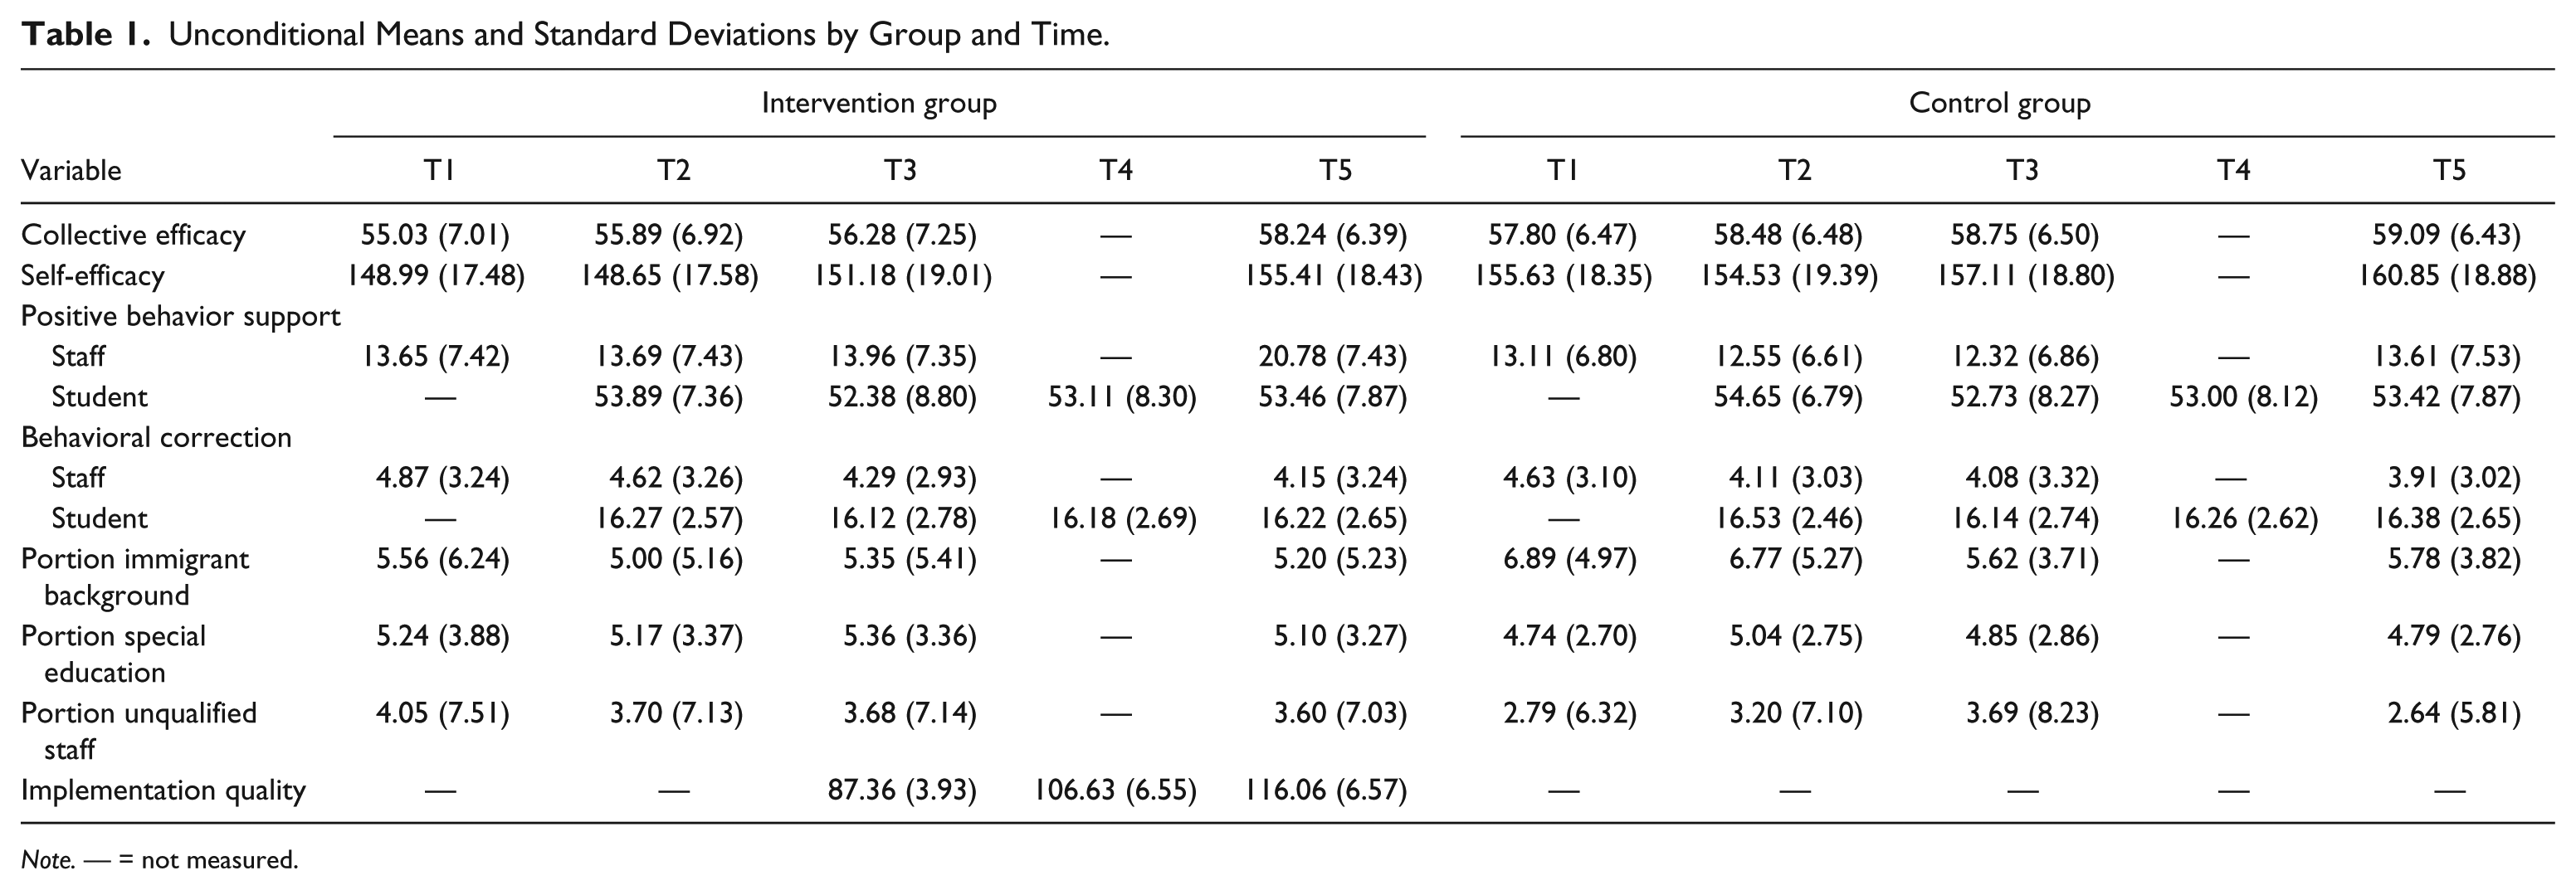
Note. — = not measured.
Results
Attrition
At the first assessment, 75% of the staff members participated; 76% participated at T2; 73% participated at T3; and 67% participated at post-test. Of the students, 94% with parental consent participated at T2 and T3, and 91.9% participated at T4. Throughout the study period, a total of 11,784 students in fourth to seventh grade were asked to participate. Of these, 8,474 students got parental consent (72%). Variations in participation among staff were primarily due to turnover (n = 560) and leaves of absence during the data collection periods (n = 423). The open cohort design allowing inclusion of new fourth graders and other students new to the schools at each time point, and older students leaving the study by the end of seventh grade accounted for most of the missing data and varying student participation rates. In addition, some missing data were related to students changing schools (n = 360), parents withdrawing their consent (n = 44), or absence on the assessment day. Furthermore, one of the control school withdrew from the study prior to T2 (nstaff = 59) and one before T3 (nstaff = 30, nstudents = 221), stating work overload as the main reason. Missing on the outcome variables by time point is shown in Table 2 (varied from 0.8% to 3.6%). School-level variables did not have missing.
Missing Data by Variable and Time Point (Percentage).

Baseline comparisons of staff present and missing at post-test showed that those not present were more likely to have a university degree, F(1, 1209) = 10.591, p < .001, and to be working in higher rather than lower grades, F(1, 1209) = 8.565, p < .01. Comparisons between students participating and those missing at post-test showed that the missing group rated their learning climate slightly more positive at baseline, F(1, 2427) = 14.76, p < .001. No school group or gender differences were found in the staff and student analyses. In conclusion, the attrition was rather high, but not higher than could be expected from the open cohort design and normal fluctuations in the staff and student populations across time. Together with few significant differences between those who participated at pre- and post-assessment and those who did not, the results suggest that a missing-at-random mechanism may be assumed, and that estimation of missing data by the direct-likelihood method is acceptable.
Main Intervention Effects
Indications of positive 3-year main effects of the N-PALS model were found for collective efficacy, self-efficacy, and positive behavior support practices as rated by the school staffs (see Table 3, Figure 1). To simplify the often rather difficult-to-read results of multilevel analysis, the estimates of fixed effects in Table 3 are shown as group differences in change across measure points. The table also includes effect sizes (Cohen’s d) with 95% confidence intervals. The intervention effects ranged from small to large with Cohen’s d between .14 and .91.
Main Effects of N-PALS: Differences in Change Across Time Within and Between the Intervention and Control Group—Fixed Effects Estimates and Effect Sizes (Cohen’s d) With Lower and Upper Confidence Intervals.

Note. Estimates (enhanced values) are based on Satterthwaite’s (1947) approximate degrees of freedom. All covariates (total number of students, portion of students with foreign background, portion of special education students, and portion on staff without formal education, portion of staff working in after-school services) and the Time × Group interaction are accounted for in the estimates of change. Model estimates for all variables in the outcome analyses are available on request to corresponding author. N-PALS = Norwegian version of SWPBS; pre-Y1 = change from first measure point for the staff (T1) and students (T2) to the end of year one with N-PALS; pre–post = change from first measure point for staff (T1) and students (T2) to the end of year three with N-PALS; CI = confidence interval; SWPBS = School-Wide Positive Behavior Support.
Staff ratings on first line, student ratings on second line.

Main intervention effects: Changes across time in the N-PALS and control group.
Perceived teacher efficacy
As shown in Table 3, there was positive growth across time in the school staffs’ collective efficacy scores in both school groups. The multilevel analysis showed that the development in the N-PALS group did not differ significantly from the development in the control group, neither prior to intervention (pre-T2 diff = .11, p = .756, not in table) nor after 1 year of implementation (pre-Y1 diff = .57, p = 756). However, after 3 years of implementation, significantly higher perceived collective efficacy over time was observed in the intervention group as compared with the control (pre–post diff = 2.28, p = .000). Similar progress was observed for self-efficacy, indicating a significant main effect of N-PALS (pre–post diff = 2. 53, p = .014).
Behavior management
A main intervention effect was also observed in disciplinary practices: The staff in the N-PALS schools increased the amount of proactive and supportive practices considerably more from pre- to post-assessment than did their colleagues in the comparison schools (pre–post diff = 6.56, p = .000). Although there was a general decrease in the use of behavioral corrections across time according to the staff ratings, no significant group differences were observed. The student ratings of the teachers’ behavior management practices indicated no significant group differences in change across time. Additional analyses revealed no impacts either by gender or class level on the students’ ratings. However, according to the staff ratings and in line with the recommended “rule of thumb” (3-5:1, Arnesen et al., 2014), the ratio between positive supports and corrections in the N-PALS group increased from 2.5 at pre-test to 4.5 at post-test (control: 2.5 - 3.1), while remaining stable at 1.03 in both groups according to the students.
Implementation Quality
Twenty-six of the 28 intervention schools reached a total implementation score in the range of 75% to 90% after 3 years, while two schools reached respectively 72% and 73%. Differential effects of N-PALS were explored by the running of moderation analyses of fidelity while other possibly influencing factors were accounted for (school, staff, and student characteristics). No significant moderation effect was identified in any of the outcome variables, which may be a consequence of scant variation in implementation scores among the intervention schools.
Discussion
In the present article, we examined the impacts of N-PALS on school staffs’ practices and on their individual and collective efficacy in a strengthened, non-randomized experiment with 28 intervention schools and 20 “regular practice” schools serving as controls. We also examined whether the quality of the implementation moderated the outcomes.
Results after 3 years of implementation indicated that this school-wide model had significant positive effects according to school staff. Consistent with prior studies on the SWPBS model in the United States and Canada, a significant main effect was observed in the N-PALS staffs’ perceived self-efficacy compared with their colleagues in the control group. This finding suggests that individual staff members felt more empowered, more motivated, and more capable of teaching and handling challenging students following the implementation of N-PALS.
The study results also indicated a positive main effect on school staffs’ collective efficacy beliefs compared with pre–post changes in the control group. The finding is of interest because prior research has found that collective efficacy is a stable school-level characteristic that varies between schools (Sørlie & Torsheim, 2011) and is significantly related both to the students’ academic performance and to the amount of problem behavior in schools (Sørlie & Torsheim, 2011).
Moreover, the results indicated a considerable main effect of N-PALS on staffs’ behavior management practices as rated by the staff members themselves. The use of positive behavior-supporting strategies such as verbal praise for prosocial behavior increased from pre- to post-test in both groups, but substantially more so in the intervention schools than in the control schools (d = .91). The ratings of behavioral corrections such as verbal reprimands and mild sanctions for unacceptable school behavior showed a decreasing trend in both conditions; however, no group differences in change emerged. However, the ratio of supporting to corrective reactions increased more from pre- to post-test in the N-PALS schools than in the comparison schools. In other words, the staffs in the interventions schools simultaneously increased their positive feedback and decreased their negative feedback to students.
These findings are important given that research indicates that school staffs with poor behavior management skills contribute to placing students at risk for higher levels of problem behavior, poor academic outcomes over a long period of time, and exclusion from ordinary education (e.g., Reinke & Herman, 2002). Poor behavior management skills are also related to negative student–teacher relationships, off-task behavior, and poor learning environments because of frequent classroom disruptions (e.g., Korpershoek, Harms, de Boer, van Kuijk, & Doolaard, 2014). Authoritative classroom management and efficacious prevention and management of problem behavior require that teachers increase their positive behavior support at the same time as they reduce the amount of harsh discipline they impose (e.g., Reinke, Lewis-Palmer, & Merrell, 2008).
Greater positive changes across time in individual and collective efficacy staff-reported behavior management in the N-PALS schools may stem from a combination of (a) the staffs’ observations of reduced student behavior problems during implementation of the model (Sørlie & Ogden, 2015) in accordance with the reciprocal relationship between the phenomena; (b) the model’s strong focus on a collective (school-wide) approach and mutual efforts to develop a more positive, supportive, and inclusive school environment; and (c) more systematic and evidence-based practices. It is also reasonable to assume that the reported changes may partially stem from the in-school training in behavior management.
Contrary to what was expected, no significant effects of the intervention were observed in the students’ (Grades 4 to 7) assessments of the teachers’ disciplinary practices. Although teachers are seen as highly reliable raters of their own practices (Desimone, Smith, & Frisvold, 2010), we cannot rule out that the discrepancy between staff and student ratings may partially be due to positive bias in the staff ratings. The discrepancy may also reflect that the changes in the teachers’ practices were too slight to be noticed by the students due to too low classroom-level fidelity of implementation. Or perhaps the students were not sufficiently sensitive to changes in the amount of behavioral feedback they received. We speculate that the students primarily perceived that they were receiving some response from teachers, and how the attention made them feel. Accordingly, the validity of student ratings (9-12 years) may be questioned with regard to the number of positive and negative behavioral responses they received over a 30-days period, particularly when rated retrospectively, as in the current study (i.e., “last month”). Besides, delayed effects may be part of the explanation. Delayed effects relate to that it may take time to induce changes in teachers’ behavior and that intervention effects thus occur after an extended period of time (i.e., the study time frame may have been insufficient). Moreover, modest between-rater agreement is a familiar phenomenon, and similar informant discrepancies have been reported in prior intervention trials (De Los Reyes, 2011).
Although schools implementing other school-wide programs were not invited to the study (exclusion criteria), it should be noted that all but three of the control schools reported that they had been implementing at least one evidence-based program during the study period (e.g., bullying prevention, social skills promotion). Thus, N-PALS was evaluated using a harder test than initially intended, and the outcomes may be considered conservative estimates of intervention effects.
Differential Effects
Among the moderators examined in this kind of studies, high implementation quality is often found to predict positive outcomes across settings and programs (e.g., Ross et al., 2012), while small or no effects often relate to low fidelity scores. In this study, however, implementation quality did not moderate any of the outcomes. Limited variations in the implementation quality among N-PALS schools were found, evidenced by the finding that at post-test 80% of the schools had reached the recommended SAS threshold score. This could be taken to mean that the intervention model was consistently implemented across schools and that the intervention schools benefitted approximately equally from the model.
Limitations
Among the limitations of the study, the first concerns selection bias in the process of recruiting schools to the study. Even if the intervention and comparison group where matched on key variables, undetected group differences in non-observed variables may occur. It should also be mentioned that not all of the invited intervention and control schools accepted the invitation. But we assume that any selection bias caused by refusals would be equally large in both groups, and in support of this assumption, no differences were found among the declining and accepting school groups.
A second limitation could be caused by the fact that the staff members in the N-PALS schools were the primary implementers of the intervention model, and consequently a positive response bias may have occurred in their assessments of the outcomes. Although we cannot rule out this allegiance effect, a recent meta-analysis revealed that teachers’ self-reports on teaching are highly reliable, showing strong correlations with both classroom observations and teachers’ records (Desimone et al., 2010). We also find the staff assessments highly relevant in this context, because they are the primary stakeholders in efforts to increase teacher competence and positive student behavior. A third limitation is the low correlations between the staff- and student-based assessments. Such discrepancies between different informants are common, and the causes of these discrepancies remain unclear. There is a concern in the present study that some of the assessment instruments may have been insufficiently matched to the developmental level of the students, and that direct observations in the classrooms or student interviews could have added to the validity of the study.
A possible fourth limitation relates to SAS as the sole implementation measure.
Although several studies have used SAS as an implementation measure, it was originally developed for needs assessment, not specifically as a fidelity measure. Additional, however, more resource-demanding measures developed for measuring fidelity in SWPBS schools could have been used, but in the present study this was considered too expensive and time-consuming.
Implications for Future Research
Future replications of this study should preferably apply a randomized controlled design and add observational data of teacher practice to strengthen the conclusions regarding the N-PALS’ impacts for school staffs. Future efforts should also include analyses of relevant moderators other than implementation quality (e.g., school size) and attempt to reveal model components and implementation items that may improve the effectiveness of N-PALS. Investigating potential long-term effects of the model is also called for, and will be the topic of a new study beginning in 2015 using national school registry data.
Conclusions
The SWPBS model as implemented in Norway appeared effective in promoting school staffs’ perceived individual and collective efficacy. The model also appeared effective in changing staffs’ behavior in directions that are more positive and demonstrably more efficient to prevent and address student problem behavior, at least in staffs’ own eyes. The staff members in the N-PALS schools substantially increased their use of positive behavior supports whereas a co-occurring decrease (even non-significant) in behavioral corrections was observed. However, the effects observed in the staff ratings did not seem to translate to the students’ ratings, which need further research. The Norwegian outcomes indicate that the SWPBS model may be successfully transferred across the Atlantic without major adaptations, at least to Norway as a representative of the Scandinavian and western European countries.
Footnotes
Acknowledgements
We acknowledge Professor Torbjørn Torsheim for his invaluable support with the analyses. We are also grateful for the intervention adapters’, Anne Arnesen and Wilhelm Meek-Hansen, genuine interest in the study. None of them has been involved in the research.
Authors’ Note
The standards of the Regional Committee for Medical and Health Research Ethics (REK South-East) and of the Norwegian Social Science Data Services were followed throughout the conduct of the study.
Declaration of Conflicting Interests
The author(s) declared no potential conflicts of interest with respect to the research, authorship, and/or publication of this article.
Funding
The author(s) disclosed receipt of the following financial support for the research and/or authorship of this article: This research was supported by the Norwegian Center for Child Behavioral Research and in part by a grant from the Norwegian Directorate for Education and Training.
Author Biographies
![]()