
Abstract
The study attempts to approach aging in India from three perspectives, namely, the well-being of an aging individual, the aging household, and the aging population. The aspects, namely, work, financial dependence, integration, empowerment, and elder abuse are studied and their relation to age, gender, and marital status is investigated. The data sets pertaining to the National Sample Surveys for the reference periods 1986-1987, 1995-1996, and 2004 are primarily utilized for the purpose. The data sets from Building Knowledge Base on Population Ageing in India Survey, 2011, are also utilized for information on elder abuse. The results show that the older males are more likely to participate in household activities when compared with the older females. The married older adults are also more likely to participate in household activities when compared with their widowed counterparts. In a similar way, gender and marital status are found to be associated with empowerment of older adults. The working older adults, those who possess property and/or assets are more likely to be financially independent. Furthermore, the older females and the financially dependent older adults are more likely to face abuses of different kinds. Households are classified into three different types. Type I households have no older adults, Type II households have older adults and other younger members, and Type III households have older adults only. Results show that Type III households are found to be relatively more deprived and report higher average monthly expenditure when compared with other types of households.
Keywords
Introduction
Aging of population in India is apparent from the trend depicted over different censuses since 1951. The recent census puts up the count of older adults 1 to 103,849,040 (Census of India, 2011). This figure amounts to 8.6% of the population of India in 2011. Aging may be viewed from two different perspectives, namely, the macro perspective and the micro perspective. From the macro perspective, it depicts a distinct population process. As a characteristic of this process, the center of the age distribution drifts over the time toward the higher ages. From a micro perspective, the point of concern is the older adults and their well-being. Human beings, during their life course, move into the older adulthood after transiting through the childhood, the youth, and the adulthood. It is quiet plausible that entry into the older adulthood is accompanied by simultaneous changes in their economic, social, and health statuses.
While moving into the realm of older adulthood, most of the people find themselves either retired from active economic life or at the verge of retirement. Economically productive life span of an individual may terminate with her or his retirement. Besides, working at older ages may not be at par with working at younger ages in the remunerative sense. The numbers of working hours also get reduced with increasing age (Singh, Singh, & Sharma, 1987).
The age of retirement in India, in the formal sector, varies from 55 to 65 years (Rajan, 2010). However, no such retirement age exists for people working in informal sectors. India, like other developing countries, has a large agricultural sector. This sector can absorb and sustain human resources at older ages. The reason being that unlike the manufacturing and the service sectors, it does not require skilled workforce. This sector, therefore, employs a large proportion of economically active older adults. This situation is akin to what is observed in developing countries in general (Chen, Jones, & Domingo, 1989; Choe, 1989; Nasir & Ali, 2000; Perera, 1989). The estimates of the percentage of workers in informal sectors were 92.2, 92.8, 93.0, and 93.4 during 1987-1988, 1994-1995, 1999-2000, and 2004-2005, respectively (Rajan, 2010). This indicates that a large part of the workforce remains devoid of any post-retirement benefits. Consequently, these workers turn up being financially dependent at older ages.
Working older adults either work willingly or they are forced to work for monetary benefits (Dinesh & Rayappa, 1983). The reasons for working during older ages may be that the economically active older adults are more favorably treated by their family members (Yadava, Yadava, & Sharma, 1996). Besides, low income households may not be able to cope with the financial dependency of the older adults (Alam, 2006).
It is presumed that the family was responsible to take care of the material and non-material needs of the dependent older adults. This presumption seems logical as we do not find existence of any other means of support to the dependent older adults, in the past. However, in general, the material and the non-material support in a family may flow from rest of the family to the older adults or there may be a flow of support from the older adults to the family. Thus, the provider of support can be conceived as a source of support and the receiver as a recipient of the support. These kinds of flow of support are called intergenerational transfers (IGTs). The direction of IGT can be upward (from children to parents), downward (from parents to children), or lateral (from sibling to sibling) and these transfers vary in type as time (including help, services, and visits), money, and goods (including shared space and goods through co-residence; Gauthier, Chu, & Tuljapurkar, 2007). The state of IGT in the Indian scenario, however, requires empirical exposition.
Apart from the changes in the work status, the social role of an older adult may change. This change occurs because the younger generation steps into the roles that were once performed by the older adults. These changes are detrimental to the autonomy of the older adults. In such situations, question naturally arises regarding the capability of the older adults to make choices regarding the issues that matter in their lives. This vulnerability cannot be overcome unless the older adults are powerful enough to have and make choices regarding such issues. Therefore, the salience of power, and hence empowerment, is evident at the older ages. In other words, an older adult either exercises choices or is powerless. To ensure well-being, the powerless need to be empowered.
Kar, Catherine, and Kirstin (1999) have identified four domains or aspects of life that affect the overall quality of life of the powerless. These are basic human rights, equal rights for women, economic enhancement, and health promotion and disease prevention. Citing from earlier works (Freire, 1973; Rappaport, 1987; Wallerstein & Bernstein, 1994; Zimmerman, 1995; Zimmerman, Israel, Schulz, & Checkoway, 1992), the authors have defined empowerment as a process through which individuals, communities, and organizations gain control over issues and problems that concern them the most. According to Kabeer (1999), the process of empowerment is about making choices. The concept incorporates three interrelated dimensions namely, agency, 2 resources, 3 and achievements 4 that lead to manifestation of power 5 in the presence of choices. 6 Therefore, in the context of older adults, autonomy in decision making reflects the power. Another important aspect from the perspective of well-being of older adults is the integration of older adults with the household. It shows the acceptability of the older adults in the household and vice versa in a co-residence type of living arrangement. Co-residence is the most frequent living arrangement among the older adults in India (National Sample Survey Organization, 1989, 1998). Therefore, an investigation into integration and its associated aspects may provide useful insights into this aspect of well-being of older adults. The issues concerning empowerment and integration among the older adults in India are yet to be addressed.
During older ages, the risk of a change in the marital status, from married to widowed, is very high. Furthermore, physical mobility is at stake and vulnerabilities to chronic health conditions are also very common. It is apprehended that, on account of financial, social, economic, and health vulnerabilities, the older adults may be susceptible to abuses of various types.
The preceding sections discuss various aspects of well-being of the older adults. These aspects may exhibit gender differentials especially in those social setups where the gender inequality is known to prevail at comparatively younger ages. The reasons being that the older women in traditional societies were never a part of the workforce and, therefore, their continuous financial dependence during the life course may be detrimental to their well-being at older ages. Moreover, their social status has association with their marital status and having a son (Vlassoff, 1990). Although, gender issues pertaining to the non-older adults are well addressed in recent literature (Bhattacharya, 2006; Devi, 1993; Gulati, 1993; Koenig & Gillian, 1992; Selveratnam, 1988), quantitative studies pertaining to the older adults are rare.
As distinguished from the macro (population based) and micro (individual based) perspectives of aging, the third perspective concerns the changing composition of the households. This is a semi-macro perspective that considers aging from the level of households. Households are residential units. Within households, the family members live in physical proximity. A household may not have residing older adults (say, Type I) or it may have residing older adults. For the households with residing older adults there may be co-resident younger people (say, Type II) or there may not be co-resident younger people (say, Type III). The Type II and the Type III kinds of households are, respectively, called the co-residence and the alone types of living arrangements (Palloni, 2001).
The co-residence is viewed as one type of the various types of IGTs (Velkoff, 2000). Aging may alter the distribution of the household types. It is expected that in an aging society, the proportion of Type II and Type III combined may increase over time and the proportion of Type I may decrease over time. Furthermore, among Type II and Type III households, the proportion of Type III may increase over time and Type II may decrease over time. It is also possible that the proportion of older adults in Type II households may increase over time. In these ways the aging of households takes place.
From the preceding discussion, it is apparent that work, financial independence, capacity to make choices, integration with the household, and health are some of the factors that are instrumental to the well-being of the older adults. In addition, the gender and the marital status may be responsible for the differentials in the well-being. The motivation for the present work has been on two accounts. First, the exiting literature on older adults in India lacks an integrated approach to address different but important aspects of well-being. Second, studies based on countrywide and time-varying representative samples are few. The present study is an attempt to fill this gap. The specific issues to be investigated are given as follows:
to provide a descriptive account of aging in India from macro, semi-macro, and micro perspectives;
to assess the working and financial dependence of the older adults and the support from and to the older adults;
to assess the state of power, the state of integration, and the correlates of elder abuse among the older adults; and
to provide a situational analysis of the Type I, Type II, and Type III households.
Data and Method
The trends in the proportion of older adults and the old age dependency ratio (OADR) are utilized for describing the macro aspects of aging. Let F denote the distribution function of age in a given population, at a given time.
OADR, as a measure of dependency, assumes that all older adults shall be dependent on adults (people aged 15-59). However, the fact remains that people work even at older ages. Older adults are working or non-working. Therefore, the work activity and its variation with age of the older adults need to be investigated. Older adults may be financially independent, partially dependent, or completely dependent. More so, association may exist between the financial dependence and employment. Considering working and dependence as ordinal variables, gamma (Agresti, 1990) has been utilized to investigate the association between the two. Furthermore, the variation of financial dependence with age is investigated.
Apart from an earning through an employment, assets, and property are resources that may contribute to the financial independence of the older adults. These resources may have been acquired by an older adult during her or his lifetime prior to the older adulthood. The quantum of assets and property owned by an older adult may affect her or his financial dependence at older ages. A multinomial logit regression model is utilized for investigating the association of financial dependence with owing assets and owing property. The model is given as
As discussed in the preceding sections, employment, property, and assets are means and resources available with the older adults to overcome their financial dependence. However, possessing of assets and/or property may not be conducive to financial independence of the older adult unless the older adults have the capacity to manage their owned asset 7 and/or property. Furthermore, this capacity may be conditioned by the age, gender, and the marital status of an older adult. The age–power relationship is investigated through age group–specific proportions of older males and older females who are managing their owned assets and owned properties. The gender differentials in power are depicted through the odds ratios for older males versus older females. Similarly, the association of marital status and power is depicted through the odds ratios for currently married versus widowed among older males and older females.
The participation of older adults in household matters indicates involvement and hence integration of the older adults with household. This can be assessed in case of co-residence type of living arrangements where the older adults reside with younger ones. The indicators of integration, as available in the 42nd and 52nd rounds of the National Sample Survey (NSS), are participation in the social 8 matters, the religious 9 matters, and the daily household chores (DHC). The associations of the indicators of integration with age, gender, and marital status have been investigated using measures similar to that described in the preceding section.
This study takes up the issue of elder abuse by utilizing the Building Knowledge Base on Population Ageing in India (BKPAI) survey, 2011. The BKPAI survey classifies elder abuse into physical abuse
10
(PA), verbal abuse
11
(VA), economic abuse
12
(EA), showing disrespect
13
(SD), and neglect
14
(NE). Logistic regression models given as
The following section addresses the semi-macro aspect of aging including the composition of households, the economic condition of different type of households, and measures of the aging for the Type II households.
In the preceding sections, a classification of households as Type I, Type II, and Type II was introduced. This classification is based on the composition of households vis-à-vis the older adults. The change in composition of household types is indicated by the change in proportion of their types. The following two measures are defined to quantify the aging of the Type II households:

The geometric mean is used as an average for these measures. It should be noted that the value of household old age dependency ratio
To assess the economic conditions prevailing in different types of households, the median of household monthly expenditure per person (MHME) and multidimensional poverty index (MPI) have been utilized. Specifically, the ratio of MHME for Type I/Type III with respect to MHME for Type II, for a given reference period, has been utilized. This is to control for the effect of the inflation over the time.
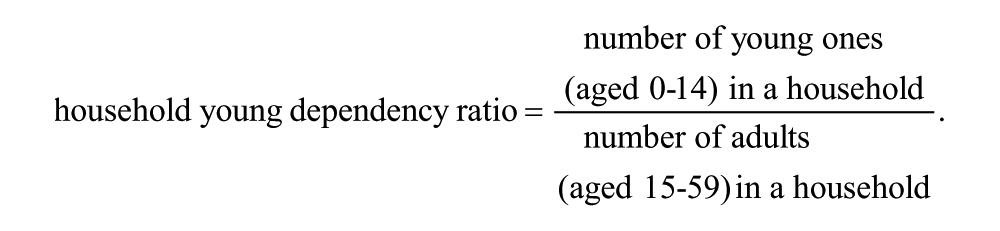
The MPI has been calculated based on the human development reports (United Nations Development Programme [UNDP],2011). However, the numbers of indicators that are incorporated to evaluate MPI vary for the reference periods. This is to incorporate maximum information available on the indicators of household prosperity during a given reference period. Thus, for calculating the MPI, two, four, and five indicators have been used for the reference periods 1986-1987, 1995-1996, and 2004, respectively (Table 1). For this purpose, a household is said to be deprived if it is lacking in any one of the selected indicators under consideration at a given time period. The study does not attempt to provide any estimates of the standard errors for the statistics MPI, household young dependency ratio (HYDR), HOADR, and MHME. It is assumed that the large sample sizes would produce estimates for these statistics that are accurate enough for a general discussion. Nevertheless, bootstrap estimates of standard errors may be suggested for such arduous statistics. The computations were carried out on R (R Core Team, 2014).
Selected Indicators For Constructing Multidimensional Poverty Index.

In addition to the data from census and BKPAI survey, the present study utilizes data from various rounds of the NSS. These surveys were conducted during the period July 1986 to June 1987 (the 42nd round), July 1995 to June 1996 (the 52nd round), and January to June 2004 (the 60th round). The 42nd, 52nd, and the 60th rounds surveyed 32,231, 16,357, and 13,344 households, respectively, with residing older adults. Although, the information content of each of the survey differs in some aspects from the other, similar definitions are used for all the three surveys.
Results
The number of older adults enumerated in the censuses of 1971 and 2011 were 32,699,731 and 103,849,040, respectively. Corresponding to these census years their proportions in the population were .06 and .09, respectively (Table 2). The number as well as the proportion of the older adults show a monotonically increasing trend over the census years. Furthermore, a rising OADR, that characterizes an aging population, is visible in the Indian population. Older females enjoy a greater average person years when compared with the older males during all the census years. It was in the recent censuses of 2001 and 2011 that the sex ratio was observed to be 1,029 and 1,023, respectively. Preceding the 2011 census, the sex ratio among older adults was in favor of the older males.
Indicators of Aging for the Indian Population for Census Years 1961-2011.
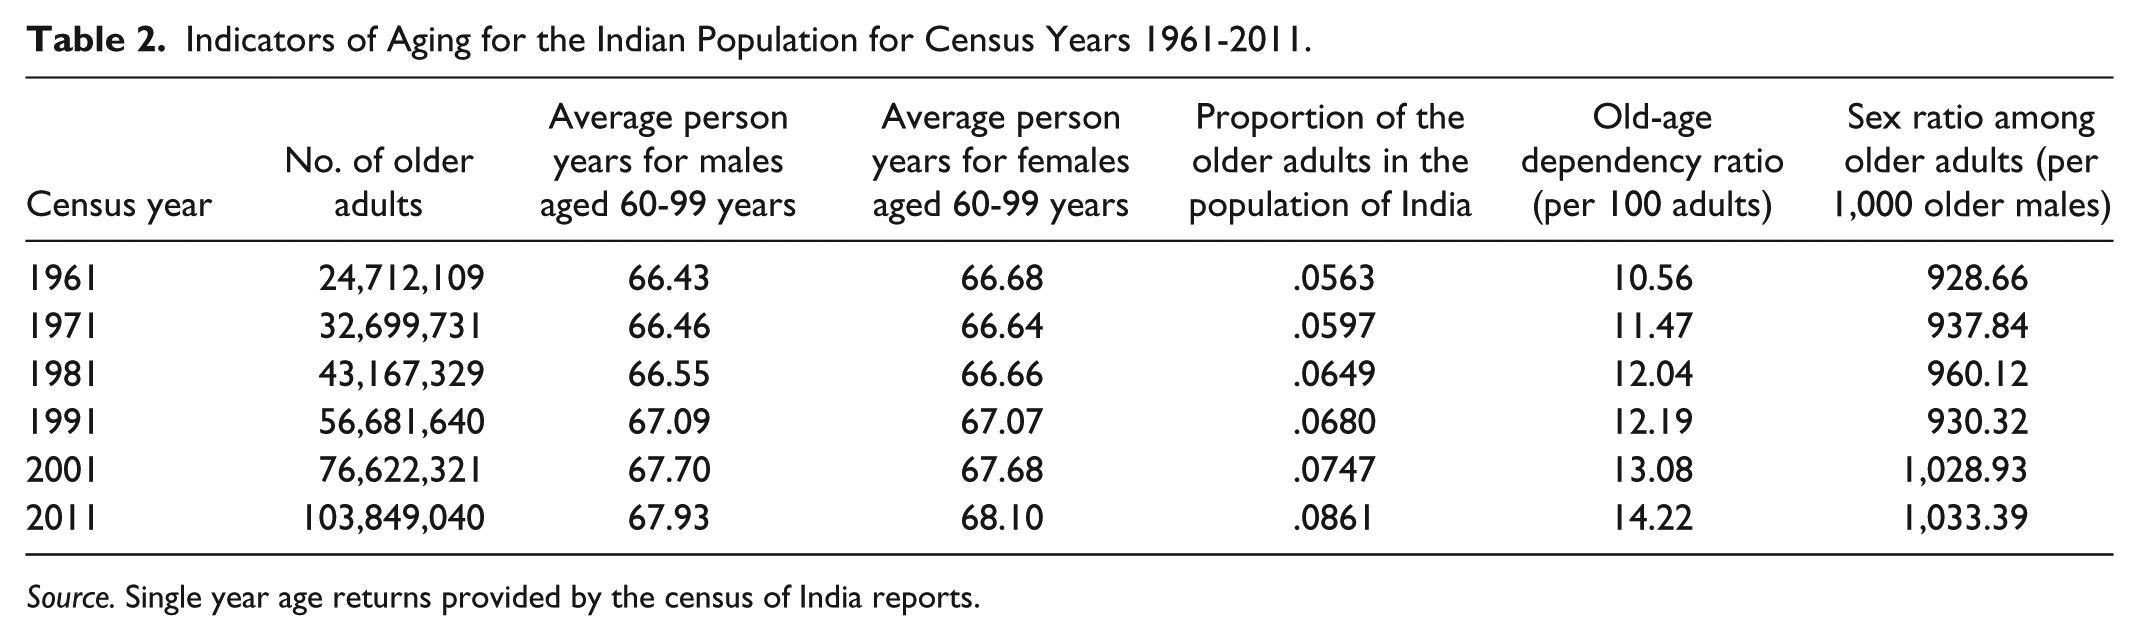
Source. Single year age returns provided by the census of India reports.
Empirical evidences from the three rounds of NSS indicate that a substantial percentage of older males are employed. The sample percentages of working older males are found to be in the range 57.40 to 60.85 in rural areas and in the range 32.92 to 41.98 in urban areas. However, older females are mostly engaged in attending domestic duties. The sample percentage of older females reporting attending domestic duties ranges from 41.06 to 43.68 in rural areas and 47.30 to 51.65 in urban areas (Tables 3, 4, and 5). However, the proportion of working older adults falls with increasing age (Figure 1). Nevertheless, being in workforce has a positive association with financial independence. This is due to a positive, high (>.81) and significant value of gamma for all the reference periods (Table 6). This may be the reason for the increasing number of financially dependent older adults at higher ages (Table 7).
Sample Percentage of Working Older Adults During 1986-1987 in India.
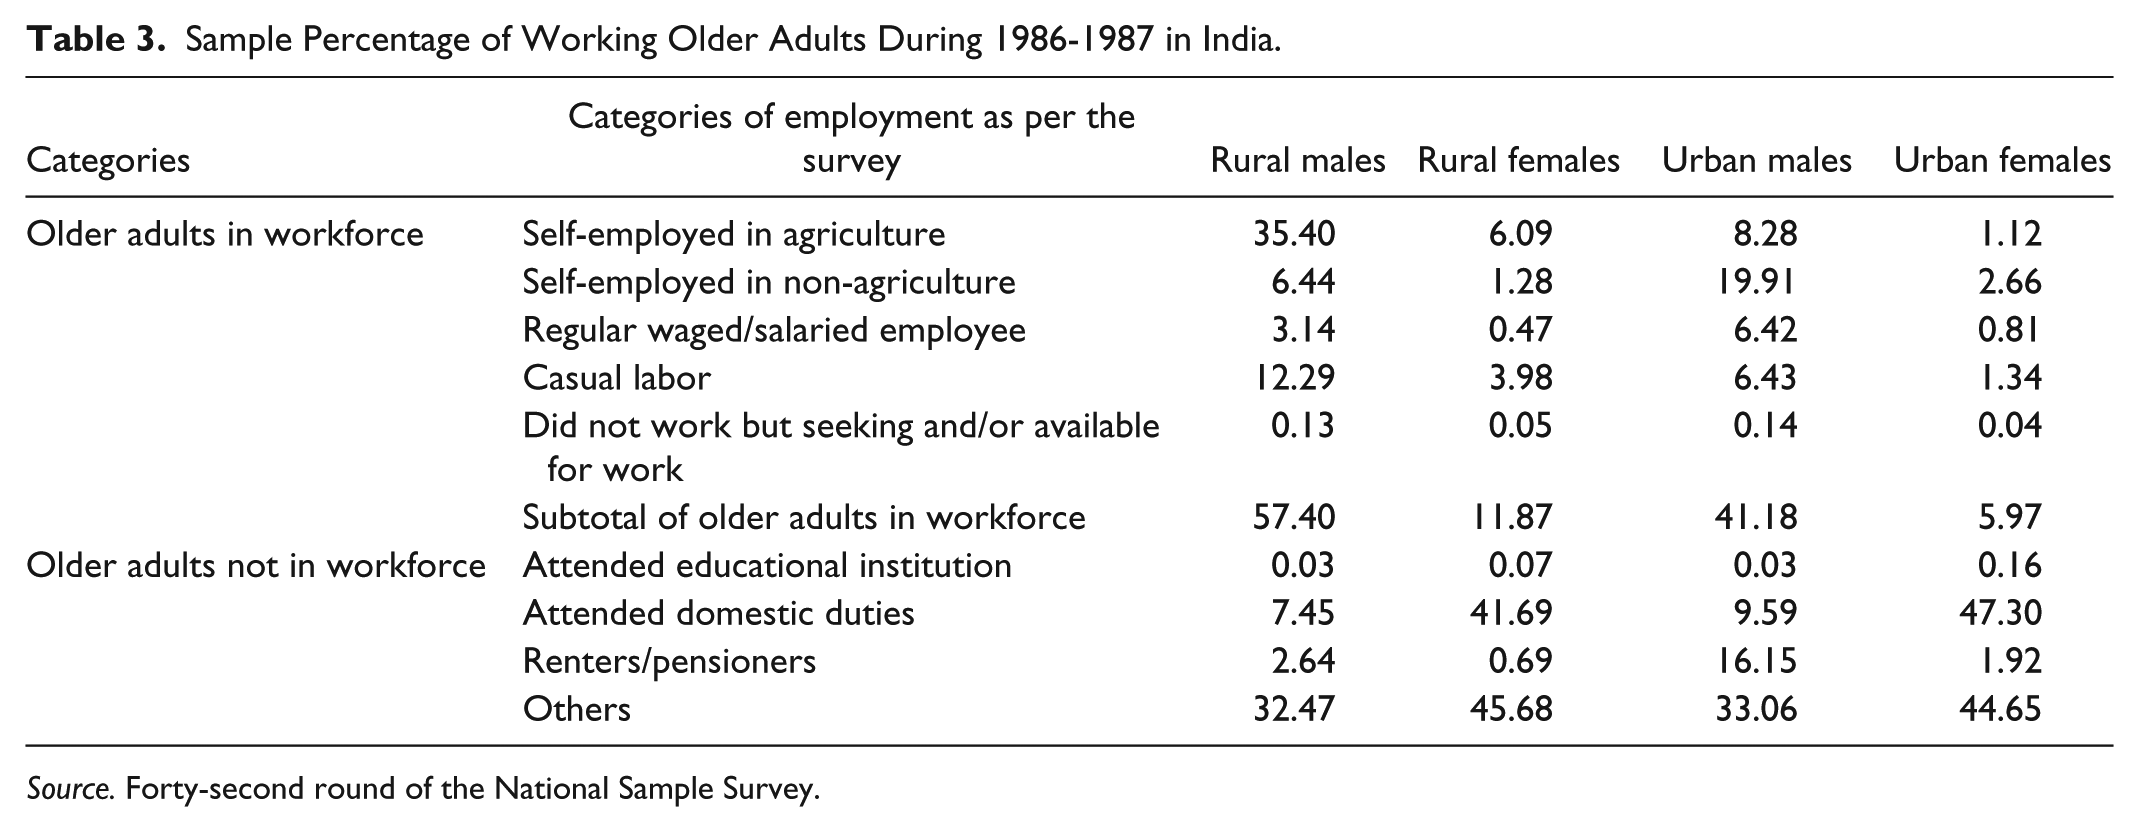
Source. Forty-second round of the National Sample Survey.
Sample Percentage of Working Older Adults During 1995-1996 in India.

Source. Fifty-second round of the National Sample Survey.
Sample Percentage of Working Older Adults During 2004 in India.

Source. Sixtieth round of the National Sample Survey.

The proportion of older males (large circles) and older females (small circles) who are reported to be employed during the three time periods 1986-1987 (left), 1995-1996 (center), and 2004 (right).
Sample Proportion of Working (1) and Not Working (0) Older Males and Older Females With Their Reported State of Financial Dependence During the Three Time Periods.

Source. The 42nd, 52nd, and 60th rounds of the National Sample Survey.
Note. Gamma indicates the extent of association between working and financial independence.
Proportion of Older Adults Who Are Reported To Be Financially Dependent by Age Groups.

Source. The 42nd, 52nd, and 60th rounds of the National Sample Survey.
Note. The figures in brackets show 95% confidence interval for the population proportion.
The effects of having property on the financial independence of older adults, while controlling for employment, age, gender and place of residence, are found to be positive. A similar kind of association is observed between having assets and financial independence. The positivity is in the sense that the estimated odds, in favor of being financially independent (when compared with being financially dependent), are 1.15 times higher for those older adults who possess assets when compared with those older adults who do not possess assets. Similarly, the estimated odds in favor of being financially independent are 2.06 times higher for those older adults who possess property when compared with those older adults who do not possess property. For the reference period 1995-1996, the corresponding estimated odds ratios are 2.17 and 2.27, respectively (Table 8). Similarly, the estimated odds in favor of being partially independent (when compared with being financially dependent) are 1.28 times higher for those older adults who possess assets when compared with those older adults who do not possess assets. Similarly, the estimated odds in favor of being partially independent are 1.52 times higher for those older adults who possess property when compared with those older adults who do not possess property. For the reference period 1995-1996 the corresponding estimated odds ratios are 1.61 and 1.62, respectively (Table 9).
Odds Ratios and Their 95% CI Based on Multinomial Logit Regression Model for Financial Dependence of Older Adults (Not Dependent on Others vs. Dependent on Others) for the Time Periods 1986-1987 and 1995-1996.

Source. The 42nd and 52nd rounds of the National Sample Survey.
Note. CI = confidence interval.
Reference category.
Odds Ratios and Their 95% CI Based on Multinomial Logit Regression Model for Financial Dependence of Older Adults (Partially Dependent on Others vs. Dependent on Others) for the Time Periods 1986-1987 and 1995-1996.
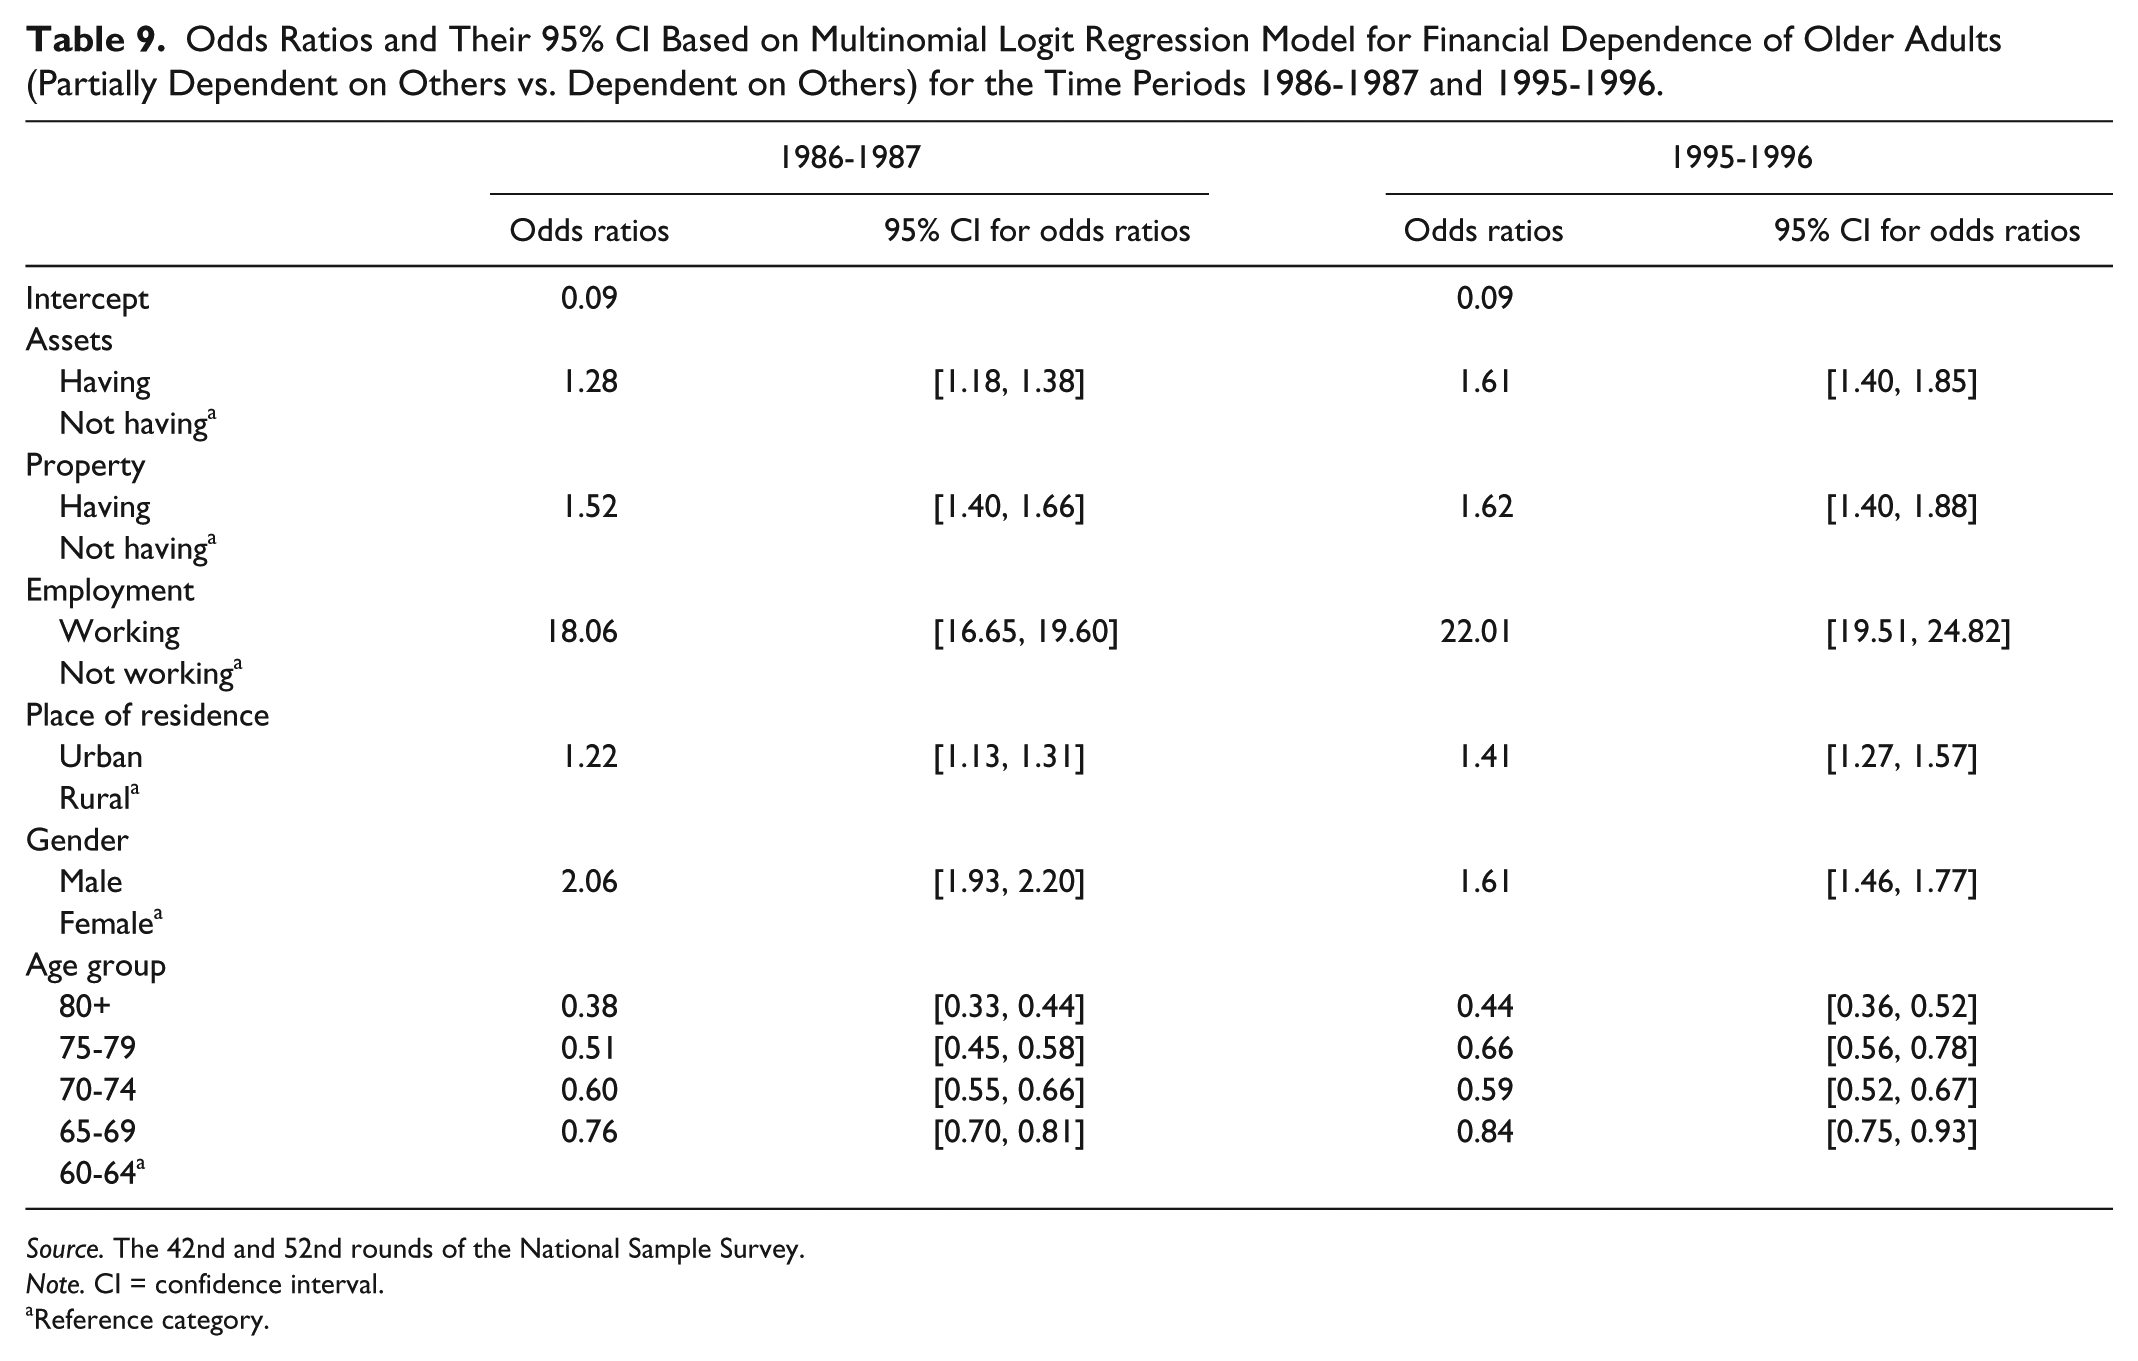
Source. The 42nd and 52nd rounds of the National Sample Survey.
Note. CI = confidence interval.
Reference category.
The financially independent older adults lend their support to financially dependent spouse and/or children. During the three reference periods 1986-1987, 1995-1996, and 2004, the sample proportion of such supporting older adults among the financially independent older adults was reported to be .69, .92, and .86, respectively. However, the financially dependent older females, if married, are supported by their spouse or children; and if widow, receive support mainly from their children. Most of the financially dependent older males are supported by their children (Figure 2). Similar to the state of financial independence, the state of power too shows association with age, gender, and marital status of the older adults.

Flow of support to the older adults among financially dependent older adults during 1986-1987, 1995-1996, and 2004.
Empirical evidences indicate that the proportion of the older adults who are engaged in managing their owned properties and assets reduces with an increase in their age (Figures 3 and 4). It is also evident from the figures that, when compared with the older males, the older females engage themselves lesser in these matters. These gender differentials also reflect in the odds ratios (Table 10). The sample odds in favor of managing property are 6.20 times and 5.22 times higher for older males than that for the older females during the reference periods 1986-1987 and 1995-1996, respectively. Similarly, the sample odds in favor of managing assets are 6.33 times and 5.55 times higher for older males than that for the older females during the reference periods, respectively (Table 10). Among the older adults, being married has an advantage, vis-à-vis power, over being widow. The odds in favor of managing assets and properties are higher for the currently married older males and older females (Table 11). Being able to manage owned assets and owned property, as a manifestation of power, has a positive association with financial independence (Table 12). Moreover, the association among older males is found to be stronger than that among older females.

The proportion of older males (larger circles) and older females (smaller circles) who report participation in management of property over different age groups in 1986-1987 (left figure) and 1995-1996 (right figure).
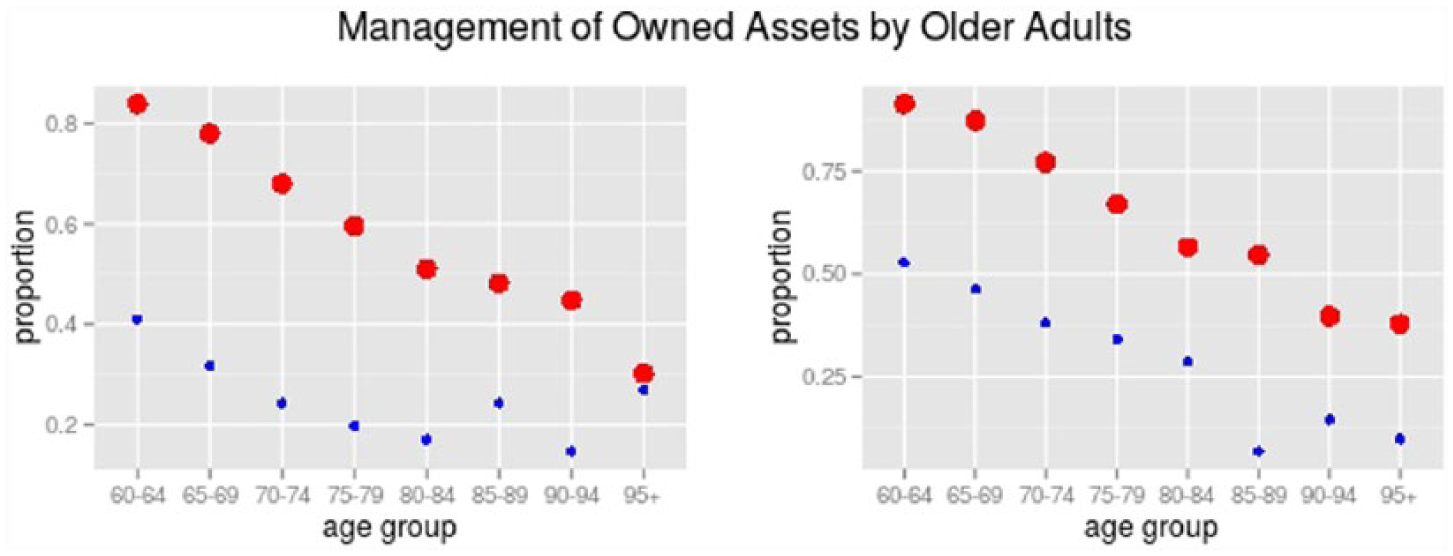
The proportion of older males (larger circles) and older females (smaller circles) who report participation in management of assets over different age groups in 1986-1987 (left figure) and 1995-1996 (right figure).
Sample Proportion of Co-Resident Older Adults Who Participate on Management of Their Owned Property and Owned Assets and Odds Ratios for Participation (Older Males vs. Older Females).

Source. The 42nd and 52nd rounds of the National Sample Survey.
Note. The figures in brackets show 95% confidence interval for the respective population parameter.
Sample Odds Ratios (Currently Married vs. Widow) for Older Females and Older Males for Management of Their Owned Property and Owned Assets and Odds Ratios for Participation.
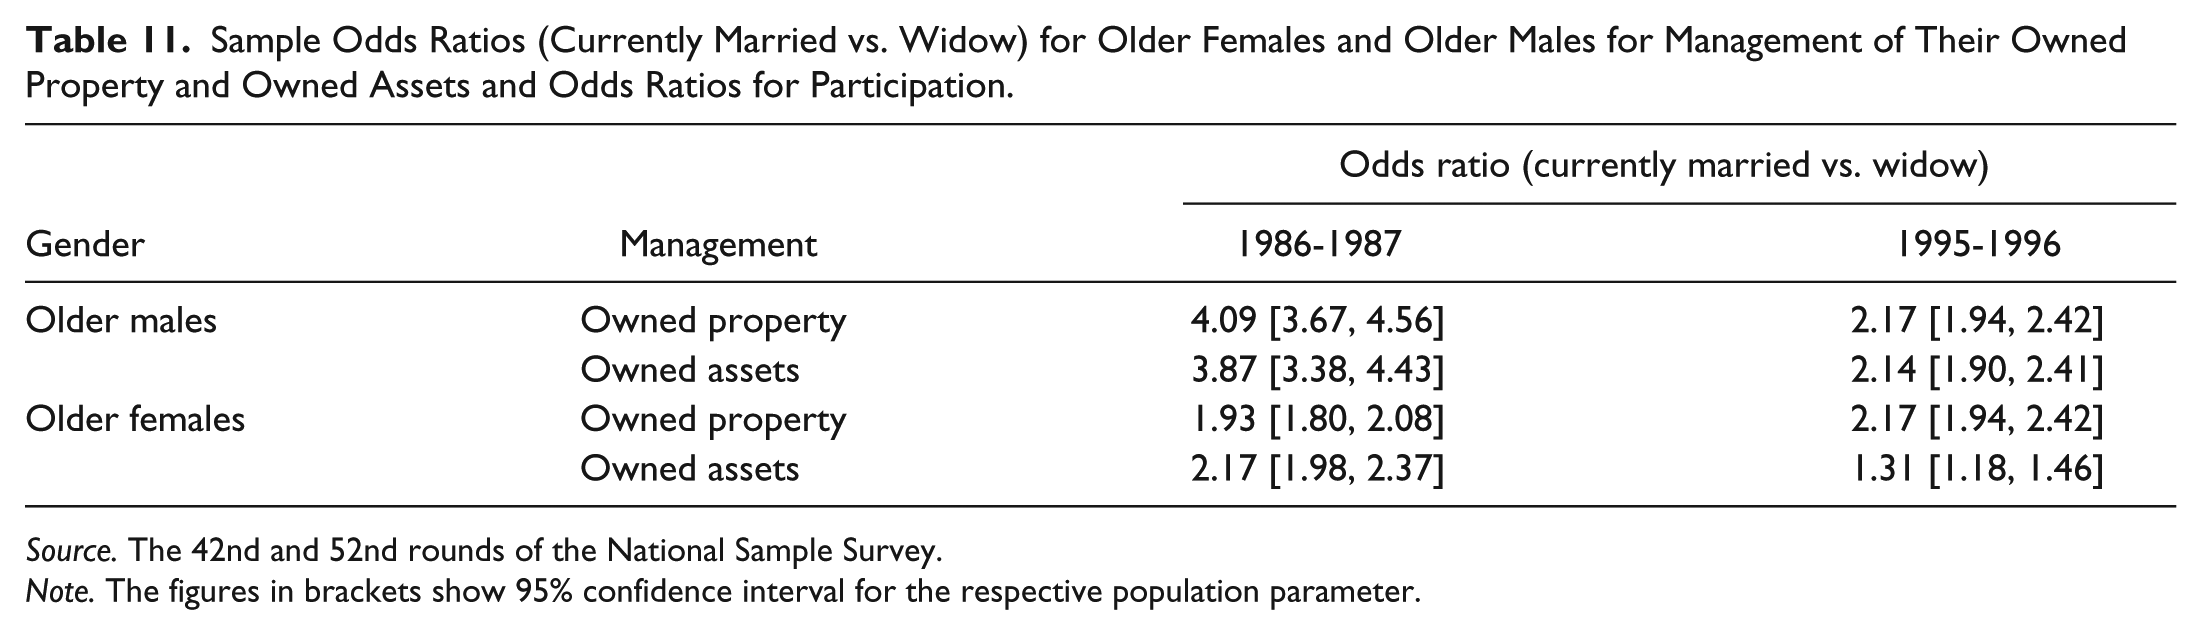
Source. The 42nd and 52nd rounds of the National Sample Survey.
Note. The figures in brackets show 95% confidence interval for the respective population parameter.
Gamma for Association Between Financial Independence and Power.

Source. The 42nd and 52nd rounds of the National Sample Survey.
Note. The parentheses include the p values for testing the significance of the statistic and the brackets include the size of the sample.
For a better state of well-being of older adults in a population, the participation of the older adults in the social matters (SM), the religious matters (RM), and the DHC ought to be total. However, samples from the 42nd and 52nd rounds of NSS indicate that the proportion of older males and older females who report participation in these matters decline as one moves from lower age groups to higher age groups (Figures 5, 6, and 7). Furthermore, the sample proportions of older females who report participation are lesser than the sample proportion of older males. The gender differences in participation are evident as the odds ratios (older males vs. older females) for both the time periods are found to be significant and more than 1. The odds ratios for participation in SM, RM, and DHC are 1.86, 1.63, and 1.50, respectively, for the reference period 1986-1987. The figures for the reference period 1995-1996 are 2.17, 1.73, and 1.16 for the respective indicators of integration (Table 13).

The proportion of older males (larger circles) and older females (smaller circles) who report participation in social matters over different age groups in 1986-1987 (left figure) and 1995-1996 (right figure).

The proportion of older males (larger circles) and older females (smaller circles) who report participation in religious matters over different age groups in 1986-1987 (left figure) and 1995-1996 (right figure).

The proportion of older males (larger circles) and older females (smaller circles) who report participation in daily household chores over different age groups in 1986-1987 (left figure) and 1995-1996 (right figure).
Proportion of Co-Resident Older Adults Who Participate in SM, RM, and DHC, and Odds Ratios for Participation (Older Males vs. Older Females).
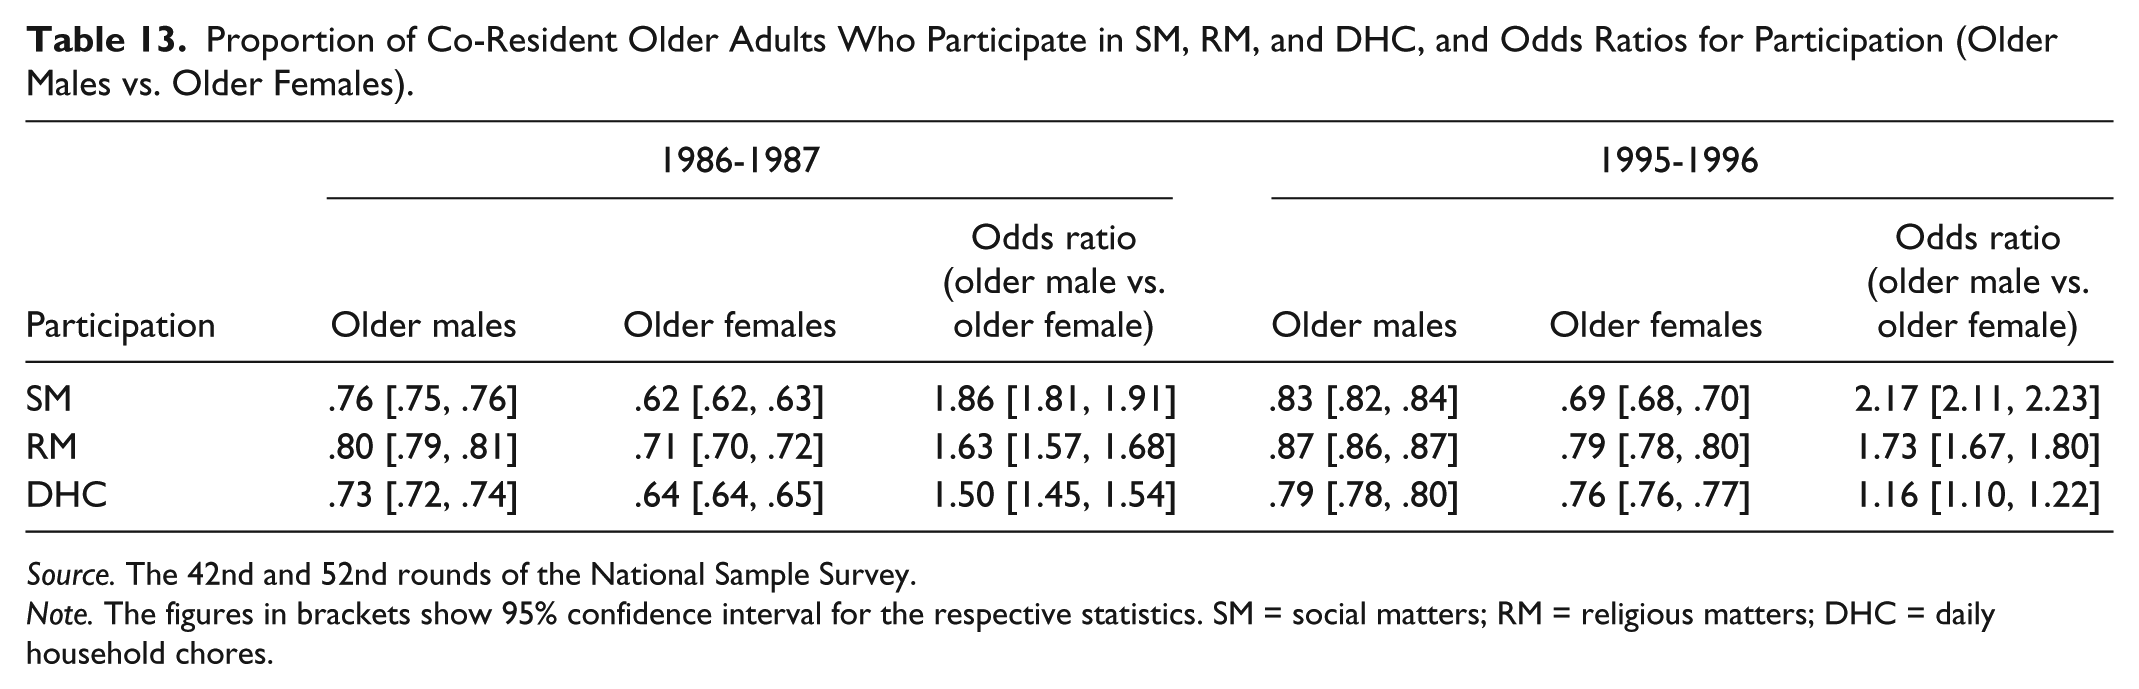
Source. The 42nd and 52nd rounds of the National Sample Survey.
Note. The figures in brackets show 95% confidence interval for the respective statistics. SM = social matters; RM = religious matters; DHC = daily household chores.
The married older adults are more likely to get integrated with their household through participation in SM, RM, and DHC when compared with widowed older adults. The estimated odds ratios (married vs. widowed) for older males, during the reference period 1986-1987, are 1.48, 1.98, and 2.12 for SM, RM, and DHC, respectively. During the reference period 1995-1996 the estimated odds ratio are 1.85, 1.82, and 2.04 for SM, RM, and DHC, respectively. Similarly, for older females the figures are 1.11, 1.16, and 1.61 for SM, RM, and DHC, respectively, during the reference period 1985-1986 and 2.27, 2.58, and 2.94 during the reference period 1995-1996 (Table 14). The findings on the elder abuse are described in the following section.
Odds Ratios (Currently Married vs. Widow) for Older Females and Older Males for Participation in SM, RM, and DHC.

Source. The 42nd and 52nd rounds of the National Sample Survey.
Note. The figures in brackets show 95% confidence interval for the respective statistics. SM = social matters; RM = religious matters; DHC = daily household chores.
Gender is found to be associated with VA, EA, and NE. Older females are 2.03 times more likely to face VA when compared with older males (Table 15). Older females are more prone to EA and NE as they are 1.67 times and 2.17 times more likely to face EA and NE, respectively, when compared with older males. Financially dependent older adults are 1.81 times more likely than the financially independent older adults to face PA. Widow older adults are 0.61 times less likely to face EA when compared with their married counterparts. SD is less likely to happen with increasing age as the odds in favor of SD reduce by 0.98 times with a unit increase in age of older adults. Furthermore, the model for any type of abuse indicates that older females are 1.25 times more likely than older males to face abuse. Older adults who are financially dependent and partially dependent are 1.96 and 1.26 times more likely than their financially independent counterparts to face abuse. The following sections provide a situational analysis of the three types of households defined earlier.
Odds Ratios (Facing Abuse vs. Not Facing Abuse) Based on Logistic Regression Models.
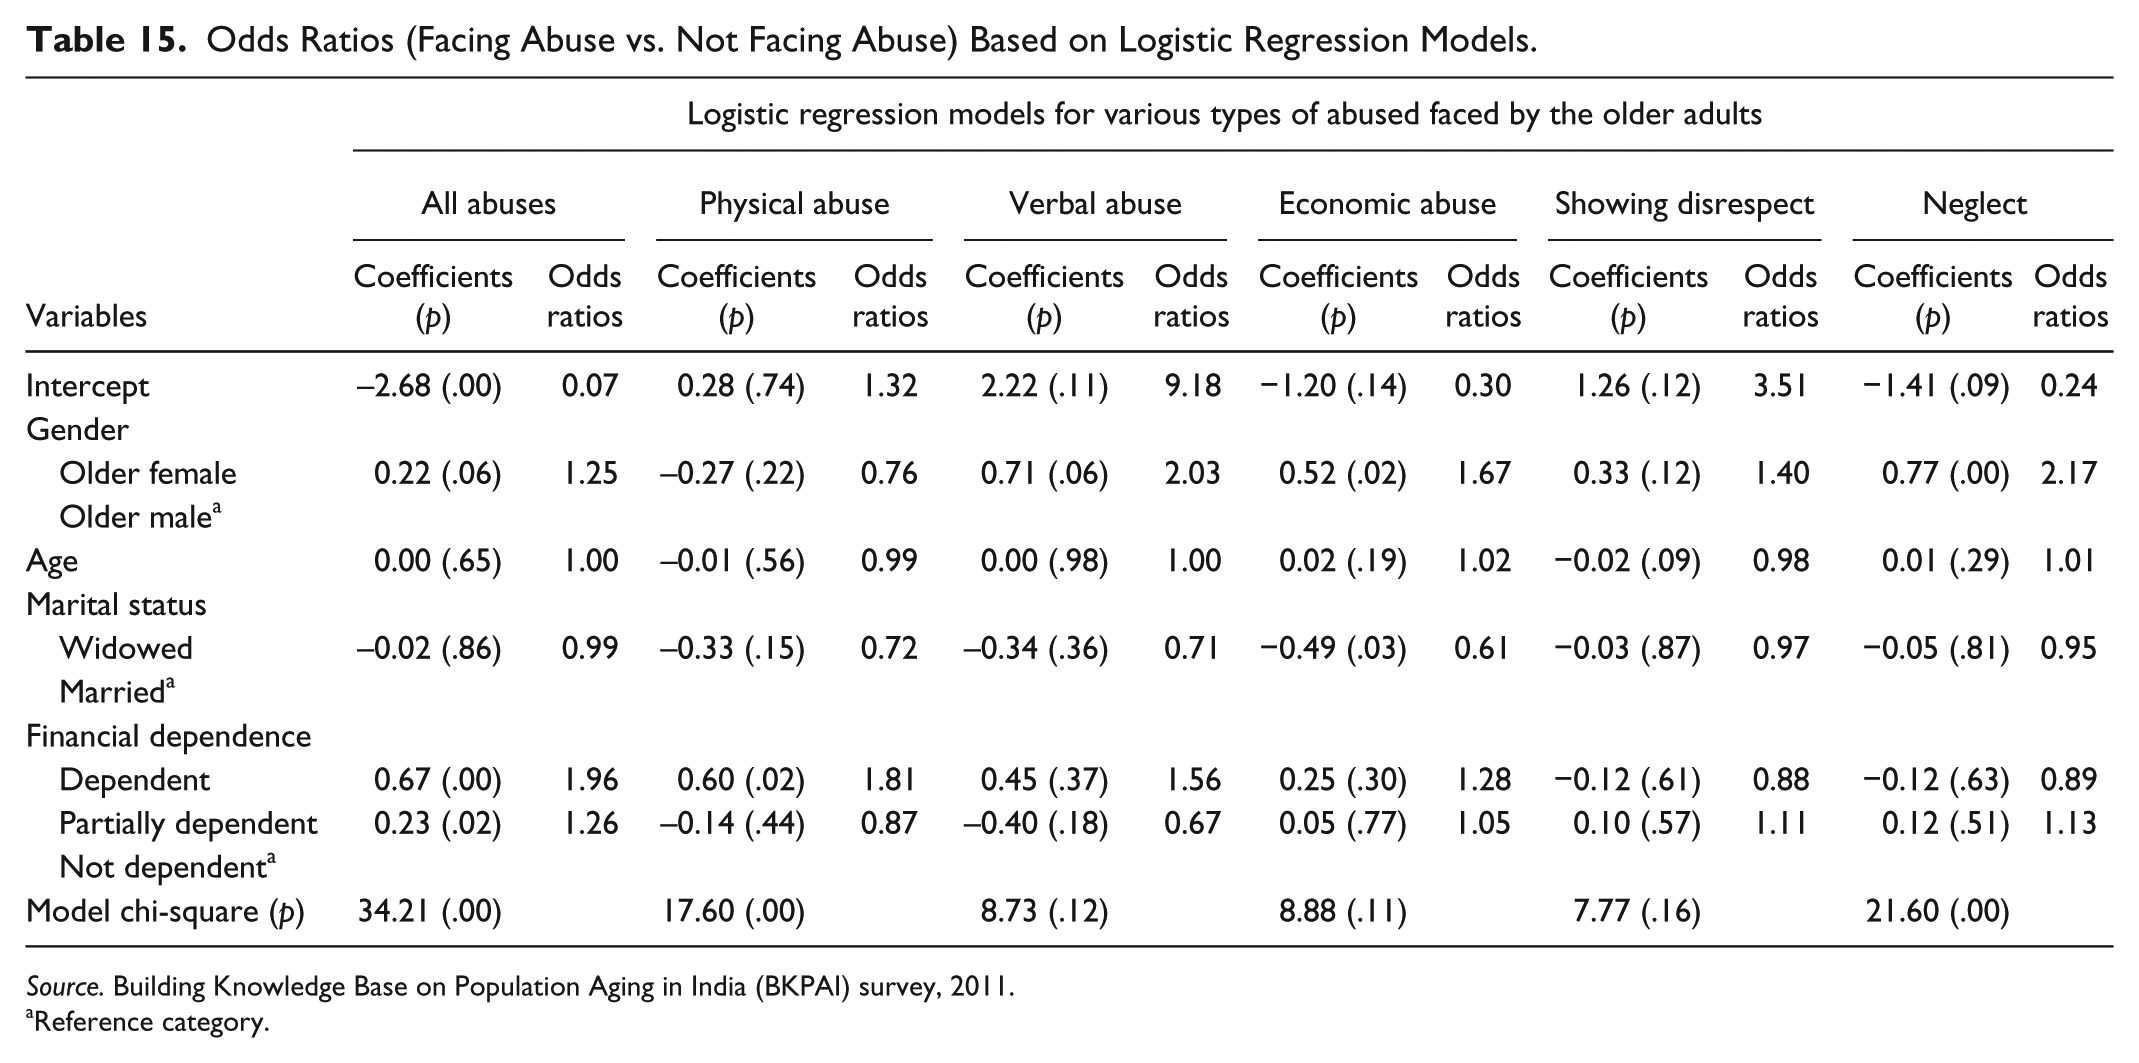
Source. Building Knowledge Base on Population Aging in India (BKPAI) survey, 2011.
Reference category.
The estimates of the proportion of Type I, Type II, and Type III households show an increase in the proportion of Type II and Type III combined (Table 16). This increase is experienced in rural as well as urban areas. In other words, there is an increase in households with older adults over the decade 1995-1996 to 2004. Furthermore, among the households with older adults, the ratio of co-residence to alone type of households has decreased in urban areas from 11.50 in 1986-1987 to 8.09 in 2004 (Table 17). In rural areas too this ratio decreased from 8.09 in 1986-1987 to 7.33 in 2004.
Sample Proportions of Combined Type II and Type III Households.

Source. The 42nd, 52nd, and 60th rounds of the National Sample Survey.
Note. CI = confidence interval.
Sample Proportion of Type III (Alone) Households Among Type II (Co-Residence) and Type III Households.

Source. The 42nd, 52nd, and 60th rounds of the National Sample Survey.
Note. CI = confidence interval.
The statistics regarding HOADR and HYDR for Type II households (Table 18) indicate that there is a rise in mean HOADR in rural and urban areas over the time. During the same period, it is observed that the average HYDR has declined over the time. This holds for both the rural and the urban areas. Values of the average HOADR and the average HYDR are found to be higher in rural areas when compared with those in the urban areas for all reference periods.
Sample GM of HOADR/HYDR in Rural and Urban Areas for Type II Households in India.

Source. The 42nd, 52nd, and 60th rounds of the National Sample Survey.
Note. The figures in the brackets denote the size of the sample used to calculate the statistic. GM = geometric mean; HOADR = household old age dependency ratio; HYDR = household young dependency ratio.
The values for the ratio of MHME for Type I/Type III with respect to MHME for Type II, for the three reference periods are described in Table 19. The alone type of households have a higher MHME when compared with the co-residence type of households for all the given reference periods and for rural and urban places of residence. The households without older adults when compared with the co-residence type of households do not differ with respect to the MHME but they are found to be more deprived than the co-residence type of households. Let us now consider the economic condition of the three types of households in terms of deprivation with respect to selected indicators. Keeping in view that the MPIs are not comparable across time periods, some salient observations (Table 20) regarding the three types of households are presented. Older adults having alone type of living arrangements are more deprived than people residing in co-residence type of households. This holds for rural as well as urban areas for all the time periods considered. People residing in Type I households are more deprived than people living in co-residence type of households. However, they are less deprived when compared with older adults having alone type of living arrangements.
Ratio of MHME for Type I, Type II, and Type III Households in India.

Source. The 42nd, 52nd, and 60th rounds of the National Sample Survey.
Note. MHME = median of household monthly expenditure per person.
Data not available.
Sample Headcount Ratio, Sample Intensity of Poverty, and MPI For Type I, Type II, and Type III Households in India.
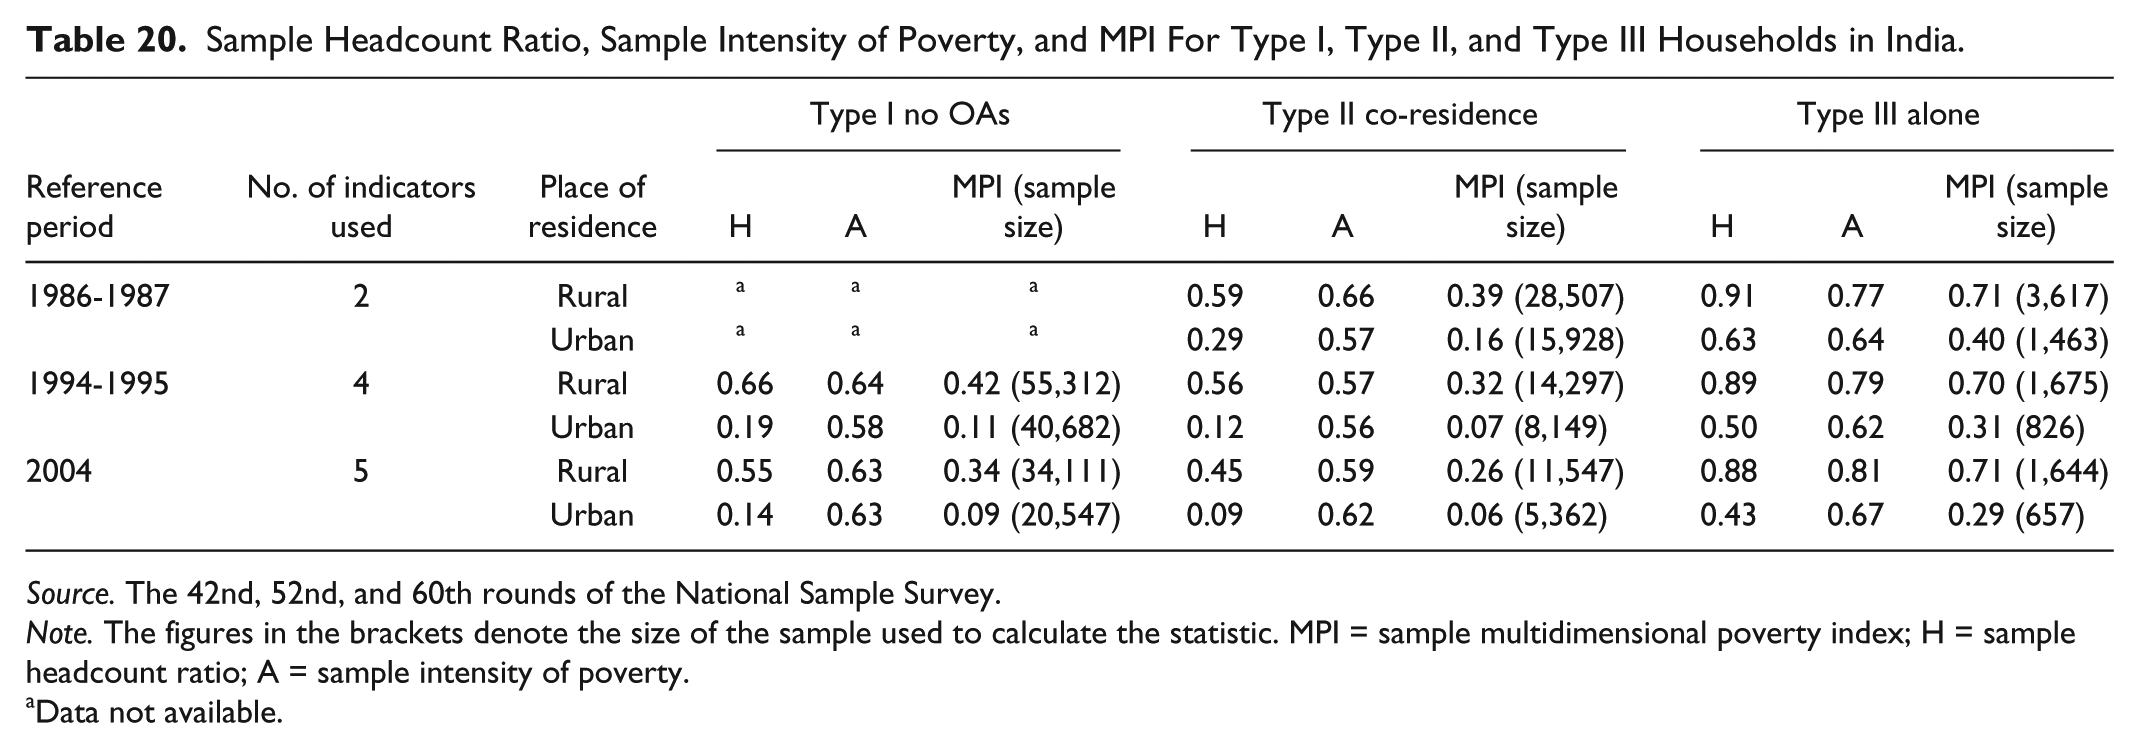
Source. The 42nd, 52nd, and 60th rounds of the National Sample Survey.
Note. The figures in the brackets denote the size of the sample used to calculate the statistic. MPI = sample multidimensional poverty index; H = sample headcount ratio; A = sample intensity of poverty.
Data not available.
Discussion
The foregoing analyses provide a three-tier description of aging in India. The three tiers of aging are the aging individual, the aging household, and the aging population. The utility of a three-tier approach to aging is that it may help formulating a three pronged policy to address various types of challenges imposed by aging. The policies need to simultaneously address the older adults, the families that have older adults as their members, and the population.
This study is primarily based on three countrywide representative data sets of the NSS. The periods, pertaining to these sample surveys, span more than 18 years from 1986 to 2004. However, throughout this period similar patterns are observed regarding the work, the integration, and the empowerment among the older adults.
A change in work status, a change in marital status, and susceptibility to chronic conditions are quiet possible for an individual at older ages (Figure 8). The findings indicate that the life of an older adult is not immune to such changes. The married older adults are found to be more participating in their household matters. They are also more likely to be decision makers than their widow counterparts. Gender differential prevails in the matters pertaining to exercising power in financial matters and participation in household affairs. The older males are in relatively better position (Figure 8). Rajan (2010) has opined that the disadvantaged status of older females vis-à-vis the ownership of financial assets/property is due to limited implementation of inheritance laws. These differentials may be attributed to the social construct of the Indian society. The family and the society need to be educated on these issues so that these differentials cease to exist.

Figure showing the association and logical causal links between two variables for various variables central to the well-being of older adults.
There is also a need to sensitize public to uphold the dignity of the older adults. This is so because different types of abuses are reported by the older adults. Older women and financially dependent older adults are more likely to face abuses. It is recently that such information is being made available in large-scale surveys in India. Nevertheless, the NSSs need to incorporate this crucial information in their surveys on the older adults. It is also desired that countrywide information on social and economic aspects of the older adults be made available more frequently and in greater detail through the NSSs. This is because the rounds of the NSS for the years 1986-1987, 1995-1996, 2003-2004, and 2013-2014, which included surveys on the older adults, have a greater focus on health-related issues among older adults. Although a sound health is an important determinant of the well-being of the older adults, the present study limits itself to the socioeconomic aspects of their well-being.
Financial independence is desirable among older adults. Employment, property, and assets enhance it (Figure 8). However, work participation and remunerative job opportunities decline with age. Therefore, the need for financial support is greater among those older adults who are at the higher end of the age spectrum. If fact, the older females need it the most. Although, various old age pensions schemes are in effect, in Indian states, the adequacy of the pension amount in ensuring financial independence needs to be periodically assessed. The pensions need to be enhanced with increasing age of the older adults. Meeting the financial needs through a judicious combination of public and familial transfers may provide a viable solution.
Alone kind of living arrangements is found to be increasing among the older adults. Furthermore, the share of younger ones is declining in the co-residence type of living arrangements. According to Velkoff (2000), these changes are responses to the trends in fertility, mortality, and migration that impact on family size and household structure. The adults in a household are potential care providers to the older adults. However, if this trend persists, an alternative structure for providing care to the older adults may be required. In other words, care needs to be available at the doorsteps of the older adults.
Another crucial aspect is the relatively deprived condition of the older adults in the alone type of living arrangements. It may be possible that their higher expenditure may be responsible for this deprivation. The higher expenditures observed among the households with alone type of living arrangements may be due to the costs incurred in maintaining sound health at older ages. Potential of alternative systems of health care and medicine, that are cost effective, may lessen the financial burden of ill health at the older ages. Focused in-depth studies are called for to understand and address the reasons for relative deprivation in alone kind of living arrangements. Unlike the older adults living alone, the co-residents have a relatively lesser deprived life. The reason may be that the resources get shared in a co-residence type of living arrangement. This also results in a lower cost of living. A policy on living arrangements is desired that promotes co-residence on one hand and a housing policy for older adults who opt for alone type of living arrangements on the other.
The signs of aging are evident in the population of India. To put it in simple terms, the proportion and number of people in higher age groups is gradually increasing. In this perspective, a policy on population is called for so that the social system may be able to manage aging. The bottom line remains that no society can afford aging of its population to continue so as to reach an unmanageable extent. More so, the population policies that address the macro perspectives and welfare policies for older adults are individual centric. Involvement of the family, through an integrated family-centric policy, may better ensure the well-being of the older adults.
Footnotes
Acknowledgements
The data sets from Building Knowledge Base on Population Ageing in India (BKPAI) Survey, 2011, were provided by the Institute for Social and Economic Change, Bangalore, India. The authors are thankful to Dr. Anamika Priyadarshini, Center for Development Studies, Central University of Bihar, India, for inputs on empowerment.
Declaration of Conflicting Interests
The author(s) declared no potential conflicts of interest with respect to the research, authorship, and/or publication of this article.
Funding
The author(s) received no financial support for the research and/or authorship of this article.