
Abstract
In this article, visual speech information modeling analysis by explicit mathematical expressions coupled with words’ phonemic structure is presented. The visual information is obtained from deformation of lips’ dimensions during articulation of a set of words that is called visual speech sample set. The continuous interpretation of the lips’ movement has been provided using Barycentric Lagrange Interpolation producing a unique mathematical expression named visual speech signal. Hierarchical analysis of the phoneme sequences has been applied for words’ categorization to organize the database properly. The visual samples were extracted from three visual feature points chosen on the lips via an experiment in which two individuals pronounced the aforementioned words. The simulation results show that each individual word can be represented by a mathematical expression or visual speech signal whereas the sample sets can also be derived from the same mathematical expression, and this is a significant improvement over the popular statistical methods.
Introduction
The audiovisual speech recognition and visual speech synthesizers are two interfaces for human and machine interaction (Chin, Seng, & Ang, 2012). Such interaction relies on the analysis and synthesis of both audio and visual information, which humans use for face-to-face communication. It has been shown that the visual cues of speech also enhance the transparency of speech when they are degraded by environmental noise (Sumby & Pollack, 1954).
The visual speech information is the bimodal component of audio speech signal. These modalities are strongly correlated that could affect the perception of lip movement and audio speech signal (McGurk & MacDonald, 1976). In audiovisual speech recognition systems, the visual information is used as complementary tool for enhancing the perception of speech signal modality or independently for lip reading. The visual recognition module is called interchangeably as lip-reading, visual speech recognition, speech reading, or visual-only automatic speech recognition (Petajan, 1984; Potamianos, Neti, Luettin, & Matthews, 2004).
In lip-reading systems, the dynamics of visual speech in image sequences are extracted by focusing on the appearance of the articulator organs like lips’ geometry. Further processing could be conducted to be compatible for fusing to the audio-only automatic speech recognition modality.
A basic component related to phoneme in the visual domain was determined and called viseme (visual phoneme; Fisher, 1968). Since then, no globally accepted model has been suggested for formulating the visual speech components. The concept of visual phoneme does not suggest an explicit definition of lips’ structure during phoneme utterance. The visemes are formed based on human perceptions which are categorized using confusion matrix where the most accurately detected visemes form a phoneme–viseme table (Williams, Rutledge, Garstecki, & Katsaggelos, 1997). The deficiency of this method can be observed by the fact that there are various phoneme–viseme tables used (Goldschen, Garcia, & Petajan, 1994; Hazen, Saenko, La, & Glass, 2004; Jiang, Alwan, Auer, & Bernstein, 2001). The next drawback of the viseme concept was the lack of accuracy in visual phonemes perception caused by human interference. In other words, depending on the observers, whether they are hearing impaired or not, the results were changing. In addition, the concept of viseme represents the visual information as discrete components. Therefore, the continuity of visual speech components must be conducted by complementary methods (Cohen & Massaro, 1993).
To eliminate the additional methods for preserving the continuity of visemes, the most dominant approaches are statistical and probabilistic models (e.g., Hidden Markov Model [HMM]; Heracleous, Tran, Nagai, & Shikano, 2010; Kosmopoulos & Chatzis, 2010; Potamianos & Graf, 1998; Saenko, Livescu, Glass, & Darrell, 2009). The advantage of this approach is its ability to apply modifications and adjustments to the model using optimization methods and training algorithms (Huang & Povey, 2005; Lee & Park, 2006). However, those approaches do not have the ability to formulate the relations between viseme sequences. Therefore, currently there is no standard method which is globally accepted for representing the lips’ movement during articulation.
In Revéret and Benoît (1998), a 3D lip model was fitted to lip images, and the amount of similarities between the feature points on the model and actual lips were measured. Their results did not conclude the dynamic of articulating lips with a mathematical expression. In the suggested lip-reading system by Potamianos and Graf (1998), the visual features related to the width, height, and area of lip were tracked over frame or time domain during articulating a sequence of digits. Such trajectories of visual features were used for training a Hidden Markov Model that was not mathematically formulated. The acquired data (from movement of the lips) in Lucero (2002) was formulated by a sixth-order B-spline curve (Mortenson, 1997). The main disadvantage of using a B-spline curve for formulating the lips’ movement is the lack of definition of a single expression for the sample sets as B-spline curve is defined on segmented intervals (Mortenson, 1997). The visual information was extracted from tongue tip, tongue blade, tongue dorsum, velum, upper and lower lip, and lower jaw by Electromagnetic Articulography (Ananthakrishnan & Engwall, 2008).
The method suggested in Birkholz, Kröger, and Neuschaefer-Rube (2011) is a time-variant dynamic system used for modeling the articulatory organ to relate facial parts mentioned above by using Electromagnetic Articulography approach. A combination of phoneme was chosen with normal and low speaking rates. The input–output relations of the systems were obtained by solving differential equation in time domain. Although the proposed method tried to allocate a transfer function to describe the dynamics of lips and the related organs, finding the solution of the system in time via differential equations caused computational overhead and do not represent a single expression for the lip movement that is considered as a disadvantage for this method.
The extraction of feature points using the appearance-based approach in Zhao, Barnard, and Pietikainen (2009) was suggested using a statistical visual feature modeling by concatenating the image sequence portions in block volume. Applying an image processing approach called Local Binary Pattern (LBP), the lips’ textures between successive images in gray scale are used and transformed to binary codes. Afterward, the LBP is applied on the other two orthogonal planes to the image plane, which codes the spatial and temporal axis. The histogram of these binary orthogonal planes was calculated and represented as the visual feature. By concatenating of the histograms, two important characteristics as lips’ appearance and also the motion of lips are extracted. The sequences of histograms were joined to represent the overall statistical property of lip movement. In other words, their method not only extracts the visual feature but also expresses the deformation of visual features dynamically. Interpreting the dynamic of lips is determined based on analyzing the extracted data as appearance-based methods including statistical models (Adjoudani & Benoît, 1996; Bregler & Konig, 1994; Erber, Sachs, & DeFilippo, 1979) and shape-based methods or geometric approaches (Chiou & Hwang, 1997; Rogozan & Deléglise, 1998; Teissier, Robert-Ribes, & Schwartz, 1999) and a combination of appearance-based and shape-based methods (Cootes, Edwards, & Taylor, 1998). The necessity for suggesting a globally defined visual phoneme concept supports the mathematical modeling of the visual information. Therefore, the focus of this article is on extracting the geometry of lips during articulation to suggest a mathematical model of lips’ dynamics as there is no specific attempt for expressing the visual speech data during articulation by an explicit mathematical formula. In this article, a straightforward method for formulating the visual speech data is represented, and the above-mentioned data is extracted from transcribed words which are designed based on phonemic structures.
There are two varieties of human–machine interactions, where in the first one, the machine plays a role as interface in human-to-human interaction (audiovisual speech recognition) or animation (visual speech synthesis). In the audiovisual automatic speech recognition (AVASR) systems, the visual information is the input of identification for enhancing the perception of speech signal modality. This visual recognition module is called interchangeably as lip-reading, visual speech recognition (Petajan, 1984), speech reading, or visual-only automatic speech recognition (Potamianos et al., 2004). In the lip-reading systems, by focusing on the appearance of the lip’s geometry or pixels color in image sequences, the dynamic of articulating lip is extracted. This information has to be processed to be compatible for fusing to the audio-only automatic speech recognition (ASR) modality. The usage of viseme appears in this stage. However, in animation or visual speech synthesis, the speech signal (Massaro, Beskow, Cohen, Fry, & Rodriguez, 1999) or transcribed information of words (Ezzat & Poggio, 1998) is used for lip’s movement identification. In both cases, the lip movement is interpreted from phoneme–viseme table. Furthermore, in audiovisual speech processing, the visual expressions can also be used as audio speech anticipators. The anticipation effect has been represented in Kim and Davis (2003), where in Conrey and Pisoni (2003), the asynchrony of visual speech and audio speech information perception are examined. It has been shown that the tolerance of perceivers to visual speech cues preceding the audio speech cues is higher.
Referring to viseme, its framework has not been explained systematically. The main issue in viseme concept was lack of globally accepted definition for relation between phoneme and its visual appearance, for example, there are varieties of phoneme–viseme tables. The next drawback of the viseme concept is the lack of accuracy in perception of visual phonemes due to dependency on human perception of visual phonemes. In other words, depending on the observers whether they are hearing impaired or not, the results will vary. The next important issue is lack of explicit definition of the lip’s deformation to make a standard model of articulating lips. The concept of visual phoneme does not suggest an explicit definition of lip’s structure during phoneme utterance. In addition, the main factor of human perception in evaluating and selecting viseme could vary from one observer to another. Therefore, there is not any globally agreed and standardized phoneme–viseme table reference.
To interpret the dynamic of lips, many approaches have been employed. These approaches belong to three main groups depending on analyzing the extracted data as appearance-based methods including statistical methods (Adjoudani & Benoît, 1996; Bregler & Konig, 1994; Erber et al., 1979) and shape-based methods or geometric approaches (Chiou & Hwang, 1997; Rogozan & Deléglise, 1998; Teissier et al., 1999) and combinations of appearance-based and shape-based methods (Cootes et al., 1998). The necessity for suggesting a globally defined visual phoneme concept suggests expressing of the visual information by mathematical models. Therefore, the focus of this article is on extracting the geometry of lip during articulation to suggest a mathematical model for lips’ dynamics.
A 3D lip model was fitted to lips’ image (Revéret & Benoît, 1998), and the amount of similarities between the feature point on the model and actual lip has been measured. Their results did not conclude the dynamic of articulating lip with a mathematical expression. In the suggested lip-reading system by Potamianos and Graf (1998), the visual features related to the width, height, and area of lip were tracked over frame/time domain during articulating a sequence of digits “81926.” Such trajectories of visual features were used for training a HMM model but were not mathematically formulated. The acquired data (from movement of lip) in Lucero (2002) was formulated by B-spline cure (Mortenson, 1997). The main disadvantage of using B-spline for formulating the lip’s movement was lack of defining a single expressions for the sample sets as B-spline curve functions on segmented intervals. The extraction of feature points using the appearance-based approach in Zhao et al. (2009) was suggested by a statistical visual feature modeling by concatenating the image sequence portions in block depicted volumes. Using an image processing approach called Local Binary Pattern (LBP), the lip texture between successive images in gray scale are used to transform to binary codes. Afterward, the LBP is applied to the other two orthogonal planes to the image plane, which codes the spatial and temporal axis. The histogram of these binary orthogonal planes was calculated and represented as visual feature. By concatenating of the histograms, the two important characteristics (lips’ appearance and also the motion of lip) are extracted. The sequences of histograms are joined to represent the overall statistical property of lip’s movements. In other words, their method not only extracts the visual feature but also expresses the deformation of visual features dynamically. The method suggested in Birkholz et al. (2011) is a time-variant dynamic system used for modeling the articulatory relation of facial parts as tongue tip, tongue blade tongue, jaw, dorsum, upper lips, and lower lips by using electromagnetic articulography approach. The combination of phoneme was chosen as [CVCVCVCV] sequence with normal and low speaking rates. The input–output relation of the systems was obtained by solving differential equations in time domain. Although the proposed method tried to allocate a transfer function to describe the dynamics of lips and the related organs, the solution of the system in time via differential equations was computationally expensive and does not represent a single expression for the lip movement. According to the literatures, there is not any specific attempt for expressing the visual speech data during articulation by an explicit mathematical formula. In this article, a straightforward method for formulating the visual speech data is represented. The visual speech data is extracted from a transcribed words which are designed based on phonemic structure.
Having seen the need for a standard approach to model the visual phoneme, the emphasis of this research is on introducing a mathematical model for human visual speech. In this article, a novel method has been introduced for the analysis of the visual speech that has been developed based on both lips’ movements and linguistic clues in English language. The visual speech information was related to a set of words chosen based on phoneme sequences from a transcribed database.
This article is organized as follows. “Visual Feature Determination” section explains visual feature determination procedure. “Corpus Design” section discusses corpus design. Visual speech sample extraction is described in “Visual Speech Sample Extraction” section. The modeling of visual speech signals is shown in “Visual Speech Signal” section, and the results are given in “Results and Discussion” section. Finally the conclusion is discussed in “Conclusion” section.
Visual Feature Determination
In this section, a visual sample set which describes the lip geometry is defined. The process is also referred as parameterizing the lip. The visual samples extracted from these visual feature points are the upper lip position, the lower lip position, and the corner lip position. These positions are denoted by superscripts:
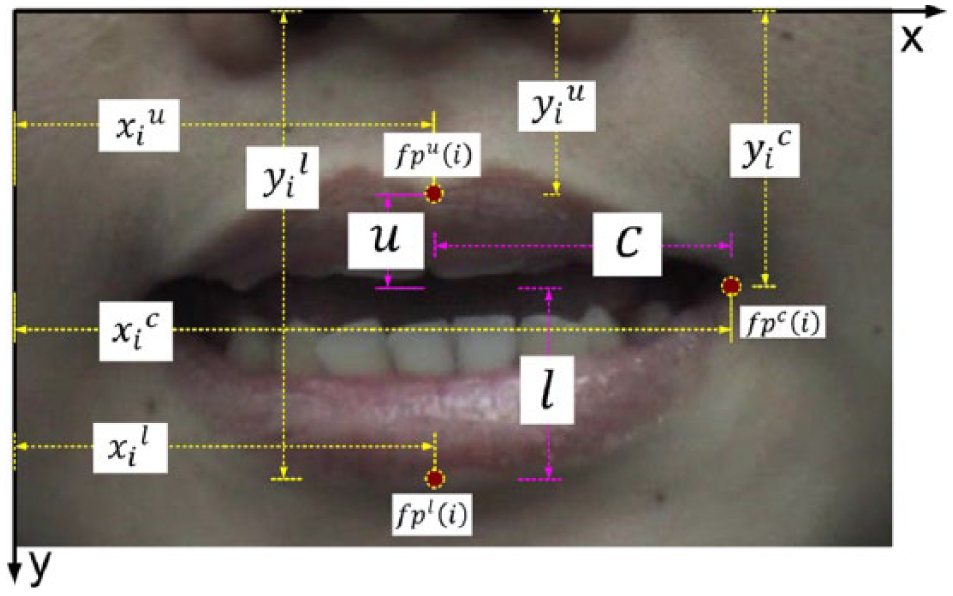
The geometrical representation of lip in a frame’s region of interest (ROI) and visual features pixels relations in Cartesian coordinates.
The samples from upper feature point
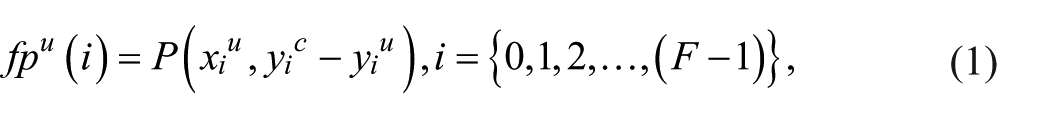

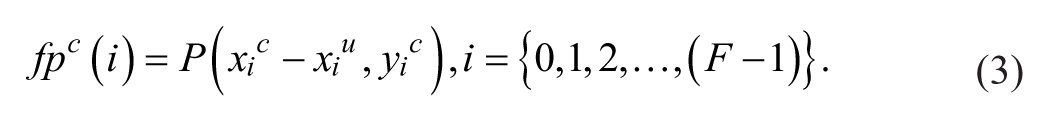
Here,
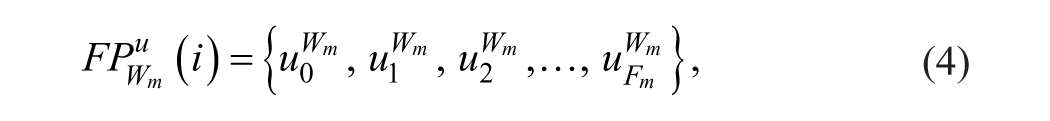


where
Corpus Design
The arrangements of phonemes in transcribed form (corpus) are also considered as one of the important issues in visual speech analyzers and synthesizers. It addresses the structures of phonemes used in lip-reading systems and visual animation of speech. There are several different corpora that differ in the structure of phonemes for generating lip movements. The structures of the corpora are shown in Kim and Davis (2003) where C and V refer to consonant and vowel phonemes, respectively. Each set corresponds to specific combinations of isolated phonemes.
In the first category of transcribed data, the isolated phoneme was used for lip reading (Petajan, 1984) or animation (Bregler, Covell, & Slaney, 1997). In the second scenario, a specific arrangement of vowel or consonant was fixed for visual analysis of speech. A corpora developed by Montgomery (1980) used the /CVCVC/ synthesizer while Adjoudani and Benoît (1996) used /V1CV2CV1/ corpus. The random combination of phonemes as /aCa/ was addressed in the corpora structure by Su and Silsbee (1996). The phoneme arrangements as a part of a French sentence “C’est pas /VCVCVz/?” was also examined by Revéret and Benoît (1998). Czup (2000) used triphone sequences /V1CV1/ and /C1VC1/ corpora. For a Brazilian Portuguese facial animation system proposed by De Martino, Magalhaes, and Violaro (2006), the corpora consisted of two types of phonemes combinations as /CV1CV2/ and /V1V2/ while the /VCV/ structure was used by Cox, Harvey, and Newman (2008) and Alothmany, Boston, Li, Shaiman, and Durrant (2010). This model was used for training a HMM in ASR system with different four conditions under seven levels of noise.
The suggested structure of corpus of Castilian Spanish used by Melenchón, Martínez, De La Torre, and Montero (2009) consisted of /CVCV/. Their purpose for using such structure was supported by a strong statement, which claims more than 80% of Castilian Spanish words flow /CV/ structure (de Vega, Álvarez, & Carreiras, 1992). A suggested phoneme arrangements by Birkholz et al. (2011) produced /CVCVCVCV/ sequences. These methods are also noted in Table 1 where accordingly no evidence for choosing such arrangements of phoneme sequences was presented. The main disadvantage of such corpora arrangement is ignoring the actual sequences of consonants and vowels in existing words, in contrary with the above considered sequences.
The Structure of Phonemes Used as Corpora.

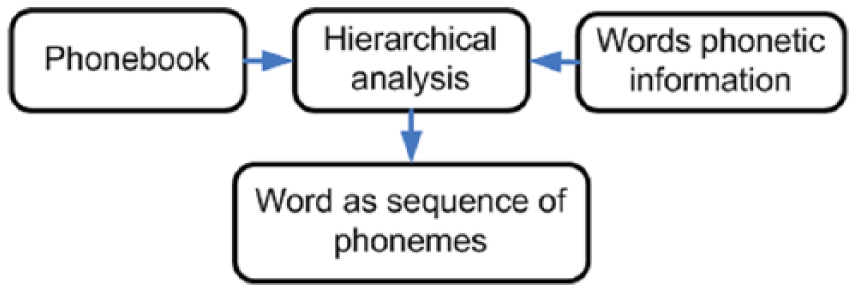
Hierarchical analysis of the phoneme sequences has been applied for words’ categorization to organize the database properly that covers the above-mentioned disadvantage. The sequences of phonemic symbols are the subject of such analysis. Driving visual speech signals for visual speech samples will be more comprehensive if the signals are produced from a specific family of words. Accordingly, the most frequent phonemic alphabets that lead to the most frequent sets of words which have similar phoneme sequences can be extracted. The phonemic structures make the words families. This procedure is called phoneme-based analysis of words in the current study.
In reality, words have specific uniquely defined sequences of phonemes. Generating the combination of phoneme sequence starts from the beginning of a word. This eliminates the need to study the random combination of phonemes. Obviously, many words share the same phoneme sequence in their initial parts. One of the significant advantages of phoneme-based analysis of words is the ability of controlling the mathematical expressions in the visual domain. In this work, the common phonemes in the initial parts of the words are found based on the search in three sequences of phonemes (triphones), and this is the basis of designing the corpus.
In Figure 2, detail about the hierarchical approach for obtaining a limited set of words is illustrated. One of the most well-known sources of ASR, which provides varieties of the audio-only databases bodies, is the Linguistic Data Consortium (LDC). Among the databases, the Texas Instrument and Massachusetts Institute of Technology (TIMIT) Acoustic-Phonetic Continues Speech Corpus is chosen for this study. This database was widely used in the ASR systems like Hidden Markov Model Toolkit (HTK).

The designing steps toward extracting a limited set of words.
The hierarchical analysis is applied to entire corpus to derive more information about the behavior of phonemes in the corpus.
This concept provides the relation between the mathematically expressed visual speech signals called visual words and the meaningful combinations of sounds that are marked by words. Consequently, the mathematical expressions, which would be driven for the visual words, are also categorized as a group. Therefore, the words are grouped mathematically. In mathematical form, the difference between each member of group will be revealed after the third phoneme.
Therefore, the visual speech signals demonstrate a systematic relation between a member of the word’s family and its family members. This method could be used in lip-reading and also animation systems. Toward establishing the signals expression for structural words, a set of words were chosen by the criteria of maximum phonemic sequence occurring among all the transcribed words. This method can be applied to any word in dictionary, but for this study, a collection of words is chosen in English language for synthesizing the visual word database.
Adaptation Phase
In the field of speech processing, it is possible to select the appropriate viseme table that has been chosen as the visual domain representation reference. Selecting appropriate phoneme–viseme mapping table for analysis of phonemic structure would be beneficial in deriving the practical visual speech signal expressions that are adaptable to audiovisual speech recognition systems. In other words, the method of deriving visual speech signals could be applied to the speech recognizer system as its collaborating visual domain. According to Potamianos et al. (2004), a phoneme set used in HTK was selected as the phoneme–viseme mapping table. In this mapping scheme, the many-to-one strategy was applied based on the manner of articulation. The consonants consist of eight subgroups of phonemes that have visual similarities during articulation, while vowels are categorized into four subgroups.
Phoneme-Based Hierarchical Analysis
In this part, the hierarchical analysis is used for studying the combination of phonemic components in the words. In the hierarchical analysis of words phonemic structure, the goal is grouping all possible sequences of consonants and vowels. This process schematically is depicted in Figure 3.
Searching for word’s phonemic rules.
Words Phonemic Pattern Analysis
The hierarchical analysis provides the information for systematic analysis of organized data. Using this approach to the phonemic representation of words, the hierarchical probability information of phonemes sequences is extracted as they appear in words. A decision tree is defined in sequentially arranged levels. The nodes relations were defined by connecting lines from their current level to the other nodes in the successive level. The nodes represent a particular state, group, event, or position in each level that exists in the data set. The connecting lines represent conditional rules that define the transition among the nodes between two consecutive levels. These rules are stated by the maximum numbers of repetitions mapped to phonemes in each level. In this work, the nodes of the decision tree are denoted by the consonants and vowels. The tree representation of phonemes sequences is shown in Table 2 where 13 words are selected and categorized having the same phonemic sequence for three levels.
The Tree Representation of Phonemes Sequences Categorizing All 13 Words as Branches of One Root.

Visual Speech Sample Extraction
The practical phase of this work was represented in Figure 4. After designing a corpus, the test subjects were asked to articulate the words. A camera captured their lips’ movements. The lips’ geometry was parameterized on the region of interest by three static feature points located on upper, lower, and corner outer contour of lip. Therefore, each word has three sets of samples in visual domain. The movement of these feature points can describe the lips’ movement. The visual data was extracted automatically and manually.

The practical phase of the work.
The speakers were two non-native women aged between 25 and 31with no speech disorders or hearing disabilities. The visual speech sample sets

The (a) upper, (b) lower, and (c) corner visual speech sample sets after adjusting the end points.
Visual Speech Signal
The Lagrange (Lagrange-Newton) interpolation was a method of polynomial formulation, which constructs a continuous-time polynomial
The corresponding amplitudes of samples are defined as

The Lagrange interpolation is expressed as

where
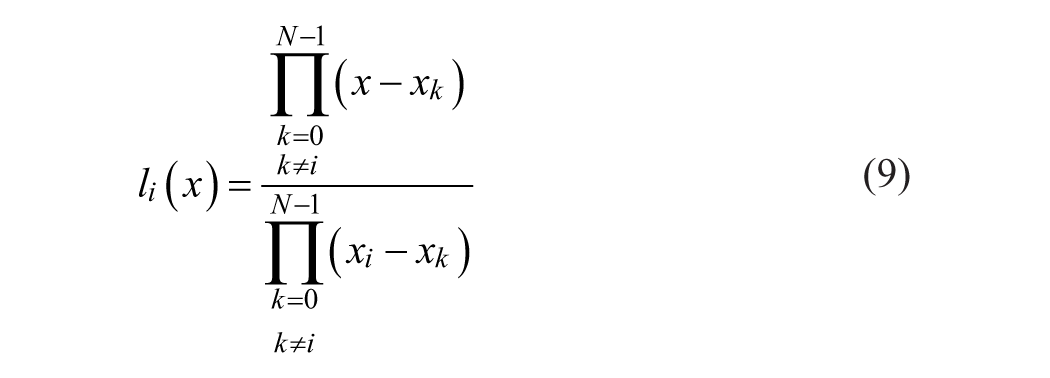
The oscillation of Lagrange polynomial is addressed as Runge (1901) phenomenon. This degrading effect can be well eliminated by repositioning sample’s nodes
To apply the proposed procedure, starting with the basic function modification in Equation 9 and rewriting it we have

where
where is

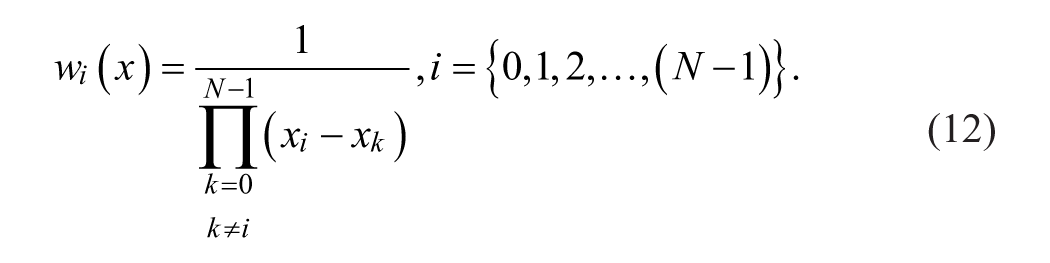
In parallel, the Barycentric weight function
Substituting Equation 10 in Equation 8 gives

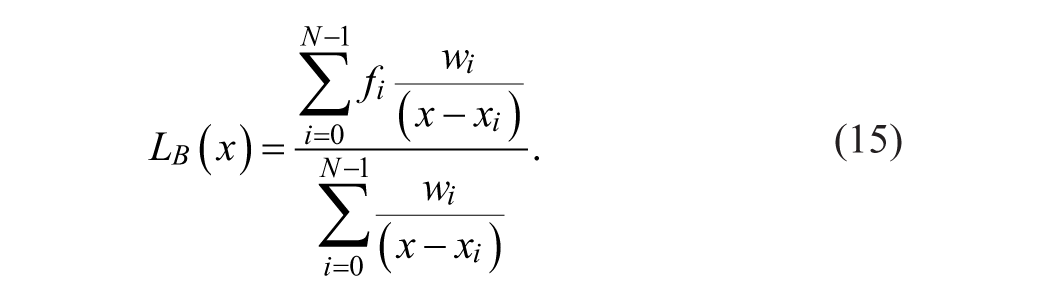
If Equation 13 is used for interpolating constant amplitudes equal to 1, then the resulted expression is

Finally, the Barycentric Lagrange interpolation (BLI) can be formulated by substituting Equation 14 into Equation 13 which leads to
This modification tackles the problem of destructive oscillations on the interval boundaries by a transformation to another domain. The transformation is possible by Chebyshev points of the second kind as

Equation 16 can be thought as a mapping scheme that transfers a uniformly spanned interval
The overall representations of the visual words, which are separated according to the three visual features, are shown in Figure 6: the upper (a), lower (b), and corner (c) visual speech signals.

The visual speech signals of the upper (a), lower (b), and corner (c) visual speech sample sets.
Regarding to the speech processing field, it is possible to select the appropriate viseme table that has been selected as the visual domain representation reference. Selecting appropriate phoneme–viseme mapping table for analysis of phonemic structure would be beneficial in deriving the practical visual speech signal expressions that are adaptable to audiovisual speech recognition systems. In other words, the method of driving visual speech signal signature could be applied to the speech recognizer system as its collaborating visual domain. The mapping scheme, which is represented in Table 3, is a sample presented that can be applied based on the manner of articulation.
The Phoneme–Viseme Table (Potamianos, Neti, Luettin, & Matthews, 2004), Phonemes are Grouped Into Viseme Classes.
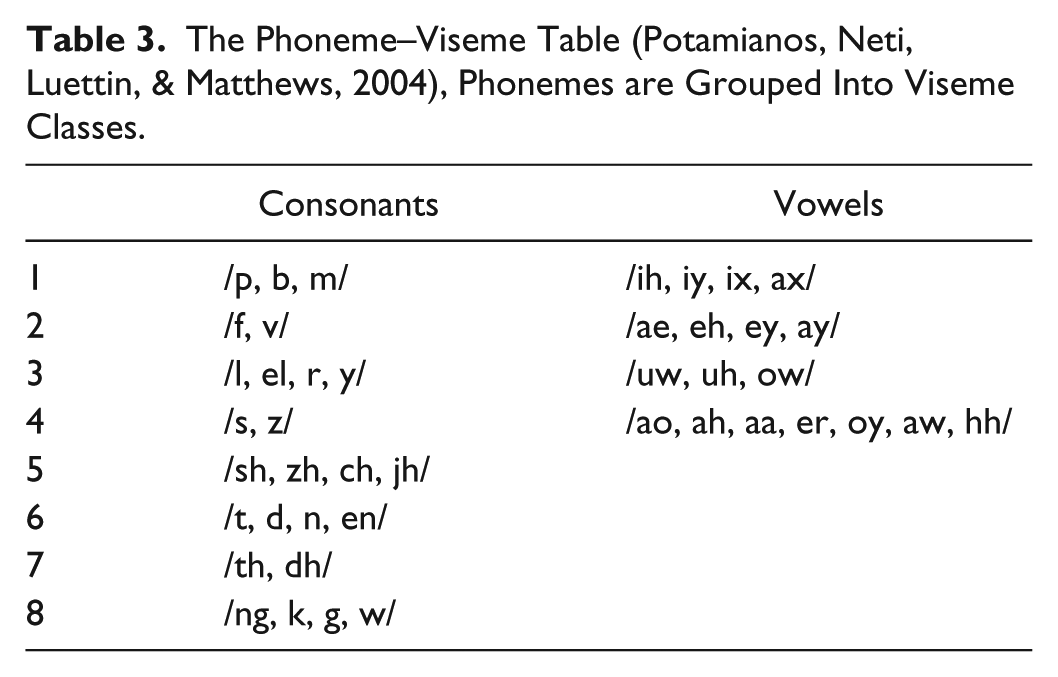
The consonants consist of eight subgroups of phonemes that have visual similarities during articulation, whereas vowels categorized into four subgroups. Although the English alphabet consists of 26 letters, there are 43 phonemes. This fact shows the difference between possible sound in words and the letters. Now it was time to find the transcribed words text that was marked according to this phonemic table (Table 3.).
Results and Discussion
In Figure 6a to 6c, the visual speech signal
The mathematical expressions of the visual speech data obtained from the upper, lower, and corner visual speech sample sets were called the visual speech signals. As it was mentioned earlier, the extracted samples from a visual feature were called visual speech sample set. Collection of three visual speech samples sets corresponding to the upper, lower, and corner visual feature points are representing a word. The first observation from Figure 6 suggests a coherence incremental pattern. It is shared with upper and lower visual speech sample sets for
Conclusion
In this article, a new method for mathematical formulation of visual speech information has been suggested. Since the concept of viseme does not provide a unique representation of visual phoneme, in addition to the unavailability of an explicit representation of the dynamics of lips during articulation of the words. The lips’ movements during articulating a specifically designed set of words were mathematically formulated in this work. The visual information is corresponding to a set of words which have the same sequence of triphones in their initial parts. The words are extracted from TIMIT database with hierarchical analysis. The mathematical expressions of the visual speech obtained from the visual features were called the visual speech signals. Normalized rational relations of visual speech sample sets were chosen for providing more compact versions of visual speech signals as well as preserving their scaling ability. Assigning a mathematical unique expression to visual speech information is a novel method to create a more precise database for words in comparison with the existing methods.
Footnotes
Declaration of Conflicting Interests
The author(s) declared no potential conflicts of interest with respect to the research, authorship, and/or publication of this article.
Funding
The author(s) received no financial support for the research and/or authorship of this article.