
Abstract
Self-regulation has become a widely discussed subject in education as it facilitates learners’ ability to master their own learning. The purpose of the present study is to examine the psychometric properties of self-regulation in second language learning via Rasch measurement. A total of 528 high-school students from an East Asian country participated in the study, and the Self-Regulating Capacity in English Language Learning (SRClang) Scale was used as a self-report instrument. The results suggest that self-regulation in second language learning as measured by the SRClang Scale does not appear to be unidimensional. Based on item-model fit statistics, several items in the SRClang Scale may need to be revised or removed. Nonetheless, the response categories in the SRClang Scale function well as intended, and the scale can reliably separate items and persons based on their difficulty levels and ability trait levels, respectively. Overall, the SRClang Scale serves as an appropriate measure of self-regulatory capacity in second language learning.
Questions concerning how people regulate their own cognitive processes have attracted an abundant amount of research for decades. Studies on self-regulation, particularly on its role in learning, have been prolific since the mid-1980s (Zimmerman, 2001). The rationale behind the increasing emphasis on the importance of self-regulated learning can be attributed to the common awareness among researchers and practitioners that learners’ self-regulatory capacity greatly enhances their performance outcomes.
Self-regulation is defined as a state of learning that involves learners’ metacognition, strategic action, and motivation to learn (Butler & Winne, 1995; Perry, Phillips, & Hutchinson, 2006; Winne & Perry, 2000; Zimmerman, 1990, 2001). Several researchers have investigated the effectiveness of self-regulated learning in various content areas, such as mathematics (De Corte, Mason, Depaepe, & Verschaffel, 2011) and science (Sinatra & Taasoobshirazi, 2011). The empirical evidence generally supports that learners who take initiatives to set realistic learning goals and subsequently achieve the goals by utilizing proper learning strategies tend to have more satisfactory performance outcomes than their peers.
Despite that self-regulated learning has been examined in numerous educational settings and has proven to be effective in facilitating learning processes, few empirical studies have been conducted in the context of second language learning. Given that self-regulatory capacity is a crucial characteristic for learners to maintain confidence and motivation even when faced with obstacles, the importance of its role in enhancing the process of second language learning becomes apparent. One of the first attempts at investigating self-regulation in second language learning is a study done by Tseng, Dörnyei, and Schmitt (2006). In their work, Tseng et al. introduced a new instrument, the Self-Regulating Capacity in Vocabulary Learning (SRCvoc) Scale, to measure second language learners’ self-regulation in the context of vocabulary learning.
The theoretical conceptualization of the SRCvoc Scale, proposed by Dörnyei (2005), is formed on the basis of Kuhl’s (1987) and Corno and Kanfer’s (1993) action and volitional control theories. Each descriptor in the SRCvoc Scale is designed to fit into one of the five categories in Dörnyei’s (2005) taxonomy of self-regulation. The categories include commitment control, which helps learners preserve their commitment to the learning goals; metacognition control, which allows learners to monitor their own learning behavior to concentrate and avoid procrastination; satiation control, which helps learners minimize boredom in learning; emotion control, which helps learners manage their emotions during the learning process; and environmental control, which allows learners to facilitate learning by putting themselves in a positive learning environment. With empirical evidence from a series of elaborate statistical analyses, the SRCvoc Scale was shown to serve as a useful instrument for the measurement of self-regulation in vocabulary learning. Tseng et al. (2006) further concluded that second language learners’ self-regulatory capacity in vocabulary learning can be attributed to all five traits outlined by the self-regulation taxonomy (i.e., commitment control, metacognition control, satiation control, emotion control, and environment control) as initially conceptualized.
While the SRCvoc Scale allows for the investigation of the underlying traits of second language learners’ self-regulatory capacity in vocabulary learning, several researchers have pointed out that the scale has not been fully “utilized and validated” in other aspects of second language learning (Mizumoto & Takeuchi, 2012, p. 84). Noting the need to further understand the role of self-regulation in second language learning in a more generalized manner, Liu (2009) adapted Tseng et al.’s (2006) SRCvoc Scale and developed the Self-Regulating Capacity in English Language Learning (SRClang) Scale, a questionnaire that can be used to collect information regarding learners’ self-regulatory capacity in their overall second language learning experience. The results in general indicated that the revised form of the SRCvoc Scale (i.e., the SRClang Scale) can be reliably applied to the context of English language learning. The detailed findings in terms of the underlying traits of self-regulation, however, differed from those shown in Tseng et al. While Tseng et al. suggested that the underlying traits of self-regulation in vocabulary learning conform to the five controls conceptualized in the scale (commitment control, metacognition control, satiation control, emotion control, and environment control), Liu found that the construct of self-regulation in the SRClang Scale only answers to one psychometric property. In other words, the underlying trait of self-regulation in second language learning appears to be unidimensional in nature.
Nevertheless, it is important to note a major limitation to the analysis conducted by Liu (2009): There was no confirmatory statistical procedure beyond exploratory factor analysis to further validate the claim of the unidimensionality of self-regulation as suggested by the SRClang Scale. In an attempt to compare factor analysis and Rasch measurement, Waugh and Chapman (2005) found that with the same sets of data, Rasch measurement suggests less certainty in score reliability and construct dimensionality than factor analysis does, calling into question the statistical inferences made from factor analysis. Given that Rasch models have been considered a confirmatory type of measurement (Christensen, 2012; Rasch, 1960, 1961) that provides rigorous evidence of dimensionality as well as item fit, the present study aims to reexamine the psychometric properties of the SRClang Scale using Rasch measurement. Specifically, item-model fit, response category use, dimensionality, appropriateness of item difficulty level for sample, and reliability measures (i.e., separation reliability and separation index) were analyzed to have a more holistic view of the underlying trait(s) of self-regulation as depicted in the SRClang Scale.
Method
Participants
A total of 528 English language learners from an East Asian country participated in the present study. Excluding the unidentified data, there were 243 males and 258 females. The participants were recruited from 15 intact 10th- and 11th-grade classes in three public high schools. All of the participants had been learning English as a foreign language as a required course for a minimum of 5 years when the present study was administered. In general, the participants’ English proficiency level as a group could be considered approximately at the B1 level of the Common European Framework of Reference for Languages (CEFR). 1
Instrument
The SRClang Scale (Liu, 2009) was used to collect the data concerning second language learners’ self-regulatory capacity in English learning. Considering that the present study was conducted in an English-as-a-foreign-language (EFL) learning context, the items were translated into the participants’ native language to avoid construct-irrelevant variables introduced by the participants’ second language proficiency (for the detailed procedure of questionnaire adaptation and translation, see Liu, 2009).
Reduced with empirical evidence from the original SRClang item bank (k = 33), the finalized form of the SRClang Scale has 27 items. A 4-point Likert-type scale of “disagree,” “slightly disagree,” “slightly agree,” and “agree” was used, and the participants were asked to check the appropriate box that best describes their English learning experiences. A summary of the SRClang Scale and its item-control taxonomy correspondence is provided in Table 1.
Summary of the SRClang Scale.

Note. SRClang = Self-Regulating Capacity in English Language Learning.
Data Coding
The participants’ responses to the items in the SRClang Scale were coded in accordance with the arranged Likert-type scale as described in the “Instrument” section. To be more specific, “disagree” was coded as 1, “slightly disagree” as 2, “slightly agree” as 3, and “agree” as 4. Items 1, 19, 20, 21, and 27 were reverse-coded due to the negative nature of the item descriptions.
Data Analysis
The Rasch model
Conventionally, the Rasch model (Rasch, 1960) is used to estimate the conditional probability that a person j endorses an item i, given the person’s ability and the item’s difficulty level for dichotomously scored items:

where P(uij = 1) indicates the probability for a person j to respond correctly to, or to be in agreement with, an item i. θ
j
is the latent trait (or ability) parameter of person j
The rating scale model (RSM)
Because the Rasch model is specifically used for dichotomous items, an extension of the Rasch model, the RSM (Andrich, 1978; Wright & Masters, 1982), is used to generalize the Rasch analysis to polytomous responses. The RSM dictates that, for the items with mi + 1 response categories, the item category response function is

where
Given that the SRClang Scale uses a 4-point Likert-type scale, the RSM is suitable for analyzing the SRClang data because both assume constant thresholds for each item, which is a common characteristic found in scales that measure personality or attitude (Lee, Grossman, & Krishnan, 2008). Such scales have two features: The relative difficulties of steps within items should remain constant (Embretson & Reise, 2000), and the psychological distances between response categories (e.g., disagree and slightly disagree, slight disagree and slightly agree) should be assumed the same for all items (Fox & Jones, 1998). The described features fit the underlying assumptions in the construction of the SRClang Scale.
The SRClang Scale was analyzed for the properties of the item-model fit, response category, adherence to the unidimensionality assumption, appropriateness of item difficulty level for the sample, and reliability. Items were reverse-coded when necessary before performing the analysis. WINSTEPS (Linacre, 2005b) was used to conduct the Rasch analysis. As the proportion of the missing data was minimal (<0.19%), WINSTEPS was able to treat the raw score and the counts of nonmissing observations as sufficient statistics and perform estimations accordingly.
Item-model fit
The item fit statistics show how well the items fit the model. To determine whether the assumption of unidimensionality of the SRClang Scale was met in the Rasch model, the values of the item fit mean square (MNSQ) statistics were calculated to investigate the extent to which each item represented the underlying construct.
The infit (weighted) and outfit (unweighted) MNSQ statistics were used to measure the fit of the items. While infit statistics are sensitive to abnormal patterns within the observations made by persons on the items that match their ability levels, outfit statistics are sensitive to outliers as well as abnormal patterns within the observations made by persons on the items that do not match their ability levels (Linacre, 2005b). Ideally, the MNSQ value in the Rasch model should be 1.0, indicating that the item fits the model perfectly. However, perfect fit does not always happen. For an RSM, researchers generally consider a range between 0.6 and 1.4 to be acceptable MNSQ values (Lee et al., 2008; Linacre, 2005a; Wright & Linacre, 1994). That is, an item would be considered misfitting if its MNSQ value falls out of this range. Items that are underfitting suggest that high levels of noise or other variance are introduced in the data; such items “may distort or degrade the measurement system” (Wright & Linacre, 1994, p. 370). However, those that are overfitting indicate that the model predicts the data too well; such items, while not degrading, are potentially problematic because they “may produce misleadingly good reliabilities and separations” (Wright & Linacre, 1994, p. 370).
Response category use
In Rasch measurement, response category use is examined via category use statistics (i.e., category frequencies, average measures) and the thresholds of each category. The average measure for each category is the empirical mean of the ability of the people who respond in that category (Linacre, 2005a). The thresholds are boundaries between categories, representing the measures where adjacent categories are equally probable. If response categories are appropriately used, that is, higher and lower categories are responded to by persons with higher and lower ability estimates, both the average measures and the thresholds should increase monotonically as the response categories ascend.
Item difficulty level
Rasch analysis produces maps of persons and items to graphically illustrate how item difficulty levels overlap with person ability trait levels. Rasch model estimates item difficulty parameters and person ability trait levels using “logits” (i.e., log-odd units), and logits “form an equal interval linear scale” (Wright, 1993, p. 288). Such features allow the two parameters to be compared at the same time for the purpose of determining whether the scale’s item difficulty matches the ability level of the person. If the item difficulty level of the scale is appropriate for the sample of persons, there would be a sufficient amount of overlap on the map when comparing the parameters of items and persons.
Reliability measures
Statistics of separation reliability and separation index for both persons and items are measures of reliability in Rasch measurement (Wright & Masters, 1982). Separation reliability estimates show the degree to which the scale is able to differentiate persons or items on the measured variables; it is the Rasch equivalent to Cronbach’s alpha for RSMs. The values of separation reliability should range between 0 and 1, with .8 or greater being acceptable (Fox & Jones, 1998). Separation index estimates show the spread of persons or items on the measured variables. The separation index provides a measure of separation in standard error units and should be at least 2 to indicate adequate separation for persons, items, or both.
Dimensionality
Rasch-residual-based principal components analysis (PCA) was performed to investigate the dimensionality of the SRClang Scale. As explained by Linacre (2005a), PCA decomposes the item correlation matrix based on standardized residuals, or the differences between the observed and the hypothesized, so that other potential dimensions may be identified. It is also considered “a standard procedure of dimensionality checking” in Rasch measurement (Chou & Wang, 2010, p. 728). For a model to be considered unidimensional, one commonly acknowledged rule of thumb is that the model needs to have a variance of at least 60% accounted for by the Rasch dimension in its first factor of the PCA (Linacre, 2005a). The second dimension, or the first contrast in the residuals, indicates whether there are any patterns in the differences within the residuals large enough to suggest multiple dimensions. To be considered a possible second dimension, the secondary dimension should have the strength of at least three items, as measured by its Eigenvalue, that represent more than 5% of the unexplained variance. Smith (2002) proposed that, for RSMs, having a first Eigenvalue greater than 1.5 is considered a violation of unidimensionality under the research condition of 500 persons and 30 items. Given that the present study has more than 500 participants and close to 30 items, it is plausible to also adopt the 1.5 Eigenvalue cutoff-point criterion in the investigation of dimensionality.
Results
Item-Model Fit
The item-model fit for the SRClang Scale was measured by infit (weighted) and outfit (unweighted) MNSQ statistics. In the initial stage of item-model fit analysis, the decision of removing misfitting items with MNSQ values larger than 1.4 for further analysis was made, as these underfitting items introduced an undesired amount of unpredictable randomness in the data and could not provide sufficiently meaningful information. Three items were identified to be underfitting: Item 1, Item 19, and Item 21. The detailed description of each misfitting item is presented in Table 2.
Descriptions and Item Fit Statistics of Items 1, 19, and 21.

Note. MNSQ = mean square.
For the analysis to be more “Rasch-compliant” (Wright & Linacre, 1994, p. 370), the three misfitting items were temporarily removed from the SRClang Scale, leaving 24 items for analysis. The remaining items were refit to the model to investigate whether their MNSQ values fell in the range of 0.6 and 1.4. This time, Items 17, 20, and 27 were found to be misfitting in the refit SRClang model; therefore, they were taken out from the SRClang Scale, leaving 21 items in the final version of the scale for subsequent analyses. Table 3 shows the descriptions of the misfitting items in the second refit model, and Table 4 presents the item-model fit statistics and the item descriptions of the remaining items.
Descriptions and Item Fit Statistics of Items 17, 20, and 27.

Note. MNSQ = mean square.
Item Fit Statistics of the Final Refit Model.

Note. MNSQ = mean square; Emo = emotion control; Env = environment control; Com = commitment control; Meta = metacognition control; Sat = satiation control.
The refit item-model fit statistics as shown in Table 4 indicate that, after removing the misfitting items, the MNSQ values of all of the remaining items were in the acceptable range of 0.6 and 1.4. The mean of the infit MNSQ value of the SRClang model is 1.00 (SD = 0.19) and that of the outfit MNSQ value is 1.01 (SD = 0.19), suggesting that in general, the items in the scale fit the model well.
Response Category Use
The SRClang Scale used a 4-point Likert-type scale. To determine whether the categories (i.e., disagree, slightly disagree, slightly agree, agree) were used as intended, diagnostics of the use of the rating scale response categories were performed.
The properties of the response categories of the SRClang scale are presented in Table 5. The frequencies in all category responses exceeded the recommended minimum number of 10 (Linacre, 1999, 2005a). As expected, the average measures and the threshold estimates both increased with the categories, indicating that they were functioning properly. Both infit and outfit MNSQ statistics for each category were between 0.8 and 1.2 (less than 2.0), suggesting that the categories provided adequate information rather than noise that would have brought misinterpretation (Linacre, 1999). Figure 1 shows the category probability curve, illustrating the probability of responding to a specific category given the differences in estimates between person trait scores and item difficulties. The threshold corresponds to the intersected points where one category probability curve meets the one for the adjacent category. The hill-shaped category probability curves show that all categories were used as intended.
Response Scale Structures for the SRClang Scale.

Note. SRClang = Self-Regulating Capacity in English Language Learning; MNSQ = mean square.

Category probability curves for the SRClang Scale.
Appropriateness of Item Difficulty Level for Sample
The map of persons and items for the SRClang Scale is shown in Figure 2. Both item difficulty level and person latent trait level are arranged from the highest to the lowest. That is, respondents with higher levels of self-regulatory capacity as well as items measuring more demanding behaviors of self-regulation are at the top of the map, whereas respondents with lower levels of self-regulatory capacity and items measuring less demanding behaviors of self-regulation are at the bottom of the map.

Map of persons and items for the SRClang response model.
Generally speaking, Figure 2 shows that the range of item difficulties appears to overlap with the person’s range of latent trait scores, suggesting that the items in the SRClang Scale were able to measure respondents with varying levels of self-regulatory capacity. Therefore, the difficulty levels of the items were mostly appropriate for the sample, and the scale was able to provide meaningful information to distinguish respondents with different levels of self-regulatory capacity. It should be noted, however, that there were a number of respondents whose trait levels were much higher or lower than any of the items could measure. The item that demands the most self-regulatory capacity, Item 11 (“When it comes to learning English, I have my special techniques to prevent procrastination”), has a difficulty value of 0.63; and the item that demands the least self-regulatory capacity, Item 3 (“When I am studying English and the learning environment becomes unsuitable, I try to sort out the problem”), has a difficulty value of −0.54. However, excluding the extreme data, the person with the highest self-regulatory capacity has an estimated ability level at 3.34 and the lowest at −3.39. The differences of the maximum and minimum values between person trait scores and item difficulties indicate that the SRClang Scale may not be able to provide sufficient information for persons at the higher and lower ends of the self-regulation continuum. In addition, several items (Items 2, 8, 9, 15, 16, 23, and 26) seem to function similarly in measuring the same level of person latent trait.
Reliability Measures
The summary of person and item reliability estimates is shown in Table 6. The value of separation reliability is expected to fall between 0 and 1, with .8 being the generally acceptable threshold. Person separation reliability estimate for the SRClang Scale was .93, indicating that the SRClang Scale can adequately differentiate individuals. The value of item separation reliability was observed to be .97, suggesting that the separation of item difficulty is highly reliable.
Person and Item Reliability Summary Statistics.

Note. This table provides summary statistics of nonextreme data. Average measure for person means average person trait score; average measure for item means average item difficulty. ZSTD = z-standardized fit statistics; RMSE = root mean square error.
The separation indices for both persons and items were greater than the 2.00 threshold, with person separation index being 3.68 and item separation index being 6.16. These values suggest adequate separation between persons as well as between items on the SRClang Scale.
Dimensionality
Because the current SRClang scale under investigation went through two modifications during the item-model fit analysis (i.e., removing three misfitting items twice), the PCA results of the original scale as well as each of the revised scales were reported to show that there were no noteworthy changes in dimensionality with the removal of the misfitting items. Table 7 provides the summary of PCA statistics of the original and the revised SRClang scales.
Summary of PCA Results.
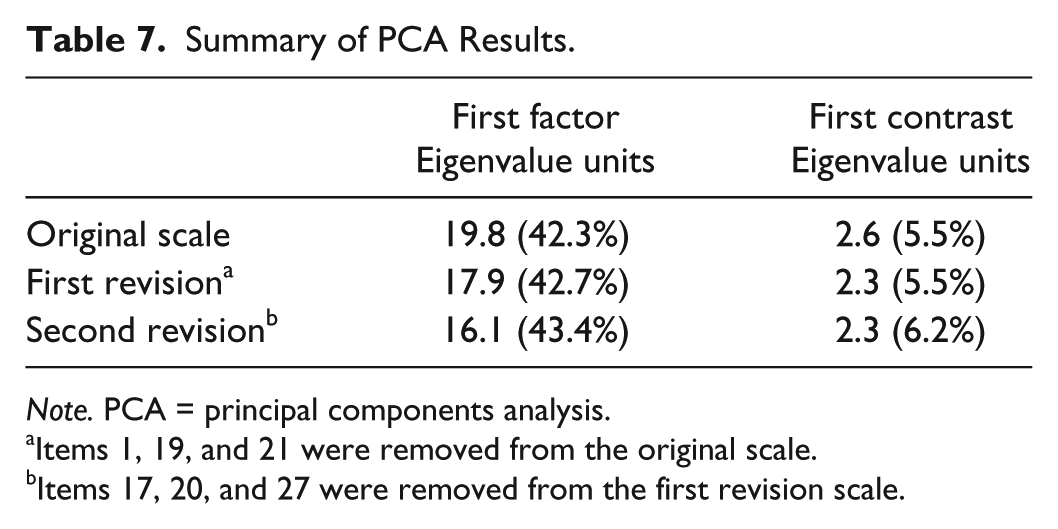
Note. PCA = principal components analysis.
Items 1, 19, and 21 were removed from the original scale.
Items 17, 20, and 27 were removed from the first revision scale.
As shown in Table 7, the variance of the SRClang Scale explained by Rasch model fell below the desired 60%, and this result was consistent across the original and the modified scales. The empirical evidence appears to suggest that removing the misfitting items did not significantly affect the dimensionality of the scale. Because the unidimensionality of the scale could not be determined by the first factor Eigenvalue, the PCA statistics of the unexplained variance were investigated. In the second revision of the scale where six misfitting items were excluded from the analysis, the first contrast of the unexplained variance had an Eigenvalue of 2.3, which is greater than the 1.5 cutoff point proposed by Smith (2002). To be more specific, the unexplained variance in the first contrast consisted of an amount that is equivalent to the weight of two to three items and accounted for 6.2% of the unmodeled data. Because the Eigenvalue of the first contrast was close to 3.0 and accounted for slightly over 5% of the variance, there was no sufficient empirical evidence to support the unidimensionality of the SRClang Scale. Figure 3 illustrates the PCA results of the final revision of the SRClang Scale. The horizontal axis (x-axis) is the Rasch dimension showing the difficulty of the items; the vertical axis (y-axis) is the factor loadings on the contrast (i.e., unexplained variance). Items with a substantial amount of unexplained variance have higher factor loadings, and thus appear on the top of the y-axis. Bond and Fox (2007) suggested that a secondary dimension may exist when the items are clustered in a clear pattern. From Figure 3, two items appear to be substantially positively correlated with the first contrast (loadings > 0.60): Item 11 (Metacognition Control) and Item 10 (Commitment Control). Another two items have substantial negative loadings with the factor: Item 23 (Emotion Control) and Item 25 (Emotion Control). This indicates that, while a secondary dimension of the SRClang Scale may exist based on PCA of Rasch residuals, its robustness and nature need further investigation.

Plot of standardized residual PCA of the revised SRClang Scale.
Discussion and Conclusion
The main purpose of this study was to investigate the psychometric properties of the SRClang Scale and to further examine the unidimensionality of self-regulation in second language learning via Rasch measurement. Specifically, the RSM was used to examine the adequacy of response category use, appropriateness of item difficulty level for the sample, reliability of person and item separation, and dimensionality.
The initial item-model fit analysis revealed several misfitting items that were unable to provide meaningful information for the model. For the purpose of maintaining the precision of the results, the misfitting items—Items 1, 17, 19, 20, 21, and 27—were excluded from the scale in the subsequent analyses.
When taking a closer look at the descriptions of the misfitting items, it is observed that the items do not belong to any specific action control taxonomy. To elaborate, each of the five action and volition controls has at least one misfitting item, suggesting that the performance of the items was not particularly affected by any specific control. However, it should be noted that, out of the six misfitting items, five of them describe negative learning behaviors: being impatient, being upset, giving up halfway, procrastinating, and being distracted. Although additional empirical data need to be collected for confirmation, it is highly possible that the negatively phrased statements do not express the intention of the descriptors well. In addition, researchers have started to recommend that social science questionnaires avoid the use of negative wording due to the fact that respondents tend to disagree with items that describe negative behaviors to be in accordance with social desire or preference (J. E. Purpura, personal communication, October 15, 2014). To make a justifiable claim of the elimination of the misfitting items from the scale, further research is needed to determine whether the misfit is caused by wording or by other construct-irrelevant variables. A plausible approach is to reword all negatively phrased descriptors into their positively phrased equivalence, and then reexamine whether the items in the revised SRClang Scale can well represent the underlying traits of each action and volitional control.
The results of the persons and items map indicate that there were respondents who demonstrated both higher and lower levels of self-regulatory capacity (person latent trait) than the items were able to measure. In the SRClang Scale, the item that describes the most demanding self-regulatory capacity in second language learning (Item 11) is related to learners’ metacognition control, whereas the item that describes the least demanding self-regulatory capacity (Item 3) belongs to learners’ environment control. However, the scale in general shows no clear pattern regarding the correspondence between the items’ difficulty levels and their control taxonomy; therefore, the nature of what makes one self-regulation behavior more demanding than another cannot be determined at this point. In addition, several items seem to be functioning in a similar manner, thus serving as repetitive measures. For example, the map shows that Items 2, 8, 9, 15, 16, 23, and 26 all measure the same person trait level, and among them, Items 8, 15, and 16 are three of the four items that describe satiation control. In other words, Items 8, 15, and 16 are likely to function so similarly that little new information could be extracted from individual items. While the current items in the SRClang Scale can appropriately differentiate learners with various levels of self-regulatory capacity, items that can measure person ability trait at both the higher and lower ends of the self-regulatory capacity continuum are needed to fulfill construct representation. Furthermore, items that function similarly should be reexamined and reduced if necessary, so that the scale can be more concise.
Liu (2009) employed exploratory factor analysis to examine the SRClang Scale, and the factor loadings indicated that self-regulation in second language learning appeared to answer to one single factor. However, the dimensionality analysis through Rasch measurement in the present study was unable to support Liu’s previous finding. The variance of the first factor in the scale did not reach the suggested 60% for the scale to be considered unidimensional. Furthermore, the unexplained variance of the first contrast accounted for slightly over 5% with an Eigenvalue of 2.3, indicating that there might be a second dimension in the model. The Rasch-residual analysis also identified four items with considerably high correlations—two positively, two negatively—with the potential second dimension. Although not all four items are under the same control taxonomy, the items seem to share a common trait of describing learners’ ability to perform strategic actions:
Item 10: When learning English, I persist until I reach the goals that I make for myself.
Item 11: When it comes to learning English, I have my special technique to prevent procrastination.
Item 23: When I feel stressed about learning English, I know how to handle the stress.
Item 25: When learning English, I know how to manage my personal emotions to make the learning efficient.
It is possible that learners’ ability to manage their own learning behaviors with strategies constitutes a second dimension of self-regulation. While such an explanation is potentially reasonable, it still needs further investigation. Both theoretical foundation and empirical evidence are required to fully understand the nature of the potential second dimension in self-regulation in second language learning.
Even though the underlying construct of self-regulation in second language learning as measured by the SRClang Scale may not be unidimensional, the dimensionality analysis in the present study only detected a possible second dimension. Such a finding suggests that the five action and volitional controls as originally conceptualized in the SRCvoc Scale (Tseng et al., 2006) may not all contribute to self-regulatory capacity in second language learning. In fact, a similar claim has been empirically supported by Mizumoto and Takeuchi’s (2012) replication study. In their study, Mizumoto and Takeuchi adapted Tseng et al.’s (2006) SRCvoc Scale and applied it to a Japanese EFL setting (i.e., Japanese students learning English as a foreign language). They found that while the SRCvoc Scale can serve as a reliable measure of self-regulatory capacity in vocabulary learning in a Japanese context, the underlying traits of self-regulation only accounted for three controls (emotion, metacognition, and environment), as opposed to the five controls proposed by Tseng et al. While Mizumoto and Takeuchi (2012) attributed the differences in the dimensions of self-regulation to “cultural differences or item parceling” (p. 90), it is likely that the underlying traits of self-regulation are more parsimonious than initially proposed. However, because Mizumoto and Takeuchi only focused on vocabulary learning instead of language learning in general, its generalizability might be restricted when it comes to determining whether there indeed exists a second dimension in the SRClang Scale, and if so, what the exact nature of self-regulation in second language learning is. Meanwhile, the SRClang Scale still demonstrates proper response category use, high reliability in item and person separation, as well as appropriate item difficulty level for the sample; therefore, it can be considered an adequate instrument.
While the present study provides further insight into the psychometric properties of self-regulation, the dimensionality of self-regulation remains a pending question. Based on the results of the present study, the unidimensionality of self-regulation indeed cannot be established. Nonetheless, the analyzed scale underwent several modifications, and wording in the scale descriptors has been identified early in the analysis process as a potential construct-irrelevant variable. In addition, although not conventionally recommended by Rasch analysts, the analysis did not compare models that differed in their dimensionality specifications. Therefore, a more complete investigation of the data would reveal whether a unidimensional model works better than a theory-informed, multidimensional one.
The study also carries several other limitations. As seen from the results, the SRClang Scale was unable to sufficiently measure learners with either higher or lower levels of self-regulatory capacity. In addition, the participants were rather homogeneous in terms of their background, resulting in the evidence being limited to this particular sample of second language learners. Based on the limitations of the present study, two directions for future research are proposed: First, there is a need to determine, from a theoretical perspective, what traits constitute more (or less) demanding self-regulation behaviors and add items accordingly to the current scale to provide more useful diagnostics for learners with extremely high or low levels of self-regulatory capacity. Second, participants with more diverse backgrounds should be recruited, so that the results can be more valid and more generalizable.
In conclusion, the SRClang Scale at its current state serves as an appropriate scale to provide diagnostic information for second language learners regarding their self-regulatory capacity in English learning. Second language teachers may use the information to provide proper assistance to students based on their self-regulatory capacity and their needs. For second language learners who wish to achieve a certain outcome by learning on their own, having a better understanding of their own self-regulatory capacity can help them monitor and evaluate their learning progress. It is also hoped that the present study contributes to the current understanding of the role self-regulation plays in second language learning.
Footnotes
Acknowledgements
The authors would like to thank the editor, Dr. Ricky Lam, and the anonymous reviewers for their insightful and extremely helpful feedback.
Declaration of Conflicting Interests
The author(s) declared no potential conflicts of interest with respect to the research, authorship, and/or publication of this article.
Funding
The author(s) received no financial support for the research and/or authorship of this article.