
Abstract
Proponents of voter photographic identification (ID) laws in the United States have argued that such measures can increase overall voter turnout. The implications of this proposition contradict classic models of voting behavior, which state that voting costs and electoral participation are inversely related. The present article/research note explores this tension in the context of some fundamental economic concepts. Namely, after identifying characteristics of a voting “market” that might facilitate the outcome in question, a simple model of that market is developed and used to simulate changes in turnout due to changes in voter ID rules for a hypothetical polity. Counter to proponents’ claims, the findings suggest that voter ID laws tend to decrease turnout, even when most voters place positive value on stricter (i.e., fraud preventing) voting regulations. That being said, the model is intentionally simplistic, and it is put forward primarily as a tool for thinking critically about the relationship between voter ID laws and electoral participation. Because data that are suited to empirical analyses of this relationship are lacking, complementary techniques, such as modeling and simulation, are useful for testing unverified hypotheses about voter ID rules from the political discourse. The simple exercises in this research note begin to fill this gap, though they function most readily as points of departure for future research.
Introduction
Backers of regulations that limit access to regular ballots for American voters who lack certain types of photographic identification (ID) have floated the idea that such increases to the cost of voting might actually increase overall voter turnout (Fund, 2013; Kobach, 2012; Larocca & Klemanski, 2011; Lott, 2006; Milyo, 2007; von Spakovsky, 2006). The implications of this proposition run counter to Downs’ (1957) seminal economic theory of democracy, which states that voting costs and electoral participation are inversely related. The present article/research note hybrid explores this tension in the context of some fundamental economic concepts. Namely, after an initial thought experiment identifies characteristics of a voting “market” that might produce the outcome in question, a simple model of that market is developed and subsequently used to simulate changes in voter turnout in a hypothetical polity due to the implementation of a so-called “voter ID” law. This exercise casts serious doubt on the ability of voter ID laws to raise turnout, even when most voters behave in ways that are the antithesis of Downs’ economically rational elector. That being said, the model is intentionally simplistic, and it is put forward primarily as a tool for thinking critically about the relationship between voter ID laws and electoral participation. Because data that are suited to empirical analyses of this relationship are lacking (Erikson & Minnite, 2009), complementary techniques, such as modeling and simulation, are useful for testing unverified hypotheses about voter ID rules from the political discourse. The simple exercises in this research note begin to fill this gap and are used to outline an agenda for future research.
Voting as an Economic Good
Before engaging with the issue of voter ID rules directly, it is helpful to start by reflecting on voting behavior in general. Influential political science literature, including the work of Downs (1957) and Riker and Ordeshook (1968), has established that casting a ballot in a democratic election is similar to an economic consumption activity. As with purchasing decisions in the microeconomic theory of the household, classic political participation theory states that an individual should vote only if the expected benefits of the activity outweigh the costs (note that both of these values are likely to be fairly low; Aldrich, 1993). Downs identifies two types of voting benefits: the utility derived from having one’s preferred candidate elected to office (B), and an intrinsic value placed on the democratic institution of voting (D). The realization of the first benefit, B, depends on one’s probability (p) of casting a decisive vote. Costs of voting (C) include, among other things, time expended on acquiring information about candidates, traveling to polling places, and satisfying ballot access requirements (e.g., Highton, 2004). That being said, an individual ought to vote only if the following inequality is satisfied:

The implication of this condition is that voting obeys the law of demand. One’s willingness to participate in an election is decreasing in price, which suggests that the market demand curve for voting is downward sloping (Perry, 2006). This economic perspective provides a useful framework in which to consider the effects of voter ID laws on electoral participation.
Voter ID Laws: Cost, Benefit, or Both?
Voter ID laws are the latest product of an ongoing tension in the United States between ensuring the right to vote for all citizens and protecting the franchise against in-person voter fraud (Atkeson, Alvarez, Hall, & Sinclair, 2014; Ellis, 2009). Proponents assert that these laws make the American electoral system less vulnerable to malfeasance, while opponents argue that they create new barriers to the polls, especially for minority and disadvantaged populations (e.g., Christensen & Schultz, 2014; Citrin, Green, & Levy, 2014). With respect to the latter of these, Rocha and Matsubayashi (2014) observe that [l]awmakers appear well aware that levels of [electoral] participation reflect, in part, the costs associated with voting. Changes to election procedures can change these costs and magnify or diminish the electoral influence of certain individuals (Berinsky 2005; Highton 2004; Larocca and Klemanski 2011; Wolfinger and Rosenstone 1980). This knowledge, real or assumed, encourages policymakers to manipulate voting systems to promote equality or reinforce existing disparities within the electorate. (p. 666)
Viewed through this lens, voter ID laws are an obvious and significant source of political conflict, insofar as they represent intentional “changes to election procedures,” which have the capacity to affect the composition and/or size of a given voter turnout universe (e.g., Hicks, McKee, Sellers, & Smith, 2014). To be sure, they have been called “the election administration story” of recent American political contests (Pitts, 2013, p. 939, emphasis in original). This story, which is fraught with hostility and inflammatory rhetoric (e.g., see Note 1 in Citrin et al., 2014), centers on two interrelated issues. First, there is the descriptive matter of “who does not possess the requisite identification under the applicable state laws” (Stewart, 2013, p. 23, emphasis added). The point in question here is whether certain classes of individuals lack approved modes of ID at higher rates than comparison groups. If this condition proves to be true, then it is claimed that voter ID laws unduly burden—that is, disparately impact—some members of the population relative to others (e.g., Citrin et al., 2014). Such a situation is self-evidently antithetical to core democratic values, namely, equality (e.g., Ellis, 2009).
As it stands, empirical evidence related to who possesses documentation sufficient to satisfy most voter ID laws is consistent in implicating “the same [general] conclusions: there are racial and income disparities in possession of identification” (Stewart, 2013, p. 25). State-sanctioned and expert-led matching of comprehensive administrative databases during federal litigation has confirmed that racial and ethnic minorities are far less likely than White persons to possess requisite forms of ID in Texas, South Carolina, Georgia, and Wisconsin (Stewart, 2013). Because the large-scale administrative databases referenced here are generally off-limits to independent researchers (Stewart, 2013), surveys and other second best data sources are needed to test or extend these results for other states and for the United States as a whole. Notably, survey-based approaches have revealed that disadvantaged (e.g., low income, low education) persons of any racial or ethnic group lack photographic ID at much higher rates than members of comparatively better-off socioeconomic classes (e.g., Barreto, Nuno, & Sanchez, 2007, 2009; Stewart, 2013). Ecological analysis of group voting behavior in a recent referendum election further shows that non-White voters were far less likely than Whites to support new voter ID measures, which intimates that such rules might disparately affect racial minorities (Weaver & Bagchi-Sen, in press). Collectively, then, received empirical research prima facie justifies concerns expressed by opponents over the potential for voter ID laws to unduly burden certain demographic and social groups. Nonetheless, descriptive tallies of ID possession within the eligible voter population are presumably insufficient to make a claim of actual discriminatory effect. Rather, and second, there is the behavioral matter of how (if) voter ID laws operate on individual and aggregate voter turnout.
To begin considering the relationship between voter ID laws and turnout, observe that the strictest ID laws require voters to present unexpired, government-issued photographic ID to poll workers prior to gaining access to a ballot (Alvarez, Bailey, & Katz, 2008). As such, the laws unequivocally increase the costs of political participation for citizens who presently lack, and therefore must expend time and resources to obtain, this type of documentation. Likewise, the laws weakly raise electoral costs for voters who already possess the necessary ID. Failing to carry ID to his or her polling place means that a given voter must cast a provisional ballot. The provisional ballot is then only counted if the voter presents acceptable ID to elections officials within a certain number of days after the election. This places additional time, effort, and travel burdens on the given voter (Hershey, 2009). The economic view of voting therefore suggests that a logical consequence of voter ID laws is lower turnout (e.g., Downs, 1957). After all, the demand curve for voting is downward sloping (Perry, 2006), and ID laws increase the price of successfully casting a ballot (Hershey, 2009). That being said, von Spakovsky (2006) and others (e.g., Fund, 2013; Lott, 2006) argue that the tighter regulations have another important function. In particular, they increase confidence in the democratic system. Hence, increasing voting costs directly affects voting benefits. Voter ID proponents argue that the magnitude of this latter effect is greater than the former. As such, the claim is made that voter ID laws can lead to higher overall turnout (Fund, 2013; Lott, 2006; Milyo, 2007).
Unlike for the foregoing “who possesses ID” question (see Stewart, 2013, p. 25), empirical evidence for the present “turnout” question does not point to a relatively general, consensual conclusion (e.g., Christensen & Schultz, 2014). To the contrary, some studies find that voter ID laws have a depressive, albeit small, effect on political participation (Alvarez et al., 2008, 2011; Stewart, 2013); others find that simply lacking requisite ID significantly reduces turnout (Hood & Bullock, 2008); still others find no or statistically insignificant turnout effects from voter ID laws (Erikson & Minnite, 2009; Rocha & Matsubayashi, 2014); at least one finds that voter ID laws have an unexplained positive influence on turnout (Larocca & Klemanski, 2011); and yet another, in line with the pro-voter ID argument from the preceding paragraph, “purports to show that voter ID laws can boost turnout by promoting confidence in the integrity of the electoral system (Lott, 2006)” (quotation from Citrin et al., 2014, p. 229). In that context, the current state of this literature is decidedly mixed (Atkeson et al., 2014; Christensen & Schultz, 2014; Citrin et al., 2014). While this outcome is perhaps a reflection of the heterogeneity in the states, elections, and data sources that have been probed to date (e.g., Stewart, 2013), the inconclusive nature of these empirical findings is almost certainly a function of statistical issues. As noted by Erikson and Minnite (2009), [turnout effects from voter ID laws] may be there. By all tests there is nothing to suggest otherwise. But the data are not up to the task of making a compelling statistical argument . . . the existing science regarding vote suppression [via voter ID laws] is incomplete and inconclusive. This is not because of any reason to doubt the suppression effect but rather because the data . . . do not allow a conclusive test. (p. 98)
The data issues referenced in this passage are well known. Simply put, American voters have the right to a private ballot, and privacy laws render “independent academic research in this area . . . virtually impossible” (Stewart, 2013, p. 24). As a consequence, researchers interested in the turnout effects of voter ID laws are typically forced to rely on cross-sectional, and sometimes small sample, survey data (Stewart, 2013). This constraint leads to the production of statistically imprecise estimates and, by extension, the sort of mixed and inconclusive empirical results described above (Erikson & Minnite, 2009). Accordingly, supplementary strategies for analyzing the relationship between voter ID laws and turnout are valuable contributions to the literature. Toward that end, it is reasonable that modeling and simulation can enable researchers to test turnout hypotheses (in the abstract) that are put forward by key actors from the voter ID discourse. To explore this possibility, the remaining sections grapple with the earlier claims that ID laws boost voter confidence and the desire to vote, and therefore increase overall turnout (e.g., Fund, 2013; Lott, 2006; von Spakovsky, 2006). Because the logic of this hypothesis departs from conventional economic theories of voting behavior (e.g., Downs, 1957), it is important to revisit the economics of political participation and answer the following question: If stricter ID rules in fact increase voter confidence and voting demand, then what are the economic properties of voting?
Is the Market Demand Curve for Voting Upward Sloping?
Consider again the voting decision inequality from Equation 1, but now think of it as an equation where V represents the net benefit of voting, and where the probability of casting a decisive vote (p) is small enough that it can be treated as zero (e.g., Harder & Krosnick, 2008). Under these assumptions, the term pB drops out of the equation:

For values of V greater than zero, a voter ought to vote. Once again, then, the desire to vote is decreasing in price (C). It is also increasing in voter confidence, or the value of democratic integrity (D). If raising the price of voting by requiring potential electors to first produce government-issued photographic ID also raises confidence, then D must be an increasing function of C, at least over a range of values. In plainer language, increasing the (own) price of voting induces more voting. The implication is that the demand curve for voting can be upward sloping, which violates the law of demand (Mankiw, 2001). As a result, claims that voter ID laws will lead to greater overall turnout are incompatible with Downs’ (1957) economic theory of voting. This compels a search for alternative explanations.
Voting as a Giffen Good?
Spiegel (1994) defines a Giffen good as a special type of commodity for which relative decreases in the good’s own-price generate such powerful income effects that consumers consequently demand less of it, thus causing its demand curve to slope upward. An implication of this relationship is that as the price of a Giffen good increases, so does its quantity demanded (Mankiw, 2001). If the demand curve for voting is upward sloping, as is intimated by the aforementioned pro-voter ID arguments, then is the activity a Giffen good?
To answer this question affirmatively, it must be true that voting is an inferior good (Mankiw, 2001) such that when individuals have more resources available for voting, they are less inclined to vote (perhaps because they consume more leisure). Even without introducing the second necessary condition for voting to be Giffen—that is, that more voters cast ballots when the price of voting relative to leisure rises—one can surmise that this is an unlikely explanation for an upward-sloping voting demand curve. A preponderance of empirical evidence shows that political participation increases as one’s level of personal resources (e.g., wealth) increases, which strongly implies that voting is a normal good (Nevitte et al., 2000). This point is relatively well established in the literature (e.g., Highton & Wolfinger, 2001). Hence, the Giffen explanation is easy to dismiss.
Voting as a Veblen Good?
Another possibility is that voting is a Veblen good. Leibenstein (1950) describes the “Veblen effect” in terms of behavior referred to as “conspicuous consumption,” whereby the utility that one derives from consuming a product is an increasing function of both the attributes of the good and the price paid for it. That is, some consumers willingly purchase Veblen goods at higher prices, meaning that the demand curves for such commodities can slope upward.
Coelho and McClure (1993) note that Veblen behavior is sometimes associated with the marketing concept of “prestige pricing.” Quite simply, for certain goods, consumers adopt the logic that higher price equals higher quality. Furthermore, some consumers gain satisfaction from showcasing their purchases of high-price/high-quality designer goods (e.g., Knox, 2011). Thus, by buying prestige items at inflated prices, consumers intentionally signal their relatively high social statuses to others in the community.
In this regard, it is suspect to think that a phenomenon of “conspicuous voting” would create an overall positive relationship between participation costs and turnout. Explicitly, whereas some voters do proudly declare their intentions to vote in a given election, many others treat the activity as a private matter. Nonetheless, even if conspicuous consumption does not adequately describe the aggregate voting demand curve, the prestige rationale remains relevant. Specifically, it is plausible that voters collectively infer high quality from high price. If the idea of “quality” in voting captures the concepts of electoral integrity and confidence in democratic institutions, and if quality is directly linked to price, then it is conceivable that some erstwhile non-participants will enter the voting market at higher prices.
Does That Make Voting a Veblen Good?
Granting that some voters probably display Veblen behavior, and vote only when the cost of doing so is sufficiently high, it is difficult to imagine that the voting market as a whole is characterized by a prestige-type demand structure. For instance, Hershey (2009) discusses ample evidence to suggest that higher voting costs of any form depress overall turnout (see also Harder & Krosnick, 2008; Highton, 2004). In light of this, a more likely scenario is that the voting market contains a mix of individuals, some who view the activity as a prestige good and consume more of it at higher prices, and some who view it as a normal good and consume less of it at higher prices. These insights allow for the coding of a simple model to explore how a market with both Veblen-type and non-Veblen-type voters might respond to the introduction of a new, comparatively obstructive ballot access rule like voter ID requirements. As suggested above, the model is not proffered as a mirror of reality or a tool for predicting the precise turnout effects of voter ID laws in a complex polity. It is merely a means for concretizing the foregoing thought experiment, and, in the process, exploring voting dynamics under a given (restrictive) set of assumptions, to challenge the claim that voter ID laws can positively affect aggregate electoral participation (e.g., Lott, 2006; von Spakovsky, 2006). In this sense, it serves as both an invitation for debate and a call for more scholarly research on the relationship between voter ID laws and turnout, for the purpose of building a sturdier knowledgebase on which to [not] take further legislative action toward such regulations.
A Simple Model of the Working Voting Market
Baseline (Null) Model
So far, a working verbal model of the voting market has classified voters into two general types: (a) Veblen types, whose probability of voting rises when the price of voting goes up, and (b) non-Veblen types, who behave more like Downs’ (1957) economically rational elector. Suppose that the latter non-Veblen class of voters can be further subdivided into those persons who possess requisite ID for voting under a voter ID law and those who do not. Given these assumptions, the working model now includes three classes of agents.
Assume that a total of N representatives from the three agent classes are randomly assorted in an isotropic space that houses k polling stations and l institutional locations where agents may, if necessary, obtain an ID document that has been approved for voting under a voter ID law (e.g., a county Department of Motor Vehicles office). Next, let all agents in the hypothetical polity exhibit a null voting behavior consistent with Equation 2, which is repeated for convenience:

Again, V is the net benefit that an agent receives from the act of voting, where D is the value placed on voting and C is the cost of casting a ballot. If V is positive for a given agent during a given election, then that agent will (presumably) participate in that election.
In the hypothetical polity described above, suppose that all agents place some non-negative, intrinsic value on voting, such that D is a random variable that takes a floating point value between 0 and 1. Furthermore, assume that under the null condition of no voter ID regulations, the only cost associated with voting concerns a potential voter’s (in)accessibility to the polls. Although the construct of “accessibility” to polls contains many dimensions—for example, access to transportation, information about candidates, knowledge of registration processes, and so on (e.g., Ellis, 2009; Harder and Krosnick, 2008; Highton, 2004)—to keep things simple, it is defined here as a function of the spatial distance between an agent and the nearest polling station. More specifically, cost is calculated as an index of absolute distance to a polling station, such that for any given agent,

where
Adding a Voter ID Rule to the Model
With the above details in place, the null model can be expanded to consider how a new voter ID law might affect each of the three aforementioned classes of voters. In the first place, recall that changing ballot access rules to require certain types of photographic ID weakly raises costs for all voters. Under such a regime, voters must take added precautions to carry ID to polling stations; otherwise, they are required to cast provisional ballots, and thereafter to travel to elections offices to show valid proofs of identity (Hershey, 2009). To the extent that this effect applies to all voters, it is incorporated into the null model by adding a constant, c, to all agents’ cost functions (Table 1).
A Simple Model of Voting Behavior Under the Null and Voter ID Rules.

Note. ID = identification.
This calculation considers only distances between non-Veblen-type voters without ID and ID-providing facilities.
Consider next the effects that voter ID laws are assumed to have on the intrinsic value, D, placed on voting by Veblen-type voters. For a given Veblen type, the legislative act of adding c to the cost functions of all voters translates into a higher value of D (see above). For parsimony, this benefit is modeled using a multiplier, v, such that the product of v and c is added to each Veblen voter’s value of D under a voter ID law (Table 1).
Finally, for any non-Veblen-type voter who lacks an approved form of ID, a new voter ID rule raises the cost of voting by sufficiently more than the “weak” effect that is captured in c (Hershey, 2009). In the hypothetical polity, suppose that this added cost is a function of round trip distance to and from the nearest ID-providing institution. It can then be operationalized in a manner analogous to the cost function described in Equation 3 (Table 1).
Simulating Voting Market Outcomes in the Simple World
Spatializing the Voting Market
The equations from Table 1 define voting behavior for agents in a hypothetical polity; however, to this point, the polity has been trapped in a verbal model. To move from verbal description to something more formal, the NetLogo modeling environment (Wilensky, 1999) is used to spatialize the simple voting market into a rectangular isotropic territory, the dimensions of which (67 columns and 33 rows with a pixel size of 13) were chosen somewhat subjectively to fit neatly on the author’s 1,366 × 768 laptop screen resolution (Figure 1).

The simple model represented in NetLogo.
NetLogo is typically associated with modeling complex systems that develop over time (Wilensky, 1999). However, one of its more general features is an interactive (end) user interface that allows diverse audiences to explore behavioral outcomes under different scenarios. In the present context, such an environment is useful for simulating changes in turnout under different assumptions about the composition of the rectangular polity’s voting market—that is, different mixes of Veblen types, non-Veblen types with ID, and non-Veblen types without ID. With that in mind, a NetLogo model is coded to allow users to control the values of five important parameters: (a) the number of voters from each of the three agent classes; (b) the number of polling stations located in the isotropic space; (c) the number of ID-providing institutions in the polity; (d) the weak cost increase, c, that applies to all voters under a voter ID rule (Table 1); and (e) the “Veblen multiplier,” v, that is multiplied by c and added to the value placed on voting by Veblen-type voters (Figure 1).
Figure 1 shows an overview of the model’s user interface (see Appendix A for the source code). In the center of the figure is the rectangular isotropic polity. Within that space are various agents. The triangular agents (called “turtles” in NetLogo) represent voters. Voter-agents are color coded by type: Green represents Veblen type, red represents non-Veblen type with ID, and blue represents non-Veblen type without ID. The square agents (“patches”) are traversable spaces, some of which contain voting-related institutions. Each yellow patch contains a polling station, and each white patch contains an ID-providing agency such as a Department of Motor Vehicles. The remaining black patches contain neither of these institutions.
Choosing Parameter Values and Running the Model
To the left of the polity “map” in Figure 1 are a number of user-controlled options. The sliders allow users to manipulate the parameters enumerated above. The button at the top-left configures the polity, which is to say that it randomly locates all agent types (both turtles and patches) in the given space. The top-right button then computes turnout in the null and voter ID models for the randomly located agents, based on the equations in Table 1. Selected results from that computation are displayed in “monitors” to the right of the polity map. In the example shown in the figure, five polling stations and two ID-providing institutions serve 500 total voters. Of the 500 voters, 445 (89%) have ID. Twenty-five percent of those 445 voters are Veblen types. The 11% of all voters (55) who lack photo ID are non-Veblen types. The value for c (the cost added to all voters’ cost functions under voter ID) is set to a negligible value of 0.01. The “Veblen multiplier” is set to 10, meaning that each Veblen voter receives 10 times the added cost (c) of voting as an individual benefit.
These example numbers are not completely without purpose. The Brennan Center for Justice (2006), for instance, estimates that approximately 11% of eligible Americans lack the documentation required by most voter ID laws. In addition, U.S. states regularly cap voter-to-polling-station ratios, and lower ratios often fall somewhere between 175 and 400. 1 Specifying five polling stations for 500 voters is therefore a very low ratio, which can positively affect turnout (e.g., Gimpel & Schuknecht, 2003). Likewise the 1-to-250 mapping of voters to ID providers is assumed to be a generous allocation relative to reality. That being said, the results for the example situation (Figure 1) still show a decrease in turnout when the polity moves from the null to the voter ID rules. Null turnout was 58.2%—which, incidentally, is nearly identical to known turnout for recent U.S. Presidential elections (Highton & Wolfinger, 2001; McDonald, n.d.)—and dropped by 3 points (to 55.2%) under the voter ID rule. This small drop in turnout is highly consistent with real-world observations based on the (imprecise) estimates derived from the (typically surveyed) data sources discussed above (see Stewart, 2013). The reduction in this case is driven by a large decrease in turnout among voters without ID, from 32 such voters down to 5, as well as a marginal decrease in turnout among non-Veblen types who have ID (<1 percentage point).
Although this result supports earlier doubts about the ability of voter ID laws to increase turnout, keep in mind that this is a singular outcome for one random assortment of agents in the simple voting market. Thus, the numbers shown in Figure 1 are not of much interest here. Rather, to add more depth to the analysis, it is worthwhile to simulate the model for a variety of assortments and for different combinations of voter-agents in the market.
Iterating the Procedures: Simulations and Results
The preceding section unpacked all but two elements from Figure 1. The remaining pair of features is located at the bottom left of the figure and deals with iterating the setup and turnout calculation procedures discussed above. The first element, an input box, allows a user to set the number of desired iterations (n) for Monte Carlo simulations of turnout given the user-specified parameter values. When clicked, the second feature, an associated button, runs the model n times for n random spatial assortments of agents. The null and voter ID turnout values are then printed to a dialogue box in NetLogo, wherefrom they can be exported to a text file for post-processing. Depending on the desired output, post-processing might include calculating the first differences in turnout between the null and voter ID scenarios (for each iteration), and graphing the resultant distribution to look for significant differences. This strategy is adopted below for four different voting market scenarios (see Appendix B).
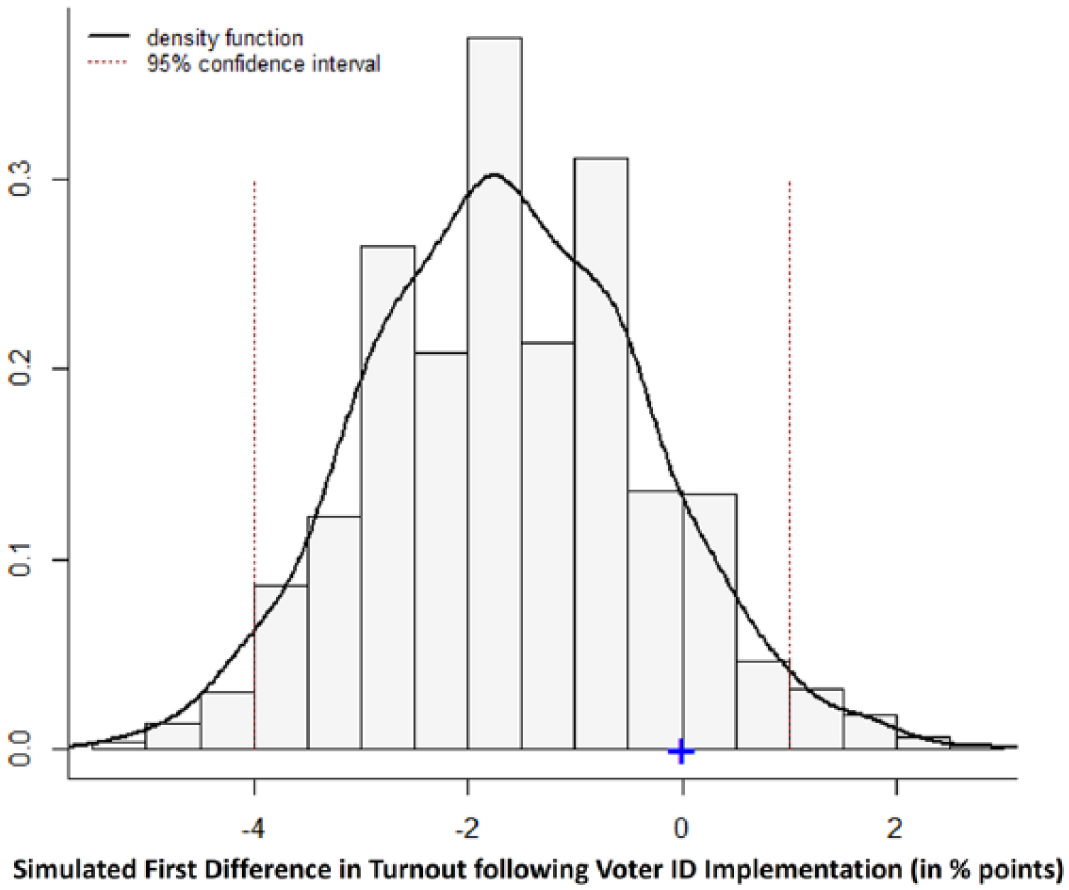
Extending the one-shot example from Figure 1, the total number of voters (500), polling stations (five), and ID-providing institutions (two) are held constant for the present exercise, as are the values for c (0.01), v (10 × c), and the share of the electorate without ID (11%). What changes from scenario to scenario is the composition of the remaining voting market. In Scenario 1, zero of the voters who possess photo ID are assigned a Veblen type. Scenarios 2 to 4 assign a Veblen type to 25%, 51%, and 57% of these voters, respectively. The first choice is arbitrary and intended only to model a market with “some” Veblen-type voters. The next choice is more meaningful and describes a state of affairs wherein Veblen-type voters constitute a simple majority of all voters who have proper ID. The final choice (57%) takes this even further, as it models a situation in which Veblen-type voters hold a majority over all voters in the market (i.e., 0.57 × 445 = 254 and 254/500 = 51%). It is hypothesized that simulating Scenarios 1 and 2 will result in significant decreases in turnout when moving from the null to the voter ID rules, given the minority of Veblen types in the market. By contrast, it is possible that Scenarios 3 and 4 will produce upticks in turnout due to the sufficiently numerous Veblen-type populations in the respective markets. Yet, notwithstanding this possibility, it is hypothesized that such outcomes will not manifest, insofar as such voters still face access-related costs (represented here with spatial distance) that might not be offset by the intrinsic benefits received from the new voter ID rule.
Each of the four scenarios is evaluated for n = 1,000 simulation trials, which correspond to 1,000 different spatial arrangements of agents for each scenario. The output of each simulation exercise is therefore a distribution of turnout under null and voter ID voting rules. This output is converted into a distribution of first differences between the two turnout values for each scenario (see Appendix B). Table 2 summarizes the output for all four scenarios, and Figures 2 through 5 graph the associated distributions of first differences.
Summary Output of the Example Simulations.


Distribution of first differences, Scenario 1.

Distribution of first differences, Scenario 2.

Distribution of first differences, Scenario 3.
Distribution of first differences, Scenario 4.
Observe first that mean turnout under the null set of conditions is uniform across the four scenarios (Table 2). This is to be expected, given the assumptions that were made in Table 1 and the random process that is driving the spatial assortment of agents. What is more interesting, then, are the simulated turnout values under the voter ID rule. Notably, overall turnout declines across the board following the rule change, including in Scenario 4 where Veblen-type voters are a majority of the aggregate voting market. These changes are statistically significant in Scenarios 1 through 3 (highly so in Scenarios 1 and 2), which suggests that the voter ID rule negatively affects turnout in markets where voting is treated mostly as a “normal” economic good (e.g., Downs, 1957). The finding from Scenario 4 further shows that the ID rule fails to significantly influence turnout (positively or negatively), even when Veblen-type voters outnumber all other voter types in the market. Whether this holds for a voting market with a supermajority of Veblen types is a question for future applications of the model.
All of these findings, of course, come with the disclaimer that they are derived from a simplifying set of assumptions and a single user’s—the author’s—choices for values of the input parameters. That being said, the admittedly abstract model is intended only to stimulate discussion. It is not proffered as a complete accounting of voting economics, nor does it adequately capture the complexity of real-world voting dynamics. Instead, its utility lies in its subjection of an unverified, politically consequential claim—that introducing new voting costs through tighter regulations can increase aggregate electoral participation—to another layer of critical analysis. Toward this end, the model will be freely available (and open source) at the NetLogo Modeling Commons, 2 so that readers, whether proponents or opponents of voter ID laws, can tweak the input values, build extensions, and otherwise explore its implications under alternative and diverse sets of circumstances. The final section draws on the foregoing (example) findings to offer ideas and insights meant to support and inform such efforts.
Conclusions and Limitations
The aggressive move toward tighter voting regulations taking place in the United States, which reached a high point with respect to the number of voter ID laws enacted during the 2011 legislative session (Kobach, 2012), appears to be an uncapacitated source of both fuel and fire in the political discourse. In the context of historical (legally sanctioned and otherwise) manipulation of direct and indirect voting costs to dissuade certain types of American voters from electoral participation (e.g., Davidson, 2009), it is not surprising that recent efforts to shield the franchise from individuals who do not meet a contemporary “bright line” test—possessing approved forms of photographic ID—have generated controversy (Ellis, 2009, p. 1055). At the same time, there is a critical shortage of empirical evidence available to ground this debate (Erikson & Minnite, 2009; Hershey, 2009). Consequently, unsubstantiated claims have entered into the discourse and have evidently influenced public opinion (see, for example, Fund, 2013; Kobach, 2012).
One such claim is that implementing voter ID laws has the potential to increase overall voter turnout (e.g., Lott 2006; Milyo, 2007; von Spakovsky, 2006). Because this proposition does not follow from established theories of voting behavior (Downs, 1957; Highton, 2004; Riker & Ordeshook, 1968), it is important to subject it to as many forms of critical analysis as possible, before it exerts further influence on public policy and public opinion. In that regard, the present research note/article drew upon foundational economic concepts to work through a thought experiment that ended in a verbal model of a voting market that might be amenable to the outcome in question. The verbal model was then formalized with the help of additional simplifying assumptions and converted into an open source, interactive NetLogo model. Simulating turnout for four voting markets in a hypothetical polity revealed that introducing new ballot access requirements (voter ID rules) into an existing electoral system significantly reduces electoral participation when most voters treat voting as a “normal” economic good. Moreover, even when this is not the case and so-called Veblen-type voters have a majority in the voting market, ID laws still fail to raise turnout in any of the example scenarios.
Along these lines, the model offers several valuable, but qualified, insights—again, the major qualification being that the model is abstract and simulated for specific parameter values. In the first place, even negligible, indirect increases to the cost of voting have the propensity to decrease participation (see Highton, 2004). From the example, a sufficiently small constant representing the “weak” cost borne by all voters under new ID laws (Hershey, 2009) effectively prices some ID-possessing, non-Veblen types out of the market (Figure 1). Such a phenomenon is quite challenging, if not impossible, to observe and accurately model. The use of a universal constant is undoubtedly a departure from reality; but, as in all cases of formalizing verbal models of complex systems, one must start somewhere (Turchin, 2003). That being said, identifying alternative approaches to modeling this effect will add significant value to the present work. One possible starting point for such efforts might be to identify voters who cast provisional ballots in an election of interest for reasons of insufficient ID (e.g., Pitts, 2008). A survey could then be administered to a stratified sample of individuals made up of members of this group and other relevant subgroups from the eligible voter population, to collect data on person-specific perceptions of voting costs using a standard scale. Some combination of averaging and extrapolation, and/or multivariate statistical analysis of these data might reveal more appropriate ways to operationalize the weak cost parameter.
Second, institutional allocation is meaningful. Consistent with political science scholarship (Gimpel & Schuknecht, 2003), when polling stations are more accessible—in the simple model, this likely means more numerous—voting costs are effectively reduced. It follows that siting accessible polling locations might produce higher turnout. By extension, increasing accessibility to ID-providing institutions might, through lowering the effective costs of obtaining requisite documentation, mitigate the decline in turnout observed for non-Veblen-type voters who lack ID. Crucially, accessibility in the simple model is proxied by distance to the nearest institutions in isotropic space. A valuable avenue for future research is to incorporate additional social dimensions of accessibility into the model, including, for instance, access to information, transportation, and leisure time.
Third, “space” matters. As is the case in much of social science, neglecting spatialities can lead to faulty inferences. Illustratively, one might draw a conclusion from the earlier verbal model that a voting market in which Veblen types simply outnumber non-Veblen types will exhibit an upward-sloping demand curve; that is, voter ID laws will inevitably increase aggregate turnout in such environments. When spatial arrangements and spatially based costs are factored into the model, however, this conclusion does not hold. Indeed, there is a tendency for turnout to decrease even when Veblen types have a majority share of the voting market (Scenario 4). An important extension to this project would be to treat space with greater sophistication. The hypothetical, rectangular, homogeneous polity of randomly assorted agents is a convenient simplification for the purposes of this note. However, future work is needed to move beyond simplification and to model both spatial heterogeneity and more realistic agent sorting processes.
Finally, there is no shortage of scholarly interest in the relationship between voter ID laws and electoral participation (refer to the research surveyed above). Nevertheless, given the recency and pace of the movement toward voter ID laws in the United States (e.g., Kobach, 2012), as well as the inadequacy of available data sets (Erikson & Minnite, 2009), the literature is still lacking in definitive empirical content (e.g., Christensen & Schultz, 2014; Citrin et al., 2014; Hershey, 2009; Stewart, 2013). This deficiency of evidence for (against) the supposed virtues (harms) of voter ID laws suggests approaching these regulations with caution. Until researchers are capable of isolating causal relationships between new voting regulations and turnout, scholars and policy makers will do well to subject unsubstantiated claims to as many levels of critical analysis as possible. Modeling and simulation appear to offer one means for accomplishing this type of research. In particular, the exercises presented hereinbefore, while necessarily abstract, cast serious doubts on the ability of voter ID laws to increase overall electoral participation. The simulation results ostensibly shift responsibility for empirically or experimentally verifying the pro-voter ID hypothesis from above to the actors and institutions who assert its validity. On that note, a promising and complementary arena for testing the sort of hypotheses considered above is experimental economics, namely, behavioral game theory (e.g., Camerer, 2003). Emerging experimental results are demonstrating that even minor increases to voting costs (from two cents to seven cents) significantly decrease turnout in voting games played by university students (Blackwell & Calcagno, 2014). Feasibly, similar experimental procedures can be applied to more representative samples of the eligible voter universe to (a) ascertain causal relationships between voting rules and electoral participation, (b) develop more realistic models of agent voting behavior, and (c) estimate the proportion of (for instance) Veblen-type voters in the overall population. With that information available to researchers, higher precision and more reliable models can be created to simulate voter turnout under a wider range of scenarios and proposed rule changes. Future research in these areas is therefore strongly encouraged.
Footnotes
Appendix A
Appendix B
Declaration of Conflicting Interests
The author(s) declared no potential conflicts of interest with respect to the research, authorship, and/or publication of this article.
Funding
The author(s) received no financial support for the research and/or authorship of this article.