
Abstract
This article contains a description of the structure, the software and functional capabilities, and the scope and purposes of application of the Group Profile (GP) computer technique. This technique rests on a conceptual basis (the microgroup theory), includes 16 new and modified questionnaires, and a unique algorithm, tied to the questionnaires, for identification of informal groups. The GP yields a wide range of data about the group as a whole (47 indices), each informal group (43 indices), and each group member (16 indices). The GP technique can be used to study different types of groups: production (work groups, design teams, military units, etc.), academic (school classes, student groups), and sports.
Keywords
Small groups play an important role in the life activities of the society, an organization, or an individual. Thus, work groups are the mainstay component of the social/economic and production/technological structure of an organization, and subjects of the production and management process. They ensure, for their members, the achievement of their individual objectives and satisfaction of their needs, the professional and social training, and the sense of security with regard to the environment. Therefore, small groups are of special interest to the researchers and practical specialists in psychology (social/organizational, military, pedagogical, etc.), sociology, economics, pedagogy, and so on. In recent years, the transition tendency from interdisciplinary separation to multidisciplinary linkages in the field of small groups amplified. It was substantially initiated by some special researches (e.g., Hogg, Abrams, Otten, & Hincle, 2004; Poole, Holinngshead, McGrath, Moreland, & Ronrbaugh, 2004).
Successful solution of many scientific and practical problem related to small groups depends on the tools available. Their importance grows when the accumulated experience must be reviewed, and new theoretical approaches must be formulated and tested by empirical studies. Over the period of study of small groups a multitude of experimental observation schemes and algorithms, methods and questionnaires. As far as questionnaires are concerned, some of these were developed on a conceptual basis, whereas others use narrow empirical predictors to tackle particular applied tasks. For example, the Group Environment Questionnaire was developed in accordance with the four-factor group cohesion model (Carron et al., 2003; Widmeyer, Brawley, & Carron, 1985), and the Perceived Cohesion Scale is based on a two-factor model (Bollen & Hoyle, 1990). Interpersonal conflicts in work groups have been traditionally perceived as multidimensional constructs. The widely popular two-factor model includes two types of conflict (sometimes differently designated): the task conflict and the relationship conflict (e.g., Jehn, 1995; Medina, Munduate, Dorado, Martı′nez, & Guerra, 2005; Yang & Mossholder, 2004). In addition to the task conflict and the relationship conflict, some authors identify the process conflict (Jehn, 1997; Jehn, Greer, Levine, & Szulanksi, 2008). The Intragroup Conflict Scale (Jehn, 1995) has been widely used to study the types of conflict. In its original version, this scale contained two subscales (the relationship conflict and the task conflict). This technique was then expanded by adding the process conflict subscale (Jehn, 1997), and 10 years later, the whole scale was reworked to exclude the emotional terms (Jehn et al., 2008). Bouas, Arrow, and Carini (1999) have proposed the idea that the group identification has three sources: cognitive (social categorization), affective (interpersonal attraction), and behavioral (interdependence). They used the Arrow–Carini Group Identification Scale 2.0 (Henry, Arrow, & Carini, 1998), which corresponds to their theoretical definition of the construct and reflects the proposed sources of group identification. The main problem is that many questionnaires designed for the study of the same or different group phenomena (cohesion, trust, conflicts, etc.) were elaborated outside any single conceptual framework. The diversity of questionnaires with different contents presents a motley and often contradictory picture. This precludes a comprehensive approach to the complex study of small groups, and prevents a reasonable analysis of the interrelations of various phenomena emerging in a small group.
At the current stage of development of the computer hardware and information technologies, there is a growing need for the appropriate tools to study small groups. Thus, sign models are being developed on the basis of computer simulation (imitation). Mathematical models are intended, above all, for formalized imitation of a group self-organization, by means of recreation of the sequence of actions of an individual or a group, and determination of the values of the coevolution variables. Most representative of this class of models are cellular automata (Brunner & Tschacher, 1991; Latané, 1996; Nowak, Szamrej, & Latané, 1990), which imitate the interrelations of units (individuals) and their influence on one another over a certain time, and a complex establishment of group structures. Simulation of a group self-organization is used to study the problem of the effect of the formal signs (the population size, the possibility of contacts, and the degree of the population elements diversity) on the group’s dynamics (Trofimova, 2000).
Computer simulation has become a more frequent tool for experimental studies, for example, of the interaction and adaptive behavior (Hollenbeck, Ilgen, Lepine, Colquitt, & Heldhund, 1998; Hollenbeck, Sego, Ilgen, & Major, 1991). Simulation presupposes a dynamic environment and cooperation with computer agents and human participants. Several persons cooperate in the same or in different rooms on different computers connected by a network. Different approaches exist to such simulation, and different problems are solved. Thus, multiplayer computer games are used (competition vs. cooperation). Such games help to study application of efforts and goal commitment in the course of joint work (Peng & Hsieh, 2012), fairness in the distribution of the reward among the participants, and willingness to preserve group membership (van Wissen, Gal, Kamphorst, & Dignum, 2012). Network simulation is used for assessment of problem solving by, for example, military tactical teams (Fletcher, 1999). Computer-based performance assessment technique is used for assessment of problem-solving skills by teams (O’Neil, 1999; Oser, Gualtieri, Cannon-Bowers, & Salas, 1999). Group decision support systems (GDSS) are used to study generation and discussion of ideas by the participants, involvement in joint work, perceived contribution, commitment, or personal influence (Daily & Steiner, 1998). Computer-supported collaborative learning (CSCL) environment has found application for the study of the behavioral, cognitive, and social group awareness by the participants, group-process satisfaction, and performance (Bodemer & Dehler, 2011; Phielix, Prins, Kirschner, Erkens, & Jaspers, 2011).
Another important line of investigation is development and application of computer techniques, which would combine a set of conceptually related questionnaires with a wide range of functional capabilities. Such techniques would allow a complex approach to the study of groups and prompt collection of data. Although there are a sufficient number of computers and computer-aided tests for analysis of particular personality aspects, the tools available for the study of groups are rather scarce.
For the above reasons, we were constrained to develop the computer technique that we named the Group Profile (GP) technique (Sidorenkov & Pavlenko, 2010). This technique, including questionnaires, has a number of features. First, they have been developed on a common theoretical basis—the microgroup theory (Sidorenkov, 2006, 2010), which describes a wide range of phenomena and processes characteristic of the activities of a small group, informal subgroups, and group members. The principal idea of this theory consists in analysis of the group and individual phenomena and processes through the prism of informal subgroups (microgroups) and members not included in them (outside members). Besides, this theory is aimed at analysis of the subgroups themselves within the context of the whole group and its life environment. It analyzes, in their interrelation, the three levels of group activity (group, subgroup, and individual), which makes it possible to reassess and enlarge the number of inter- and intralevel relations subject to study (subgroup–subgroup, subgroup–individual, individual–subgroup–individual, etc.). The microgroup theory contains general and special principles. The general principles reflect the fundamental constituents: group integrity and complexity, group activity modes, the source (controversies) and the mechanism (integration and disintegration processes) of the group dynamics, and so on. Special principles are based on the general ones and describe various (static and dynamic) phenomena: norms, cohesion, controversy, trust, identity, conflict, effectiveness, status, adaptation, and so on.
Second, a single theoretical basis, multilevel analysis of the group activity, and a multitude of tools (questionnaires) in a single program environment provide for complete realization of a complex approach to study of small groups. The technique as a whole or separate questionnaires can be used for educational, research, or diagnostic purposes. In the educational setting of higher schools, it will raise the quality of training of the specialists in the modern methods of study of small groups. In the area of research, these tools make it possible to view the traditional problems at a different angle, and to pose and solve new problems. Practically speaking, GP can be used in the following domains: government bodies, economics, education, and sports. It can be used for assessment of the degree of manifestation of various characteristics of a group, subgroup, or individual, including in the context of group effectiveness (assessment of potential and effectiveness of group and members, identification of sources of low group effectiveness, etc.). GP technique is created on the basis of multidimensional model of group effectiveness (Sidorenkov, 2010). Group effectiveness is a construct that includes two aspects (potential and real) and two types (productive and social). Potential effectiveness is aggregate of possibilities (internal conditions) groups which in combination with external conditions and the organization of joint activity of members determine its real effectiveness. Real effectiveness is an achievement by group of the set level of results of work and creation of social activity. Potential productive effectiveness includes three blocks of characteristics of group: formal-quantitative and structural characteristics (number, composition, etc.), social-psychological characteristics (task cohesion, activity-coping trust, productivity norm, etc.), and technical-organizational resources (the work organization, material equipment, etc.). Potential social effectiveness also includes three blocks of characteristics of group: formal-quantitative and structural characteristics, social-psychological characteristics (social cohesion, confidentially protective trust, openness norm, etc.), and organizational-communicative resources (communicative knowledge and skills of members, experience of interaction in group, etc.). GP is used for a complex estimation of social-psychological potential of group. Besides, by means of it is possible to measure real (productive and social) effectiveness.
Characteristics of the GP Computer Technique
Structure
Group Profile (GP) contains 16 questionnaires. The listed questionnaires were developed at different times and used in studies of work, office, school, and college groups, and so on. The questionnaires stimulus material has several forms adapted to the study of various types of small groups: (а) work groups, project teams, military units, and so on (Form A), (b) academic groups (Form B), and (c) sports groups (Form C). Application of all questionnaires comprised in the GP technique yields a wide range of data about the group as a whole (47 indices), each informal subgroup (43 indices), and each group member (16 indices).
Program
Borland Delphi 7, a Borland product line was selected as the development environment. Object Pascal was used as the software product development language. The operating system was Windows XP/Vista/7. The GP computer technique comprises the program, the database and the database driver, the folder with the database reserve copies, the folder for separate analyses of the group on different computers and the data alignment driver, and the documentation (reference system). A specialist who has access code for the program GP can work with it. The code prevents from unauthorized data use.
The top bar of the program main window contains the following sections: Documentation, Settings, Examination, Processing, Service, and Help (see Figure 1). The Documentation section includes the following subsections: General, Conceptual Basis, Examination Procedure, Questionnaires, Stimulus Material, Assessment Card, Effectiveness, and Certificate. The Questionnaires subsection contains a detailed description of all questionnaires that form part of the technique: the nature of the studied characteristics, the construction principles, the questionnaire assessment indices, and so on. The Stimulus Material subsection offers a selection of questionnaires for printout and performance of print-based examinations with subsequent loading of the data into the program and computerized processing of the results. The Effectiveness subsection presents a multidimensional model of effectiveness and recommendations for organizational and psychological action to improve the group’s effectiveness. The recommendations include the ways and methods to control the environment and cooperation variables, and the structural-qualitative and socio-psychological characteristics of the group.
Screenshot of main window of GP.
The Settings subsection can be used to select the tools (all or particular questionnaires) and to designate the group data (assignment of a name to the group, drawing up of the group list, indication of the organizational form of the group activity—joint/individual or joint/cooperative, and so on; see Figure 2). The preset configuration is then saved.
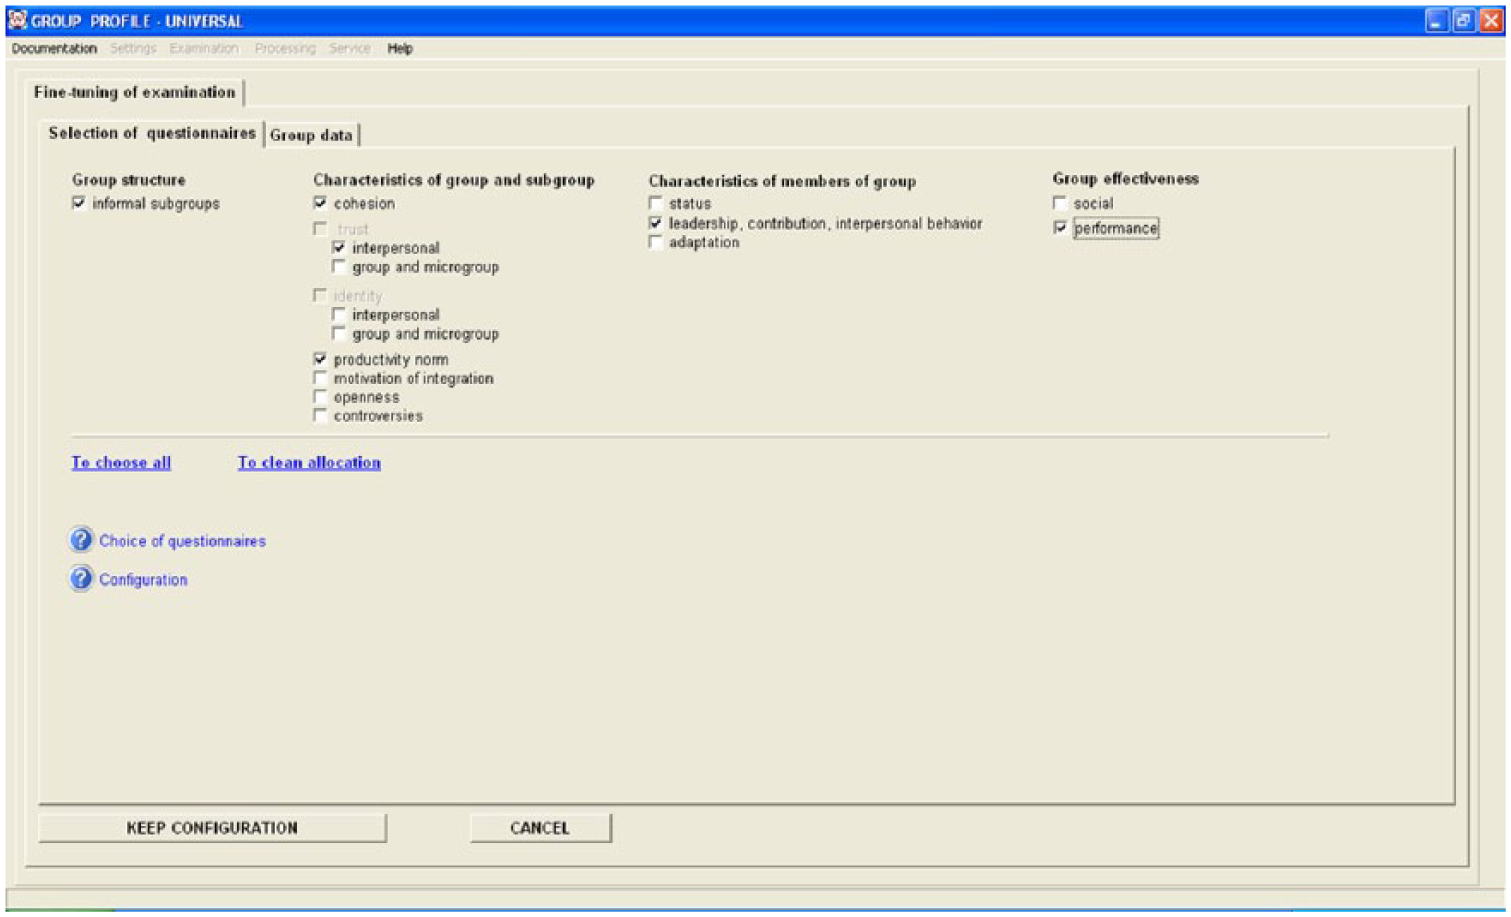
Screenshot of window Settings.
The Examination subsection is used for selection of the computer or paper format. For example, when the computer format is selected, search for the required group is started in the database (there are three search options) and the next respondent to operate the program is selected (see Figure 3).
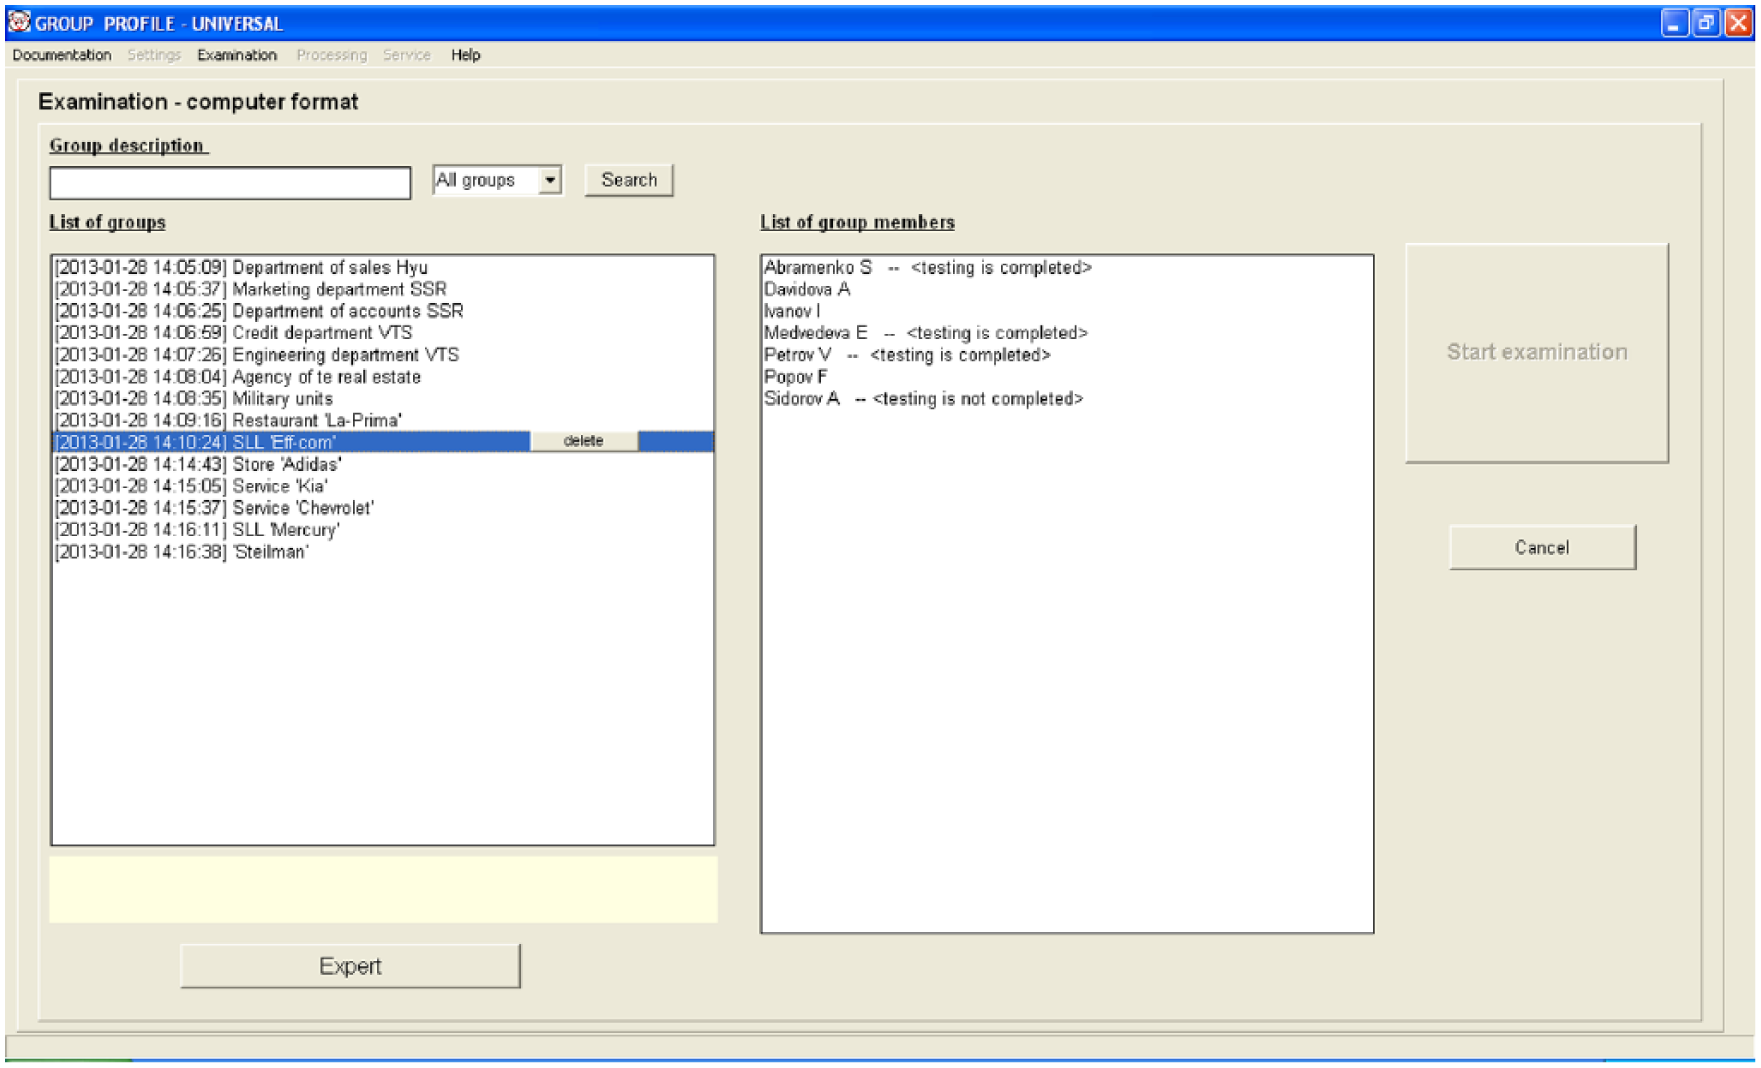
Screenshot of window Examination (select a group and the respondent for research).
Then the subject reads the general instructions in the special window and goes to the work window with the current questionnaire (see Figures 4 and 5). This window shows the number of the current questionnaire and the quantity of the remaining questionnaires available for work (top right), the current time of work with the questionnaires in the program (top right), the keys for transfer to the next questionnaire and return to the previous questionnaire (top center), the stimulus material, the instructions for the questionnaire, the group name and designation of the subject (bottom left), and the cancel key for the answers made by the subject. In addition to the general instructions, each questionnaire contains its own instructions describing the principles of operation.
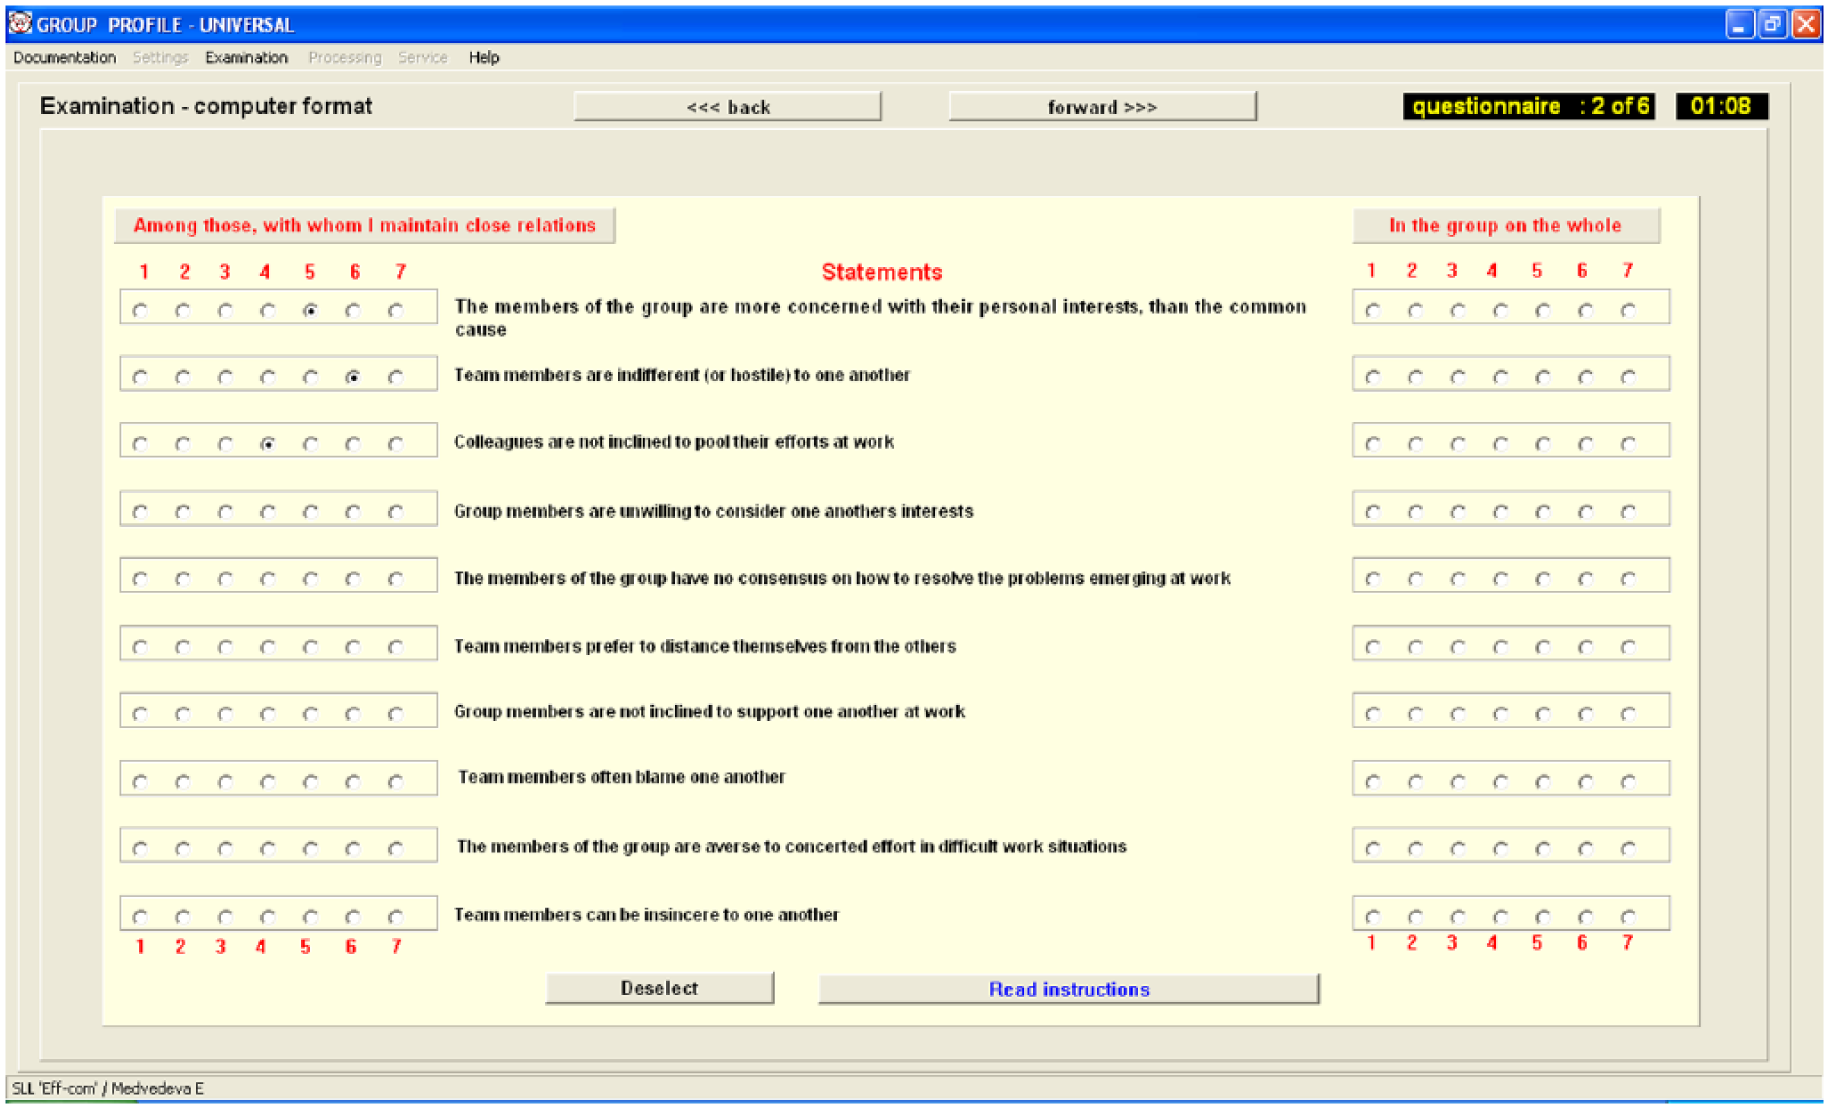
Window Examination (QTSC, Form A).

Screenshot of window Examination (QLCB, Form A).
Some questionnaires show the instructions in the same window with the stimulus material, whereas others use a special key to display the instructions. In the computer format of examination, almost all questionnaires are provided with control over the completeness and sincerity of the subject’s answers.
The Processing section includes two subsections: “Results Calculation” and “Normative Data Calculation” (see Figure 6). The first subsection is used for selection from the database of the required group and of the normative data type for calculation, as well as for performance of calculation proper for that group and output of the results in the MS Word format, the group assessment card, and the interpretation. The second one provides for output of the normative data and statistical zones across all questionnaires. This makes it possible to view them and make, if necessary, “manual” adjustment of the diagnosis obtained in the automatic mode (e.g., when the index of a certain group/subgroup characteristic is on the border of two statistical zones).
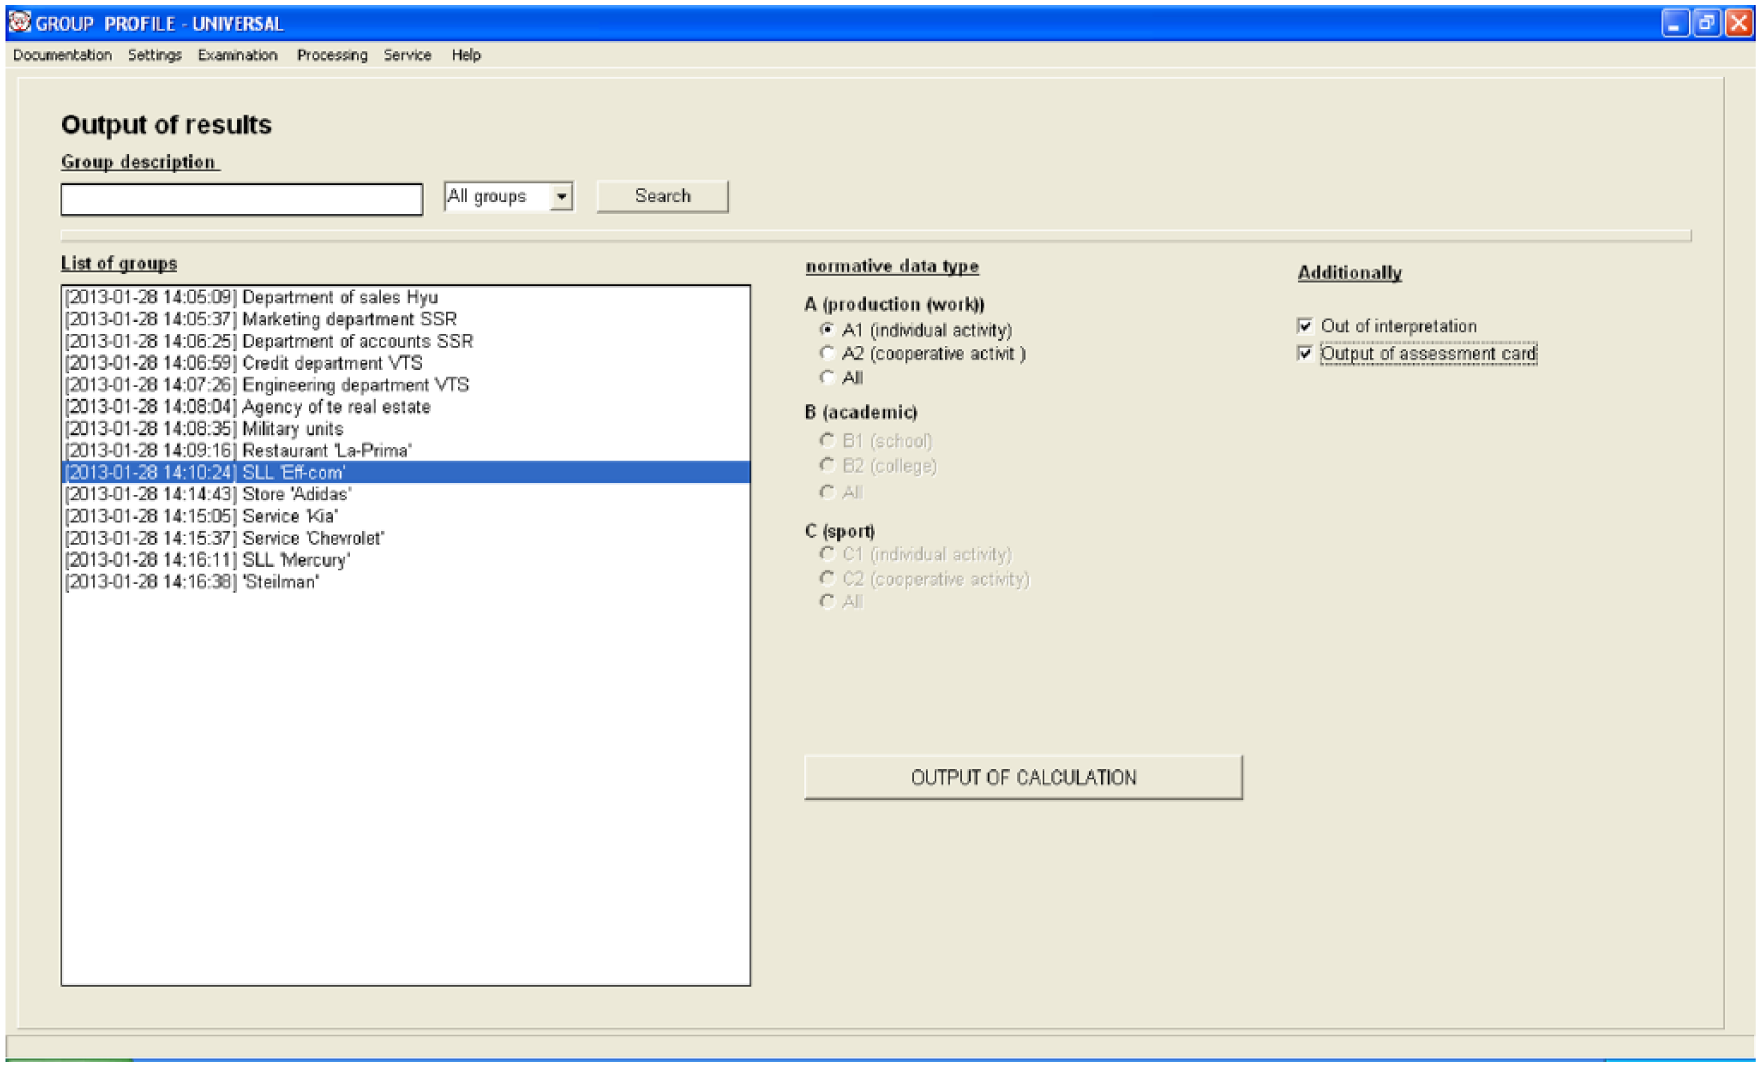
Screenshot of window Processing.
The Service section contains two subsections: “Import/Export” (of the examination data) and “Reserve Copies Saving.” The former is for the cases where two or more computers are used for examination of the group members to accelerate the examination procedure. The “Import/Export” subsection, together with its special driver provides for correct alignment, into a single format, of the data of the group members examined on different computers. The latter is used to save the current database. When this subsection is used, the reserve copy of the database is automatically placed into a special folder. This folder may contain an unlimited number of copies. If necessary, any copies of the database can be deleted or updated for the performance of an examination or data processing.
Functional Capabilities of the Software
The GP computer technique has a number of functional advantages. It ensures different formats of examination (computer or paper), and in the computer format, makes it possible to carry out examinations on several computers. GP is suited for different methods of application: complete (examination across all questionnaires) or partial (examination using just some of the questionnaires). Moreover, two options are offered by all questionnaires: complete (e.g., study of cohesion of the group as a whole, and of each informal subgroup separately), or concise (study of the group cohesion only). Partial and/or concise examination is more targeted and saves a lot of time.
GP in the computer format regulates the subjects’ work and controls their answers. Control is effected over (а) compliance with the instructions and completeness of the answers to the questionnaire items and (b) manifest distortion of the answers to the questionnaire items. The control is continuous and allows or blocks the transition into the next questionnaire. For example, if the subject has failed to give answers to all items and/or has provided manifestly insincere answers to the questionnaire of task and social cohesion of a group and subgroups (QTSC), the program will block transition into the next questionnaire and display the corresponding information. This control function drastically raises the validity of the results obtained through the computer format of examination, as compared with the paper format. The program offers the options of canceling and reinstatement of control.
GP states the completeness or incompleteness of examination of the subject (group member), and of the subjects left out of the examination. Thus, a specialist may stop examination of a subject before it is completed. This is made by selection of the function “stop examination and save data” or “stop examination without data saving.” In the former case, all answers made by the subject are saved, and examination of this subject can later be resumed from the point (questionnaire) where it was stopped, whereas in the latter case, the subject’s answers will be totally deleted.
GP comprises an automatically expanded database and calculates different variants of normative data depending on (а) the group type: work, academic, or sports; and (b) the group activity organization form: joint/individual or joint/cooperative. GP automatically processes and presents the results, and assesses the degree of manifestation of particular characteristics (such as social cohesion: “high level,” “tendency to high level,” “medium level,” “tendency to low level,” and “low level”). The results and assessments are presented in the text and tabular formats.
In addition to the main results, the interpretation and the group assessment card can be output. The assessment card shows the primary and the standardized (on a 10-point scale) test results: (а) by the socio-psychological characteristics of the group that reflect its potential effectiveness and (b) by the criteria of actual performance and social effectiveness of the group. The assessment card may also contain other indices obtained by other methods (analysis of documents, interviews, etc.). Comparison of the potential and the actual effectiveness of the group allows identification of the internal and external factors responsible for decrease/increase of the effectiveness, and planning of the organizational and psychological action to improve the group’s effectiveness.
GP permits viewing and printout of the normative data and statistical zones across all questionnaires. Based on that, adjustments can be made to the automatically generated assessment (“high level,” “tendency to high level,” etc.), if the index is on the border of two statistical zones. For example, the task cohesion index for Group A is 17.75. The program assesses it as “medium level.” However, this index is on the border between two statistical zones—“medium level” and “tendency to low level.” Considering this additional information, the assessed degree of manifestation of the group cohesion can be adjusted.
Questionnaires in the GP Computer Technique
From 174 to 292 employees in 17 to 32 groups were examined for assessment of particular questionnaires. Thus, assessment of the QTSC required examination of 32 groups (292 subjects), whereas assessment of the questionnaire of social effectiveness of a group and subgroups (QSE) involved 17 groups (174 subjects). The groups varied by the age and sex composition. The age of the subjects was within the range of 18 to 57 years. Both male and female groups were examined, along with groups with different percentage ratios between males and females (in the 32 groups, there were 59.8% females and 40.2% males). These groups are small businesses or primary structural units in various organizations involved in motor vehicle and catering services, trading in and sales of real estate, fire-fighting and military units, and so on. The strength of the groups varied from 6 to 24 persons (groups consisting of 8 to 12 persons predominated). The average size of a group was 9.1 members. All groups were organizationally and psychologically established. These small groups had been in existence for at least 1 year.
Method of Determination of Informal Groups
The method of identification of informal subgroups and outside members is tied with the other questionnaires, which extends the capabilities of the technique. A sociometric poll of the group members is conducted to the non-specific criterion: “Select the group members, with whom you maintain the closest relations.” A non-parametric procedure is used. The data are processed by means of the formalized algorithm developed by Gorbatenko and Gorbatenko (1984) to identify informal groups and members not included in them. This algorithm consists of the following actions:
A. Compilation of the “description” matrix to characterize the concrete status of the grouped variables.
B. Determination of the numerical value of the links (similarity) among the grouped members, and construction of the similarity factors matrix. The following value is used as the measure of “similarity” of the descriptions of the ith and the jth members of the group:

where Nc is the number of selection coincidences in the ith and the jth columns, Nyc is the number of non-coincidences in the ith and the jth columns, and No is the aggregate number of selections in the ith and the jth columns.
C. Arrangement of individuals into subgroups and identification of the index, which characterizes the quality of these subgroups. The grouping procedure consists in that each member of a small group is regarded as the “center” of formation of a possible subgroup, and a subgroup composition is determined such as to make the subgroup the most “dense.” To determine the quality (density) of the resulting subgroups, the D value is used, which is calculated by the following formula:

where N is the number of the subgroup members and Sij is the measure of similarity between the “central” and the most “remote” (dissimilar to the central) member of the subgroup.
The measure of density D reflects the degree of closeness of the internal relations in the subgroup and its separateness (markedness of its external borders) within the group.
D. Selection of the “densest” subgroups. The grouping procedure is repeated until such groups are found, the density of which is higher than the unity. The remaining members of the small group are regarded as “independent,” that is, not included in any informal subgroups.
On the basis of comparison of the formalized algorithm data and the experts’ assessments, it was found that the empirical indices of the algorithm accuracy (by the quantity and composition of the subgroups) in different groups vary from 78% to 100%.
Questionnaire of task and social cohesion of a group and subgroups, QTSC
The Russian-language term corresponding to “task cohesion” (TC) is «предметно-деятельностная сплоченность», which has no equivalent in the English language and reflects certain specifics of this type of cohesion. Besides, the Russian-language version of the questionnaire uses the term “socio-psychological cohesion” instead of “social cohesion” (SC). The foundation of the QTSC is formed by the multidimensional model of cohesion (Sidorenkov & Mondrus, 2012; Sidorenkov, 2010). The stimulus material contains 10 items in the form of statements (with a reverse formulation), 5 items per subscale (e.g., “The members of the group are more concerned with their personal interests, than the common cause”; see Figure. 4). The assessment is made on the basis of a 7-point scale (from completely agree [1] to completely disagree [7]). The questionnaire consists of two parts: “Among those, with whom I maintain close relations” and “In the group on the whole.” The first part is intended for the study of the TC and SC of the group as a whole, and the second part is used for each informal subgroup. The examination can be carried out in either the complete, or the concise variants. The complete variant uses both parts, whereas the concise variant requires only one part. The complete variant yields four group cohesion indices: TC-G1 and SC-G1, TC-G2 and SC-G2 (calculated with regard to the relations between informal subgroups, between subgroups and members not included in them), and two cohesion indices for each informal subgroup: TC-S and SC-S.
The internal consistency of subscales was investigated using Cronbach’s alpha. The coefficient alphas were .76 (TC-G) and .75 (SC-G). The correlation coefficients were .76 between the subscales TC-G and SC-G. (In it and other questionnaires, reliability and validity indicators only by one part [the group as a whole] are specified.)
Questionnaire of productivity norm in a group and subgroups, QPN
The stimulus material contains five items in the form of proverbs/sayings (such as “Slow and steady wins the race”), which reflect such norms as the work performance speed and the performed work volume (Sidorenkov, Koval, Mondrus, Sidorenkova, & Ulyanova, 2012). Assessment of the markedness of the attributes suggested by the items is done on a 7-point scale (from completely agree [1] to completely disagree [7]). The questionnaire consists of two parts: “Those with whom I maintain close relations” and “Group as a whole.” Accordingly, examinations can be carried out in the complete or the concise variant. The complete variant is used to study the productivity norm of the group as a whole (PN-G) and of each informal subgroup (PN-S), whereas the concise variant is concerned only with the productivity norm of the group (PN-G). The coefficient alpha for PN-G was .78.
Questionnaire of openness norm in a group and subgroups, QON
This questionnaire is a modification of the Small Groups Openness Scale (Gorbatenko, 1996). The stimulus material includes 24 items (e.g., “They will show little interest in him”), which reflect three types of the group members’ attitude to a newcomer and, generally, to all representatives of the outside social context: willingness to cooperate combined with a priori anti-humane attitude (Type А), readiness to cooperate combined with a priori humane attitude (Type B), and refusal from cooperation, indifference (Type C). The combination of such attitudes shows the degree of openness/closeness of a group and informal subgroups. The questionnaire consists of two parts, and the study can, therefore, be conducted in the complete or the concise variant. In the first case, the subject of study is the openness norm of the group as a whole (ON-G) and of each informal subgroup (ON-S), whereas in the second case, only the group openness norm (ON-G) is studied. The indices of the openness norm may assume positive or negative values.
Questionnaire of motivation of integration in a group and subgroups, QMI
This questionnaire can be used to identify the concrete motives of integration of the members in a group and each informal subgroup and determine the integral index of the motivation unity (МE) of a group and each subgroup. The questionnaire has been developed on the basis of a nominative scale (Sidorenkov et al., 2012). The stimulus material includes 33 items, which adequately cover the possible reasons for integration of the group members (e.g., “Personal or family problems,” “Support in the group”). It has been developed based on a pilot study.
A special mathematical algorithm was created to calculate the МE coefficient:

where
The numerical values of the coefficient may vary in the range of −1 to 1. However, the presence of negative values of the МЕ1 leads to a certain inconvenience. Therefore, the initial coefficients are transformed into a scale of another dimensionality by the following formula:

The values of the coefficients МЕ2 may vary from 0 to 1. Examination can be carried out in the complete or in the concise variant. The first option is used to study the motives of integration and the motivation unity of the members of the group as a whole and of each informal subgroup, whereas the second option is concerned with the whole group only. In both cases, three indices can be determined: the number of selections for each motive, five leading motives (those with the maximum of selections), and the value of the motivation unity coefficient МЕ2.
Questionnaire of controversies in a group and subgroups, QC
This questionnaire can be used to study the following types of socio-psychological controversies: interpersonal (Ip), individual–group (IG), motivation–activity (MA), activity–organization (AO), status (St), and intergroup (Ig). The occurrence rate is determined for each type of controversy. The stimulus material includes 12 items, 2 per subscale (e.g., “I find it difficult to communicate with some group members”; Sidorenkov et al., 2012; Sidorenkov, 2010). Assessment is performed on a special scale, but then the initial data are transformed, by an algorithm, into the scale from 0 to 20.
Correlation between the subscales showed that out of 15 coefficients, 5 had values less than .20, whereas the others’ values were within the range of ± .20 to ± .50. Test–retest correlations were the following, for the corresponding subscales: Ip (.91), IG (.83), MA (.93), AO (.87), St (.95), and Ig (.89).
Questionnaire of interpersonal trust in a group and subgroups, QIT
QIT and questionnaire of microgroup and group trust in a group and subgroups (QGMT) were created on the basis of a multidimensional model of trust in a small group (Sidorenkov & Sidorenkova, 2011, 2013). Study of the degree of characteristics, shown in points, is carried out on a 7-point scale basis (from completely agree [1] to completely disagree [7]). QIT includes three subscales for estimation of three types of interpersonal trust (IT)—activity-coping (ACT), information-influentive (IIT), and confidentially protective (CPT) trust. Each type of trust includes three components: cognitive (conviction of a subject in presence–absence of certain characteristics, inhering in the object of trust), affective (positive–negative evaluation of the object of trust), and behavioral (readiness of a subject to interact with an object of trust in a certain way). These trust components were considered for selection of the questionnaire items.
The questionnaire consists of 12 items (with a reverse formulation)—4 ones for each subscale (“I avoid straight talks” [CPT], “I cannot rely on the opinion of others in respect to disputable points” [IIT], “Sometimes I doubt, that others do the job the way it should be done” [ACT]). QIT consists of two parts: “Among those, with whom I maintain close relations” and “In the group on the whole.” The first part allows study of interpersonal trust in subgroups, the other one, in a group on the whole. The complete examination variant makes it possible to obtain six indices of interpersonal trust: ACT-G-I1, IIT-G-I1 and CPT-G-I1, ACT-G-I2, IIT-G-I2 and CPT-G-I2 (calculated with regard to the relations of trust among the subgroups, and between the subgroups and outside members), and three indices of trust inside the subgroups: ACT-S-I, IIT-S-I, CPT-S-I. The higher the numerical value of subscales is, the stronger this or that type of trust is manifested. Besides, to evaluate trust between subgroups, a relative index is used. It is calculated from comparison of the results, obtained from two parts of the QIT. That is, in each subscale, the index in “In the group on the whole” is divided by the index in “Among those, with whom I maintain close relations,” and then, it is multiplied by the constant 10.
The Cronbach’s alpha values for the subscales were ACT-G-I (.78), IIT-G-I (.69), and CPT-G-I (.77). The correlation coefficients were as follows, between the corresponding subscales: ACT-G-I and IIT-G-I (.67), ACT-G-I and CPT-G-I (.55), and IIT-G-I and CPT-G-I (.43).
Questionnaire of microgroup and group trust in a group and subgroups, QGMT
QGMT is developed according to the same scheme, as the previous questionnaire. It also includes three subscales, but for study of three types (ACT, IIT, and CPT) of group (GT) and microgroup (MGT) trusts. (Group/microgroup trust is trust of the members to group/informal subgroups.) QGMT consists of 12 items (with a reverse formulation)—4 ones for each subscale. Each type of trust includes three components: cognitive, affective, and behavioral.
The questionnaire consists of two parts: “Community those with whom I maintain close relations” and “The group on the whole.” The first part is dedicated to study microgroup trust, the other one to study group trust. Examination can be carried out in the complete or in the concise variant. The first option allows determination of three group trust indices (ACT-G, IIT-G, and CPT-G) and three microgroup trust indices (ACT-МG, IIT-МG, and CPT-МG), whereas the second option yields only three group trust indices (ACT-G, IIT-G, and CPT-G). Test measurements by subscales may vary from 4 to 28. Besides, trust of subgroups to a group is determined implicitly, but on the basis of comparison of indexes of two parts of QGMT. In each subscale, the index of part “The group on the whole” is divided by the index of part “Community those with whom I maintain close relations” and is multiplied by the constant 10.
The Cronbach’s alpha values for the subscales were .81 (ACT-G), .75 (IIT-G), and .79 (CPT-G). The correlation coefficients were .81 between the subscales ACT-G and IIT-G, .73 between ACT-G and CT-G, and .77 between IIT-G and CPT-G.
Questionnaire of interpersonal identity in a group and subgroups, QII
QII and questionnaire of microgroup and group identity in a group and subgroups (QMGI) were developed on the basis of a multidimensional identity model (Sidorenkov et al., 2012; Sidorenkov & Trishkina, 2010). QII includes three subscales and permits the study of three components of the interpersonal identity of an individual in a group or subgroup: the cognitive (IC), the affective (IA), and the behavioral (IB). The stimulus material is based on a number of operational attributes of interpersonal identity. It includes 12 items in the form of statements (with a reverse formulation), 4 per subscale (e.g., “I don’t feel bad when my opinion differs from that of the others”). Assessment is made on a 7-point scale basis (from completely agree [1] to completely disagree [7]).
The questionnaire comprises two parts: “Among those, with whom I maintain close relations,” and “In the group as a whole.” The first part is intended for the study of interpersonal identity inside subgroups, whereas the second part is concerned with the group as a whole. Therefore, examination of a group can be carried out in the complete or in the concise variant. The complete version uses both parts, and the concise version only one part. The first option yields six indices of interpersonal identity in the group as a whole: IC-G-I1, IA-G-I1 and IB-G-I1, IC-G-I2, IA-G-I2 and IB-G-I2 (calculated with regard to the identity among the members of different subgroups within a group); and three identity indices inside informal subgroups: IC-S-I, IA-S-I and IB-S-I. In the second case, only the interpersonal identity indices in the group as a whole can be calculated.
The coefficient alphas for subscales were .72 (IC-G-I), .74 (IA-G-I), and .70 (IB-G-I). The correlation coefficients were .33 between the subscales IC-G-I and IA-G-I, .43 between IC-G-I and IB-G-I, and .43 between IA-G-I and IB-G-I.
Questionnaire of microgroup and group identity in a group and subgroups, QMGI
QMGI comprises three subscales and allows the study of the following three components of the group identity (G-I) and microgroup identity (MG-I) of an individual: cognitive (IC), affective (IA), and behavioral (IB). (Group/microgroup identity is identity of the members with group/informal subgroups.) The stimulus material is based on a number of operational attributes of the microgroup identity (I-MG) and the group identity (I-G). It contains 12 items in the form of statements, 4 per subscale (e.g., “I don’t feel like a part of the whole”). All items have a reverse formulation. The assessment is made on the basis of a 7-point scale. The questionnaire consists of two parts: “Among those, with whom I maintain close relations” and “In the group on the whole.” The first part is intended for study of MGI, and the second for GI. The examination can be carried out in either the complete or the concise variants. The first option allows determination of three G-I indices (IC-G, IA-G и IB-G) and three MG-I indices (IC-MG, IA-MG и IB-MG), whereas the second option yields only three G-I indices.
The internal consistency (the Cronbach’s alpha) scores for the IC-G, IA-G, and IB-G were .72, .78, and .66, respectively. The correlation coefficients were .56 between the subscales IC-G and IA-G, .34 between IC-G and IB-G, and .41 between IA-G and IB-G.
Questionnaire of types of interpersonal conflicts in a group and subgroup, QTICf
This questionnaire has been constructed to study job conflict (JC) and subject conflict (SC) in a small group and in informal subgroups (Sidorenkov, Lokteva, & Mkrtchyan, 2014). The stimulus material of the QTICf initially included 15 items. In its final version, it had eight items—four in each of the two subscales: JC and SC (e.g., “In the joint performance of their duties, the colleagues often reproach and criticize one another,” “Personal relations among the colleagues are often marred by discontent and bad temper”). Questionnaires consist of two parts: “In the group as a whole” and “Among those with whom I maintain close relations.” The first part is intended for the study of the types of interpersonal conflicts in the group as a whole, whereas the second part is concerned with such conflicts within each informal subgroup. Evaluation by the subjects of the severity of the attribute reflected by each item is on the basis of a 7-point scale (from 1—“completely disagree” to 7—“completely agree”). The values of the coefficients for each subscale may vary from 4 to 28.
The Cronbach’s alpha values were .89 (JC) and .90 (SC) at the group level, and .76 (JC) and .82 (SC) at the level of informal subgroups. The correlations between the two factors were .68 (Part 1) and .49 (Part 2).
Questionnaire of performance effectiveness of a group and subgroups, QPE
QPE has been developed on the basis of two subjective criteria of performance effectiveness and includes two corresponding subscales: “realization of the plan and performance of current tasks” (PT) and “performance under pressure” (PP) (Sidorenkov et al., 2012; Sidorenkov & Ulyanova, 2011). The stimulus material includes six items, three per subscale. The items are in the form of statements and have a reverse formulation (e.g., “The group often falls short of the plan targets for the main business areas [indices]”). Assessment is made on the basis of a 7-point scale. The subjects are the managers and, in addition, the rank and file members of the group. The questionnaire consists of two parts, each intended for the study of the corresponding aspect of effectiveness of the group as a whole and each informal subgroup. Examination can be carried out in the complete or in the concise variant. In the first case, the effectiveness of the group and each informal subgroup is studied, and in the second case, only the group effectiveness is analyzed. The results of the study of the group and each subgroup can be presented in the form of three indices: on the scale as a whole (PE) and on each subscale (PT and PP).
The internal consistency was .93 for the total scale (PE), .85 for PT, and .92 for PP. Correlation between the PT and PP subscales was .86.
Questionnaire of social effectiveness of a group and subgroups, QSE
QSE is based on three criteria and contains three corresponding subscales: “satisfaction of members with the group/subgroup and its performance results” (S); “psychological comfort of members in the group/subgroup” (C); and “group/subgroup support of the personal and professional development of its members” (D). The stimulus material contains six items, two per subscale (Sidorenkov et al., 2012; Sidorenkov & Ulyanova, 2011). The items are in the form of statements and have a reverse formulation (e.g., “I am not satisfied with what goes on in the group”). Assessment is made on a 7-point scale. The questionnaire consists of two parts, each intended for the study of the corresponding aspect of social effectiveness of the group as a whole and each informal subgroup. The results of the study of the group and each subgroup can be presented in the form of four indices: on the scale as a whole (SE) and on each subscale (S, C, and D).
The Cronbach’s alpha values were .83 for the total scale (SE), .85 for subscale S, .82 for C, and .89 for D. The correlation coefficients were .53 between the subscales S and C, .68 between S and D, and .72 between C and D. Besides, the coefficient of correlation between the PE and SE integral indices was calculated as equal to .14. This value shows that there is no link between the two types of effectiveness—performance and social.
Questionnaire of socio-psychological adaptation of an individual in a group and subgroup, QSA
QSA contains 14 reverse-formulated items (e.g., “I need more trustful and warm relations”; Sidorenkov & Koval, 2012; Sidorenkov et al., 2012). Assessment is made on a 7-point scale. The questionnaire consists of two parts: “In the group as a whole” and “Among those, with whom I maintain close relations.” The first part is designed for the study of adaptation of an individual in the group as a whole, and the second part relates to the informal subgroup (if the individual is an insider) or to the subgroup (if the individual is an outsider). Examination can be carried out in the complete or in the concise variant. The complete variant is used to study the adaptation of members to a group and informal subgroup (subgroup) and yields two adaptation indices. The concise variant allows only assessment of the adaptation to the group and, consequently, provides only one index. The coefficient alpha for the scale was .85.
Questionnaire of socio-psychological status of an individual in a group and subgroup, QSS
QSS diagnoses the following types of the sociometric status of a group member: (а) communicative status (CS), (b) reference status (RS), (c) trust status (TS)—by confidential trust (TS-C), by information trust (TS-I), and by performance trust (TS-P)—and (d) identification status (IS)—by the cognitive component (IS-C), by the affective component (IS-A), and by the behavioral component (IS-B) (Sidorenkov et al., 2012). This questionnaire can be used for complete or the concise variant of examination. In the first case, the status of each individual is assessed only in the group as a whole, whereas in the second case, the status is assessed in the group as a whole and inside the informal subgroup (for insiders). Besides, the concise variant may consist in the study of only particular types of status.
Questionnaire of leadership, contribution, and interpersonal behavior of an individual in a group and subgroups, QLCB
This questionnaire (Sidorenkov et al., 2012) is a modified questionnaire of interpersonal relations (Gorbatenko, 1990). QLCB is based on a nominative scale, consists of three subscales, and permits assessment of three characteristics of the activity of each member in the group and the informal subgroup (if an insider): (а) leadership/submissiveness (LS), (b) contribution to the group activity (CG), and (c) interpersonal behavior style (IB). The stimulus material includes 36 items per subscale, in the form of individual characteristics (e.g., “Gives good advice,” “Can’t tolerate opposition”). The procedure of the subject’s work with the questionnaire in the computer format consists in that the program uses a special algorithm to generate the surnames of certain members of the group. The subject must assess each of them by means of 36 characteristics (see Figure 5). The processed results show the LS, CG, and IB of the member in the whole group and in the informal subgroup, where he or she is an insider.
Discussion
Development of the GP technique allowed us to introduce new principles of construction of questionnaires (e.g., simultaneous study of the characteristics of a group and its informal subgroups, the characteristics of an individual within the context of the group and the informal subgroup of which he or she is a member), to create certain functional capabilities of the software (e.g., complete and partial examination, continuous control of sincerity of the subjects’ answers, compilation of the group assessment card), and so on. Such tools open wide horizons for complex studies, for examination of the traditional problems from a different point of view, and for the formulation and solution of new problems. It is difficult for us to specify any computer technique with which it was possible to compare GP on all its parameters.
The questionnaires in GP technique are new or modified. They are created on the basis of new model of a phenomenon, have a new format stimulus material and algorithm of calculation of the data, measure simultaneously some different characteristics. For example, QIT and QGMT are created on the basis of multidimensional model of trust in a small group. This model includes two dimensions: trust levels (interpersonal trust, microgroup trust, group trust, trust between subgroups, trust between subgroups and group) and types of trust (activity-coping, information-influentive, and confidentially protective). Each level of trust is manifested in three types. Actually, there are no other questionnaires that could measure all specified levels and types of trust in group. As a rule, questionnaires are used for studying only interpersonal trust, without differentiation in types (e.g., Aubert & Kelsey, 2003; Jarvenpaa, Knoll, & Leidner, 1998; Mayer, Davis, & Schoorman, 1995).
The following actions are planned to update the GP technology in future: to develop and include in the program a new questionnaire, to create a module for assessment of the performance effectiveness by objective criteria with regard to the type of the group and the essence of its activity (in the current version, assessment of such effectiveness is performed by subjective criteria), and so on.
Footnotes
Declaration of Conflicting Interests
The author(s) declared no potential conflicts of interest with respect to the research, authorship, and/or publication of this article.
Funding
The author(s) received no financial support for the research and/or authorship of this article.