
Abstract
The article presents the Quick Inventory of Pain Symptoms (QIPS) to assess the frequency and intensity of pain experienced within the last week in non-clinical samples. The first evaluation of the inventory administered to 100 undergraduate and graduate students revealed a concurrent validity of the QIPS with the four pain-related items of the symptom checklist (SCL-90r). Furthermore, this preliminary analysis showed that the QIPS is capable of revealing sex differences. Further studies are needed to validate the inventory and its psychometric properties to evaluate its use in different populations.
Introduction
Numerous questionnaires exist to measure pain symptoms and symptom severity, particularly in clinical samples. Of interest are standardized instruments for the assessment of pain location, pain frequency or prevalence, and the intensity of the experienced symptoms. Furthermore, in clinical use, the time period of pain duration and the onset of symptoms are relevant for the diagnosis of chronic pain or specific pain-related diseases. Such multidimensional pain assessment tools incorporate the assessment of pain location by simple word descriptors (e.g., headache) or illustrations of the body scheme (Cleeland & Ryan, 1994). Commonly, categorical scales in diverse orders are used for the assessment of pain intensity. Traditionally, these are presented as either visual analog scales (VASs) or numeric rating scales (NRSs, Lundeberg et al., 2001). Furthermore, other questionnaires such as the McGill Pain Questionnaire (Melzack, 1975) use word descriptors to further specify the subjective experience of pain. The frequency or prevalence of reported symptoms is typically assessed within a defined time period. For specified clinical pain diagnosis (e.g., chronic migraine), a wide range of prevalence estimates (e.g., lifetime, one month, point prevalence) exist. Compared with these medically defined pain problems, evidence on the prevalence of any pain in the general population (Brattberg, Thorslund, & Wikman, 1989) is rare, as research focuses on the clinically relevant pain conditions, in particular chronic pain.
Questionnaires such as the Oswestry Low Back Pain Disability Questionnaire (Fairbank & Pynsent, 2000), the Quebec Back Pain Disability Scale (Kopec et al., 1995), and the Northwick Park Neck Pain Questionnaire (Leak et al., 1994), and others (Davidson & Keating, 2002) focus on the assessment of the functional disability due to these specific pain syndromes.
Within our experimental pain research, we were seeking for a questionnaire to assess the frequency and intensity of pain symptoms within the last week in nonclinical samples. On one hand, general scales that are available for the assessment of psychopathological and somatic symptoms such as the symptom checklist (SCL-90r, Derogatis, 1977) or the Brief Symptom Inventory (BSI, Derogatis & Melisaratos, 1983) only hold a limited number of pain-related items and are therefore limited in their use in specifically pain-related research. On the other hand, widely used instruments, such as the Brief Pain Inventory (BPI, Cleeland & Ryan, 1994), yield vast information on the location, intensity, and interference of pain in the patient’s life. We were in need for both, an economic and a comprehensive inventory to assess pain symptoms in the most common locations, their frequency, and intensity. Given the existence of these established pain measures, the Quick Inventory of Pain Symptoms (QIPS) provides a quicker assessment of specific pain-related symptoms, and their frequency, duration, and intensity for the use in experimental or epidemiological studies. In contrast to the clinical and diagnostic use of specific pain questionnaires, such research designs often involve large and time-consuming psychometric assessments (demanding short inventories such as the QIPS) that, on the contrary, yield more information than the use of general symptom questionnaires. Therefore, we designed the QIPS. To test the feasibility of this newly developed instrument, it was administered to a sample of apparently healthy students. Within this first evaluation we aimed to investigate its concurrent validity with the pain-related items of the SCL-90r and to test whether it is capable of revealing sex differences, as evidence supports that sex differences in clinical and experimental pain responses are substantial (Fillingim, King, Ribeiro-Dasilva, Rahim-Williams, & Riley, 2009).
Method
Scoring and Assessment of the Inventory
This first version of the QIPS assesses the frequency and intensity of pain within the last week in five of the most common pain locations: headaches (HA), shoulder or neck pain (SN), chest pain (SP), pain in lower back (LB), and muscle pain (MP). The selection of these pain locations was based on the most common locations of pain symptoms as derived from the literature and those used within the SCL-90r. However, the inventory allows for the modular extension of further locations by adding different or more specified locations (e.g., face pain). For each location, the frequency of experiencing pain in the particular location is scored by the number of days per week and the average hours per day. The days per week are indicated on an 8-point scale (scored 0 to 7). The average hours per day are assessed on an ordinal scale: <3 hr (scored 1), 3 hr (scored 2), 6 hr (scored 4), 9 hr (scored 6), 12 hr (scored 8), or >12 hr (scored 9). If the respondent indicated no days with pain, the average duration is scored 0. These response categories were selected to gain a simple estimate of the average duration of pain relating to 24 hr (e.g., 6 hr refer to 25% of 24 hr or 50% of daytime). The nonlinear scoring is based on suggestions for later calculations of indices and with respect to the relation of the categories (i.e., 6 hr are twice as long as 3 hr). To our knowledge, no other pain-related measure addresses the duration of pain symptoms in such a systematic way using response categories. The pain intensity for each pain location is presented as a typical 11-point Likert-type NRS, with 0 = no pain to 10 = pain as bad as one can imagine. Such 11-point Likert-type NRS are most frequently used in experimental and epidemiological research on pain to assess the intensity of pain symptoms or acute pain experience. The English version of the inventory is illustrated in Figure 1, and the German version that was used in the present study is illustrated in Figure 2.
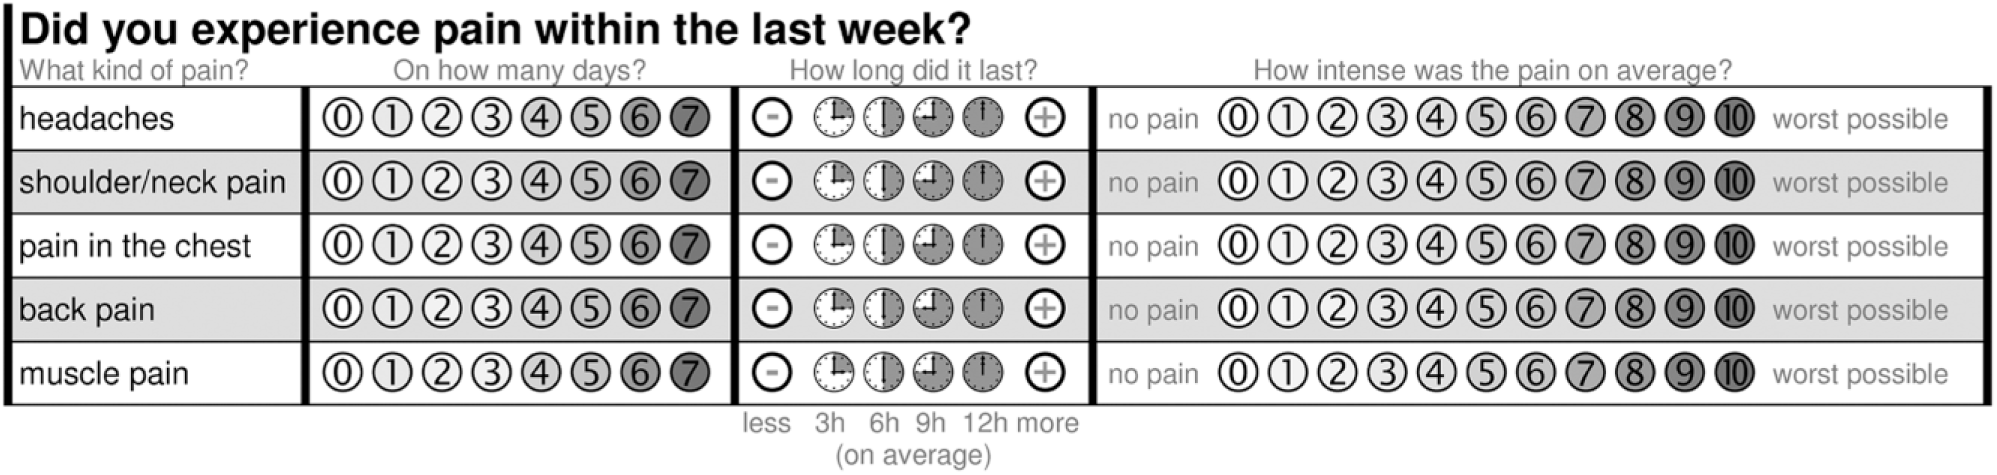
The English Version of the Quick Inventory of Pain Symptoms (QIPS-Eng).

The German Version of the Quick Inventory of Pain Symptoms (QIPS-Ger).
Analysis of the Inventory
For the analysis of the QIPS, we propose different methodological approaches. Based on single locations (i.e., headaches), we suggest distinguishing respondents who report pain (days > 0) from those without pain during the last week. Simple analysis of frequency can be used to illustrate the general prevalence of pain in a specific location within a sample of respondents. As only those who report pain are obviously able to provide further information on the duration and intensity of pain, we suggest limiting group comparisons on pain duration and pain intensity to respondents who actually report pain.
As pain locations are not interchangeable and reflect distinct entities, we suggest not to pool data across locations. To provide an overall index of pain severity within one location, we suggest calculating five Location Score for each of the pain locations (HA, SN, SP, LB, MP). The days per week can be multiplied with the ordinal code of the average hours per day (see previous section), resulting in a raw estimate of hours of pain experienced within the last week. To further estimate the severity or burden of that experience, we suggest multiplying the resulting score with the average intensity score (0 to 10). This severity score will vary between 0 (no days with pain) and 630 (7 days with pain that lasted longer than 12 hr, with an average intensity of 10). For simplification, we suggest to divide this score by 6.3 to generate a percentage value. A Location Score of 0% indicates no experienced pain symptoms within the last week, whereas a Location Score of 100% indicates the most intense pain experienced every day for more than 12 hr within the last week.
Preliminary Evaluation
To do a preliminary validation of the QIPS in German language in a nonclinical sample, we administered the inventory to 100 healthy graduate and undergraduate students who signed informed consent. Respondents participated in different research studies that were conducted at that time at the institution. Participants were asked to complete the QIPS and four pain-related items of the German version (Franke, 1995; Schmitz et al., 2000) of the SCL-90r (Derogatis, 1977). These items were integrated to evaluate the concurrent validity of the QIPS with the assessment of pain symptoms within the last week by the SCL-90r (How much were you bothered or distressed over the past week by . . .). These items included Item 1 (headaches), Item 12 (pain in heart or chest), Item 27 (pain in lower back), and Item 42 (soreness of muscles). All items were scored on a 5-point scale: 0 = not at all, 1 = a little bit, 2 = moderately, 3 = quite a bit, and 4 = extremely.
Statistical Analysis
Following descriptive analyses, location scores and the three indices were calculated as described above. Independent t tests and chi-square (χ2) tests for categorical variables were used to assess sex differences. Bivariate correlations (Pearson’s r) were calculated to investigate the correlation of the location scores, the indices, and concurrent validity of the QIPS locations scores with the items of the SCL-90r. All tests were considered statistically significant if p < .05. Data management and analysis were performed using SPSS (21, IBM, Chicago, IL, USA).
Results
A total of 100 participants (mean age = 23.9 ± 5.8 years, 55 women) completed the questionnaires. A total of 83% of the participants (92.7% in women, 71.1% in men) indicated at least 1 day with pain in one of the five locations. Headaches (60%) were the most common, followed by pain in lower back (53%) and shoulder or neck pain (53%).
Mean days per week and mean intensity ratings of the subjects that reported pain within the last week are given by location and sex in Table 1. Frequencies for ratings of pain duration are given in Figure 4. Independent t tests revealed statistically significant differences between women and men on mean days with headaches, t(98) = −3.298, p = .001, and mean days with shoulder or neck pain, t(98) = −4.123, p < .0001, analyzing all subjects, including those who did not report pain (days = 0). These differences were also present when only analyzing subjects who reported actually headaches, t(58) = −2.115, p = .039, or shoulder or neck pain, t(51) = −3.086, p = .003. Women reported more days with headaches and shoulder or neck pain compared with men (Table 1).
Mean Days per Week and Mean Intensity Ratings by Pain Location and Sex.

Note. All values are means with standard deviation (SD) in parentheses. Percentage of subjects reporting pain (> 0 days per week). HA = headaches; SN = shoulder or neck pain; CP = chest pain; LB = pain in lower back; MP = muscle pain.
Missing data n = 1.
Indicates a significant difference between women and men at the .05 level.

Histograms on days with pain by location in the entire sample.

Frequency of pain duration ratings by pain location in the entire sample.
Sex differences on pain duration in hours by location are illustrated in Figure 5. Chi-square tests revealed significant sex differences on mean pain duration of headaches, χ2(5) = 13.189, p = .022, and shoulder or neck pain, χ2(6) = 18.778, p = .005, analyzing all subjects, including those who did not report pain. While these differences were no longer significant when analyzing only those subjects who actually reported headaches, χ2(4) = 7.695, p = .103, they were robust in those reporting shoulder or neck pain, χ2(5) = 13.503, p = .019. Women reported greater average duration of headaches and shoulder or neck pain compared with men, as illustrated in Figure 5.

Average duration of headaches and shoulder or neck pain in hours by sex.
Independent t tests revealed significant sex differences on mean intensity ratings of headaches, t(98) = −2.983, p = .004, and shoulder or neck pain, t(98) = −2.882, p = .005, analyzing all subjects, including those who did not report pain. These differences were not present when only analyzing subjects who reported headaches, t(58) = −1.580, p = .120, or shoulder or neck pain, t(51) = −0.885, p = .380. Sex differences on mean intensity ratings that were found for respondents reporting chest pain need to be interpreted with caution due to a limited number of subjects reporting pain in this location, t(8) = 3.612, p = .007. Women reported greater pain intensity for headaches and shoulder or neck pain compared with men (Table 1).
For each pain location, a location score was calculated, as explained above, if complete data was available. Means and standard deviations are summarized in Table 2. Independent t tests revealed significant sex differences for the location score on headaches, t(98) = −2.224, p = .028; shoulder or neck pain, t(97) = −3.173, p = .002; and pain in lower back, t(8) = −2.330, p = .022. Women reported greater location scores (Table 2).
Pain Location Scores by Sex.

Note. All values are means with standard deviation (SD) in parentheses. n = number of participants with complete data for analysis; HA = headaches; SN = shoulder or neck pain; CP = chest pain; LB = pain in lower back; MP = muscle pain.
Indicates a significant difference between women and men at the .05 level.
The correlation of the QIPS location scores is given in Table 3. The location scores correlated significantly with their respective items on the SCL-90r for headaches (r = .556, p < .001), chest pain (r = .294, p < .001), pain in lower back (r = .608, p < .001), and muscle pain (r = .307, p = .002).
Correlation of the QIPS Location Scores.

Note. Pearson’s r. QIPS = Quick Inventory of Pain Symptoms; HA = headaches; SN = shoulder or neck pain; CP = chest pain; LB = pain in lower back; MP = muscle pain.
Indicates a significant correlation at the .05 level.
Discussion
We presented a brief inventory to assess the frequency and intensity of self-reported symptoms of pain in the most common locations within the last week. The current version of the inventory comprises five pain locations that were each rated by the participants.
The aim of this first evaluation was to test the applicability of the inventory and its concurrent validity with the assessment of pain symptoms by the SCL-90r. We found the QIPS to be an easy- and fast-to-use inventory providing valid information, as shown in high correlations with the pain-related items of the SCL-90r that were selected given the similarity to the items of the QIPS. In addition, the inventory provides a feasible assessment of frequency and intensity of the reported symptoms in a comprehensive manner. Furthermore, we investigated whether the inventory is capable of revealing sex differences in a sample of 100 apparently healthy undergraduate and graduate students. We found a significantly higher reporting of headaches and shoulder or neck pain frequency and duration in women compared with men. Pain intensity did not differ significantly between women and men except for chest pain that is potentially biased due to a small number of subjects reporting pain in that location. These findings are in line with evidence suggesting women to generally report experiencing more recurrent pain and sex differences in the prevalence rates for painful clinical conditions.
Within our sample, more than 50% of the participants reported to have experienced headaches, pain in lower back, or shoulder or neck pain within the last week. These findings are in line with previous reports on the prevalence of any pain—including even a problem of short duration—in the general population (Brattberg et al., 1989). As pain is reported most frequently in older age groups, the prevalence within our sample consisting of young students is surprisingly high. However, evidence on the distinct 1-week prevalence of nonclinical pain within different locations is rare. Therefore, our findings can barely be integrated into the literature. For example, recent reviews support a point prevalence for low back pain of 11.9% with greater prevalence for female subjects (Hoy et al., 2012). While our results support a greater week prevalence of low back pain in women (60.0% vs. 44.4%), we found a greater total prevalence in our sample. However, as these prevalence estimates may vary according to the case definition (e.g., minimum episode duration required for a case to be counted), differences seem reasonable, for we did not aim to assess clinically relevant cases.
However, we see several opportunities for further improvement and adjustment of the inventory. Correlations of the locations (e.g., headaches and shoulder or neck pain) scores indicate that a clearer differentiation of the locations might be necessary to further improve the inventory. In particular, the item on muscle pain shows reasonable correlations with shoulder or neck pain and pain in lower back. While evidence supports a comorbidity of pain in different locations, the interference of the locations revealed by correlation analysis should be considered when using the QIPS. Furthermore, the inventory allows for the modular extension adding different pain locations. Addressing the average duration of the pain experience in hours, different categories (e.g., 1 to 2 hr, 2 to 3 hr) might be reasonable, with regard to the majority of participants reporting pain duration of less than 3 hr.
Also, our preliminary evaluation of the inventory faces several limitations. We evaluated the QIPS with a sample of young undergraduate and graduate students. Thus, we cannot control for possible age-related differences yet. Further evaluations including older participants are needed. Furthermore, while we only investigated the agreement of the QIPS with the four pain-related items of the SCL-90r, its agreement with other scales and questionnaires should be addressed. In general, it should be noted that the QIPS just represents a small, systematic, and comprehensive way to obtain self-reports on pain experience. The inventory is designed to collect data to (a) stratify groups based on pain frequency (pain vs. no pain) by location or (b) control for within adjusted analysis. While we designed the QIPS to our needs for experimental research in nonclinical samples, it might be of interest for use in large-scale epidemiological studies.
Conclusion
The QIPS is a fast and easy-to-use inventory to assess the frequency and intensity of pain in different locations within the last week. Further studies are needed to validate the inventory and its psychometric properties and to evaluate its use in different populations and research settings.
Footnotes
Acknowledgements
Declaration of Conflicting Interests
The author(s) declared no potential conflicts of interest with respect to the research, authorship, and/or publication of this article.
Funding
The author(s) received no financial support for the authorship of this article. We thank Prof. Andreas-Norbert Fay for his continuous and generous support of our pain research at the Lab for Pain Research at the SRH University Heidelberg.