
Abstract
Educators and parents are increasingly concerned about effects of high-stakes testing on children who may not be developmentally ready to perform tasks according to rigorous standards of today’s kindergartens. In response to this issue, and to provide new psychometric data for the Gesell Developmental Observation (GDO), Gesell Institute conducted a nationwide study with nearly 1,300 children aged 3 to 6 years. Results confirm that children are able to perform developmental items according to a sequential trajectory of increasing difficulty, relative to their chronological age in 6-month intervals, and that performance mastery on items does not occur at the same time for all children of the same age. Results support the continued use of the revised GDO, now named the Gesell Developmental Observation–Revised (GDO-R), as an instrument to determine a child’s developmental level along a continuous path of growth and learning. Also discussed is the importance of establishing effective and appropriate academic goals based on a child’s developmental assessment results.
Keywords
Introduction
Promoting academic expectations that are inappropriately aligned with a child’s development creates unrealistic levels of achievement for young children. As the problematic No Child Left Behind legislation saw many children indeed left “behind,” American educators and policy makers advocated for more consistent and rigorous standardized learning benchmarks for younger children, resulting in the Common Core State Standards for Kindergarten to Twelfth Grade in 2010. While these standards represent a widespread initiative to try to close the achievement gap and provide accountability through test scores, many early childhood advocates question their appropriateness and whether or not they are achievable.
Many policy and decision makers appear to be obsessed with the educational idea that sooner is better when it comes to learning core knowledge. Jean Piaget (1896-1980), an influential Swiss child psychologist, referred to the American fixation that children should learn “sooner and faster” as “the American disease” (Guddemi & Zigler, 2011). Teaching academic tasks to children at earlier ages will not result in greater learning for the vast majority of children, due to the developmental trajectory of child development and individual differences among children. Furthermore, increased testing will not help or hasten the process. In fact, testing is very unreliable with young children under age eight. Experts have determined there is a 40% correlation between intelligence tests administered prior to kindergarten and results on achievement tests in third grade (Kim & Suen, 2003). However, informed parents, educators, and advocates of young children seek effective ways to establish academic goals for young children which correspond appropriately to developmental level, including social, emotional, and adaptive capacities.
A tool that addresses this need is the Gesell Developmental Observation–Revised (GDO-R) which is an instrument that evaluates a child’s performance on a series of developmental and academic tasks in relation to the sequential ages and stages of typical child development in the cognitive, motor, language, and social/emotional/adaptive domains. The results of the GDO-R reveal a child’s overall Developmental Age and Performance Level Ratings in each of the four domains at a point in time. Developmental age is an age in years and half years which best describes a child’s collective behavior and performances on a developmental scale. A Developmental Age may differ from the child’s chronological age, being lower, higher, or the same. Knowing each child’s Developmental Age enables educators to customize developmentally appropriate academic experiences and expectations to best meet the learning needs of every child.
Arnold Gesell, PhD and MD, developed an assessment of human development, identifying the ages and stages of child development based on his maturationist theory (Gesell, 1925). He published the original Gesell assessment, known today as the GDO-R. It was updated in 1940 and 1965. In 1979, Ames, Gillespie, Haines, and Ilg published Gesell Institute’s The Child From One to Six: Evaluating the Behavior of the Preschool Child with updated technical data for the GDO. In 2011, after a nationwide study of 3- to 6-year-old children, the newly revalidated and revised GDO-R was published.
This article presents the psychometric results for each of the tasks on the GDO-R, indicating the typical ages at which specific developmental and academic tasks, needed for realistic, developmentally appropriate success in kindergarten, are mastered. Reliability and validity evidence are also reported to support the continued use of the GDO-R as a developmental assessment for children aged 3 to 6 years. Three tasks are discussed to illustrate the need to establish effective and appropriate academic goals based on a child’s developmental assessment results.
Literature Review
Experts have stressed the significance of the kindergarten year as it relates to the child’s development and the child’s ability to succeed within the school environment. Kindergarten sets the tone for learning and future school success (Black, 2008; Guddemi & Zigler, 2011). Embarking on new learning creates numerous opportunities for the development of the child not only in areas of cognitive, social, emotional, and physical growth, but also as an individual within a community. Life-long, vital skills are acquired through the learning opportunities presented within the kindergarten environment.
With an increased emphasis placed on rigorous new standards and accountability, educators and parents are faced with new challenges relating to school readiness and the kindergarten curriculum. Schools play an important role in readiness; however, various schools have different expectations regarding readiness. A child may be considered prepared for one school environment and not prepared for another based on that particular school’s expectations for readiness (Maxwell & Clifford, 2004). Parents and educators are concerned due to the increase of pressures and demands within early learning environments. The academic expectations of today’s kindergarten are set similar to the achievement levels of first grades 20 years ago (Almon & Miller, 2011; Miller & Almon, 2009).
Although there is much discussion related to the readiness of incoming kindergarten children, it is a school’s responsibility to educate children who are legally of age to attend school. Most states require children to attend school by a certain age regardless of their readiness or skill level. On the flip-side, there is also a need for schools to be ready for the child. It is widely accepted that school readiness is multidimensional (Ewing Marion Kauffman Foundation, 2002; National Education Goals Panel, 1997) and encompasses the following areas: physical well-being and motor development, social and emotional development, language development, approaches to learning, and cognition and general knowledge (National Education Goals Panel, 1997). Therefore, to be ready for the child, all of these areas must be addressed by the school. Furthermore, it is essential that schools, communities, and families acknowledge gaps in each child’s educational abilities that can occur based not only on individual differences in normal development but also on such factors as birth weight, nutrition, television viewing, parent–child ratio, children’s exposure to language and literacy, and parental involvement and participation in the child’s well-being.
Despite a national focus on early childhood education, current research suggests that educational gaps continue to exist and that achievement gaps occur prior to the beginning of elementary school (Langham, 2009). It has been suggested that high-quality early education in combination with high-quality kindergarten through third-grade programs plays a critical role in attempting to close educational gaps and potentially contributes to enhancing the child’s development, school readiness, and future school success. Long-term effects of a quality pre-kindergarten experience can affect grade retention, placement, special education, and school dropout rates (Barnett, 1993; Campbell, Ramey, Pungello, Sparling, & Miller-Johnson, 2002; Mead, 2008). Unfortunately, not all children have the opportunity to participate in a high-quality pre-kindergarten program.
A consistent characteristic of high-quality pre-kindergarten and kindergarten programs is the reliance on developmentally appropriate practices (DAPs) for each child based on each child’s needs. DAP is defined by the National Association for the Education of Young Children (NAEYC) as knowing where a child is developmentally, providing unique experiences based on his or her stage of development that are both challenging and achievable, and possessing knowledge about how young children learn. The organization supports educators in “promoting young children’s optimal learning and development” (Copple & Bredekamp, 2009, p. 16). NAEYC’s DAP encourages educators to provide learning opportunities that will enhance all areas of a child’s development and to understand that a child’s development follows a well-documented, sequential order. DAP is based on being aware that each child develops at his or her own unique rate and that learning opportunities need to be challenging, but within the child’s ability. Understanding a child’s development is key to setting expectations that are appropriate and to planning curriculum that meets the child’s needs and abilities. Early educators need to adhere to methods and practices of teaching that foster a child’s development with learning being concentrated in all areas of development—cognitive, social, emotional, language, and physical (Kagan & Reid, 2009).
To plan DAP, assessing where a child is on the path of development is essential in determining what experiences a child is ready for. This use of readiness assessments should never exclude children from learning opportunities, but rather help determine how and what educational and learning experiences should be developed and/or modified to meet the child’s developmental level (Gullo, 2005). Through documentation and assessment, an educator is better able to understand the child. These instruments offer insight into a child’s development and his ability to learn, making learning visible to the educator (Seitz, 2008). As learning is multidimensional, it is important for an assessment to be used as a tool to help educators better understand children, their development, and how they learn (Tomlinson, 2008).
About the GDO-R
The GDO-R is a standardized, performance-based, criterion-referenced developmental assessment tool. It is designed for children from 2½ to 9 years of age and is used to inform educators and parents about a child’s progress on developmental continuums. This information helps to set appropriate expectations for performance as well as instruction for children based on their developmental stage or level. When combined with the Parent/Guardian Questionnaire (PQ) and the Teacher Questionnaire (TQ), the GDO-R functions as a comprehensive assessment system. The GDO-R can also help determine whether or not a child may need further diagnostic evaluations to suggest appropriate planning or remediation in specific areas of development.
The purpose of the GDO Study was to provide updated technical data and reliability evidence for 17 of the 19 original tasks on the ©2007 GDO (see Table 1); two tasks that were intended for assessing older children, Right and Left and Visual III, were omitted. Another purpose of the GDO Study was to define Overt Behavior (Task 20) and to strengthen the social/emotional/adaptive domain (Task 21). The criterion that shaped this study, and subsequent outcomes, was based on three sources of information:
Scientific data collected on a nationwide sample of nearly 1,300 children. This technical data provide information about how children across the United States performed on all GDO-R tasks, and it can be used to compare a child’s performance to that of typically developing age-matched peers.
Knowledge and experience of professionals who teach and work with children in each age band. A panel of nationally recognized experts with extensive experience in the field of child development reviewed the GDO-R performance level definitions as a tool for examiners to confirm a child’s overall results on the GDO-R.
Well-established research findings and theoretical frameworks. Children grow and mature through a series of predictable stages in a sequential order. Their development is dynamic, continuous, and reflects a pace unique to each child.
GDO-R Tasks.

Note. GDO-R = Gesell Developmental Observation–Revised.
Method
The GDO study consisted of several sub-studies designed to collect both quantitative and qualitative data. Quantitative data were collected on children in seven age bands (spanning ages 3-6 years) and is reported here. Examiners administered a total of 167 items in one-on-one sessions with children. Data were also collected for each child from the teacher’s observation of the child in the classroom (45 items) and from the parent’s observation of the child at home (78 items).
Qualitative data were collected on two developmental tasks on the GDO, the Copy Forms and Incomplete Man, as part of the Gesell Institute National Lecture Staff (NLS) Review Study. The purpose of the NLS Review Study was threefold: to collect data on the qualitative features of each developmental stage for Copy Forms and Incomplete Man, to establish inter-rater reliability for each Copy Form item, and to establish inter-rater reliability for assigning a Developmental Age to Copy Forms and Incomplete Man samples.
GDO Study Timeline
The GDO Study was completed over the course of 3 years following American Educational Research Association (American Educational Research Association, American Psychological Association, & National Council on Measurement in Education, 1999) standards. A timeline is presented in Figure 1 to provide context and sequence for the data activities and analyses of the GDO Study. The steps in the timeline are as follows.

Overview of GDO study timeline.
Review of Child Development Literature
A comprehensive review of child development literature on observation, assessment methodology, and assessment instruments for children ages 2½ to 9 was undertaken. The GDO instrument was evaluated as a whole based on appropriateness of developmental tasks to early educational goals for young children, culturally sensitive measurement approaches, and consistency with developmental capabilities of children between the ages of 2½ to 9.
Content Validity
After a careful review of the literature and with the results of a Bias Review, the research team felt the items on the GDO instrument remained relevant with the exception of two items. The GDO Study was designed to collect updated technical and baseline data using the ©2007 GDO as the basis of the investigation to renew the reliability and validity evidence for the instrument. In addition, the PQ and the TQ were developed to address the social, emotional, and adaptive development of the child.
Procedures for Reducing Bias
The five experts who reviewed the GDO for bias also evaluated content and age appropriateness for each task. The team was selected from the fields of early childhood education, special education, physical movement, and test development. Each reviewer was asked to respond to a set of specific questions, to identify any biases inherent in the content or methodology of the GDO. The bias review questions can be found in the full Technical Report (Gesell Institute of Child Development, 2012) at www.gesellinstitute.org.
Several GDO tasks raised issues due to a current lack of cultural relevancy. One item within the Interview task asked the child about his or her most recent birthday celebration, and ability to recall presents that he or she received. This question was omitted from the Naming Animals because it failed to allow for the breadth and complexity of birthday celebrations in different cultures and by families with lower socioeconomic circumstances. Another item in the Interview task prompts the child to name animals, presuming all children have had the experience of visiting a farm or zoo. This question was revised to “Have you ever been to or read a book about the zoo or a farm?” Also, a new question about watching television was added to the Interview to elicit more exchange with the child for a language evaluation.
Online User Survey
Prior to the commencement of the study, an online survey of GDO users was conducted to collect information on how customers use the GDO. A sample of N = 153 respondents provided feedback. A summary of the questions and quantitative results can be found in the full Technical Report (2012) Appendix A.
Focus Group
A focus group held at a Massachusetts preschool was moderated by a member of the Mid-Continent Research for Education and Learning (McREL) research team. The purpose of the focus group was to gather information on qualitative improvements to the GDO that would be most meaningful to examiners, in addition to the updated technical data, which were collected to renew the validity of the instrument.
TQ and PQ
It was recommended by all reviewers that the GDO-R include a measure of emotional regulation and social behavior by surveying the child’s teacher and parent or guardian. After reviewing the literature on emotional, social, and adaptive behaviors and examining multiple existing parent and teacher questionnaires, the TQ and PQ were developed for the GDO Study.
Procedures for Recruiting Examiners and Distributing Materials
Each site that enrolled in the study signed an agreement and secured parental consent forms for each participating child (Gesell Institute of Child Development, 2012).
Trained examiners administered all designated items on the GDO to children within the study age band (see Table 2) in individual assessment sessions. A standardized script guided the examiner in the administration of each task. Examiners in the study did not score or determine a Developmental Age. Data were collected from three sources at each school: the child (GDO tasks-GDO), the parent or guardian (PQ), and the child’s teacher (TQ).
Chronological Ages of Children Included in Each Age Band.
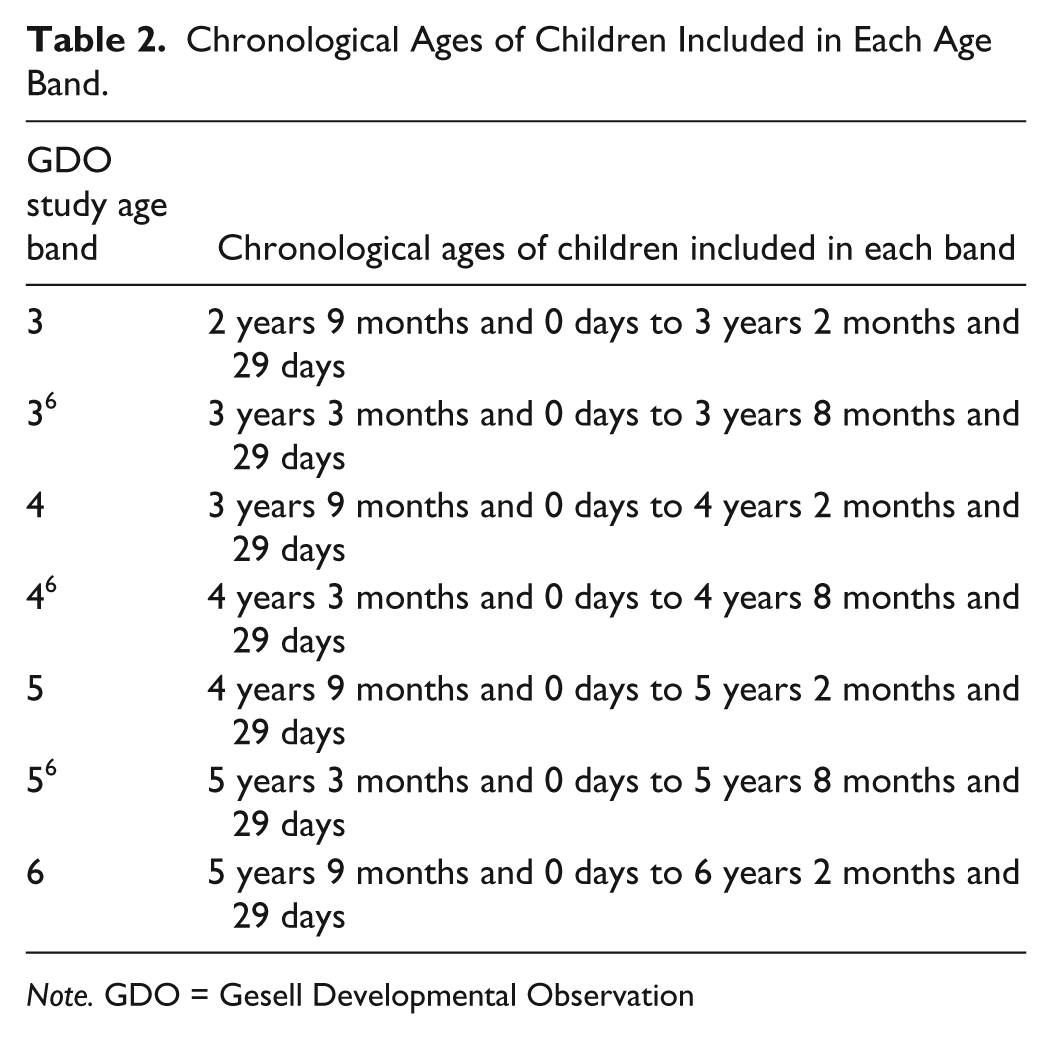
Note. GDO = Gesell Developmental Observation
All GDO assessment forms and study materials were provided to each school free of charge, including return shipping and handling. A Training DVD was given to each site to standardize the training for all examiners in the study. A conference call was held between each school’s examining team and the Gesell research team to review study protocol, answer questions, and offer support. Assistance was also supplied by phone, e-mail, and fax throughout the entire course of the schools’ participation in the study. Each site returned hardcopies of all data forms to Gesell Institute for review, validation, cleaning, and data entry.
Research Sample
The research sample was primarily a sample of convenience drawn from a national population of typically developing children attending schools that administered the GDO. A subset of schools from New Haven, CT, also participated in the study. Examiners for these schools were trained at Gesell Institute, as the schools did not currently utilize the GDO but wanted to participate in the study.
The final sample for analysis for the GDO Study included 1,287 children from 53 geographically diverse sites in 23 states. While the assessment is designed for ages 2½ to 9 years, the researchers chose to limit hands-on data collection to the group of children that comprised the largest number of users of the GDO. The chronological age threshold for each age band is described in Table 2. The age bands targeted for data collection were 3, 3½, 4, 4½, 5, 5½, and 6.
Site Sample
The sample included a diverse group of sites in terms of the type of school, region of the country, size, and population served (i.e., ethnicity and percentage eligible for free and reduced lunch). Refer to Figure 2 for sample distribution by state and Tables 3 to 5 for demographics of participating sites.

Sample distribution by state.
Descriptive Statistics for Participating Sites: School Type.

Note. GDO-R = Gesell Developmental Observation–Revised.
Descriptive Statistics for Participating Sites: U.S. Region.

Note. GDO-R = Gesell Developmental Observation–Revised.
Descriptive Statistics for Participating Sites: Ethnicity and Socioeconomic Status.

Note. Numbers in parentheses are standard deviations. Eligibility for free/reduced lunch program is used as a representative variable in the sample for lower socioeconomic level.
Examiner Sample
One hundred and one trained GDO examiners, with a mean of 12 years teaching experience, collected GDO data from children at preschool and elementary schools across the nation. The group of examiners, with a mean of 7 years GDO experience, received GDO training in one of two ways: (1) in the last 5 years through a 3-day workshop or (2) a 1-day training session at the Institute. Of the examiner sample, 75% were currently teaching and 25% reported that they were retired, no longer teaching in a classroom, or were volunteer examiners. Approximately 88% of the GDO study examiners have a bachelor’s, master’s, or doctoral degree. Refer to Table 6 for examiner’s level of education.
Examiner Demographics: Level of Education.

Data Validation and Entry Procedures
Data were systematically reviewed for completion, accuracy, and any possible serious administration errors prior to being entered into an electronic survey gizmo file. Unusable data were put aside. Ten percent of the data entered in each of the data sets (GDO, TQ, and PQ) was checked by a team of interns and any keystroke or scoring errors were corrected. A subsample of data collected in New Haven, CT, by a team of subcontractors was also checked for accuracy and reliability by members of the research team.
A total of 1,363 GDO assessments were submitted to Gesell Institute for evaluation. After careful review for accuracy, proper administration, and age requirements, a final sample of 1,287 GDO assessments were used in the final analysis. Thus, 5% of the sample could not be used and was deleted from the original sample. Over the course of 2 years, communication with new sites about data collection/submission procedures improved significantly, and thus further reduced the number of invalid assessments (i.e., child was too young or old for the study, etc.) that were submitted by each site.
Results
Sample Descriptive Statistics
The final sample used for analysis was a proportional mix of boys and girls in each age band (3.0-6.0 years) from ethnically diverse backgrounds. The number of children in each age band varied (see Table 7).
Overview of Gesell Developmental Observation Study Sample Child Descriptive Statistics by Age Band.

Note. Missing data for the child’s native language occurred when Parent/Guardian Questionnaires (PQs) were not returned. In such cases, a shortened form of the PQ (Child Demographic Form) was modified so that basic demographic information could still be collected from school records for participating families (sex, ethnicity, DOB, Native language). Missing data for ethnicity are within the acceptable limit. Missing data for native language do not affect findings because all children were administered the assessment in English and had to be deemed fluent by the teachers who administered the assessment.
Task Descriptive Statistics by Age Band
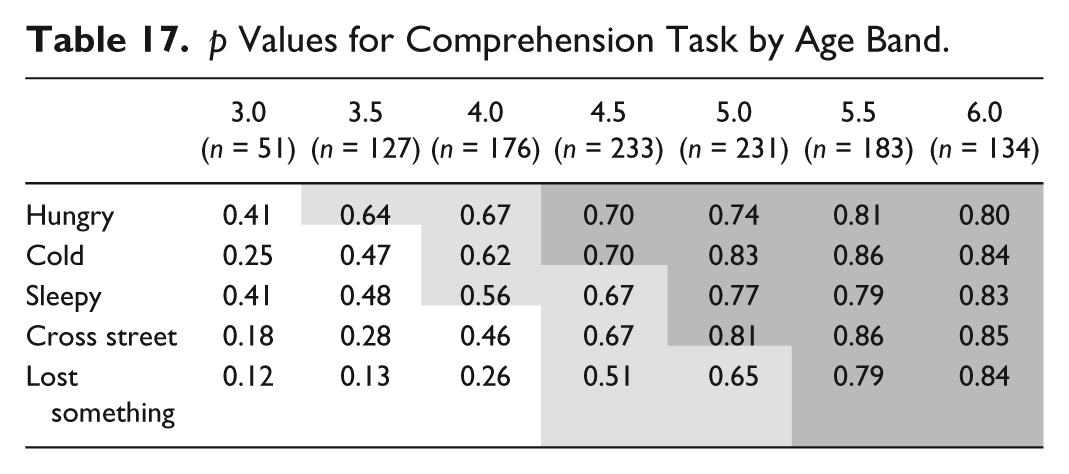
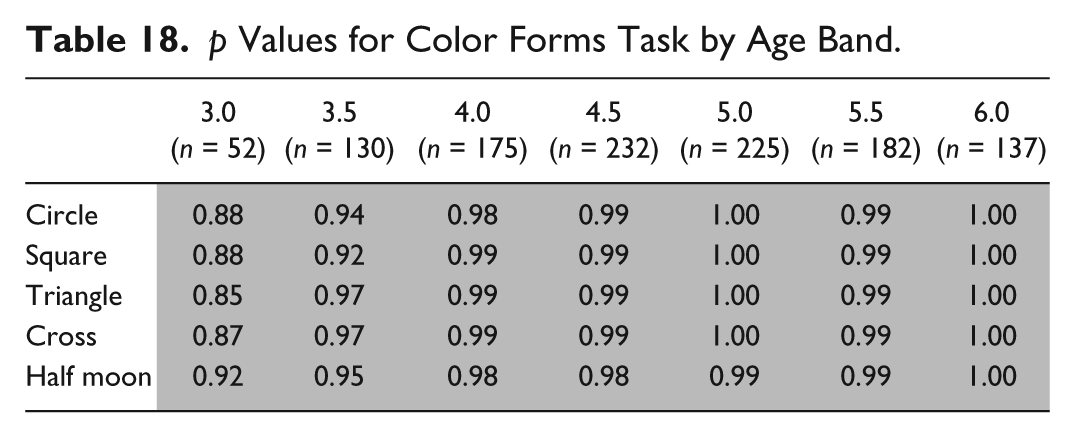
The p value represents the proportion of children who provided the correct responses to the item (scored with 0, 1). For polytomous items (scored with 3 or more score points; for example, Incomplete Man scored according to level of cues, or Cubes scored according to performance with or without a demonstration), the p value represents the average proportion of the maximum possible score children received. With few exceptions, Tables 8 through 29 show growth in performance on the GDO tasks across age bands.
p Values for Cubes Task by Age Band (Polytomous Items).

Note. In Cubes, examiners were instructed to administer each item, and provide a DEMO if required. Each item was scored using three categories: successfully completed without DEMO (2), successfully completed with DEMO (1), unsuccessful (0).
p Values for Writing Name Task by Age Band.

Descriptive Statistics for Writing Numbers Task by Age Band.

p Values for Copy Forms Task by Age Band.

Note. In Copy Forms, examiners were instructed to administer each item, and to administer demonstrations (DEMOS) if required. However, for the purpose of the study, each item was scored (0, 1) regardless of any DEMO required.
p Values for Incomplete Man Task by Age Band (Polytomous Items).

Note. The number of body parts included for Incomplete Man task in the study was 13. These include Knot, Other-1, and Other-2 that are not customarily part of the standard Gesell Developmental Observation–Revised (GDO-R) administration. Thus, the mean number of body parts is relative to a denominator of 13, rather than 10. During data collection, examiners were instructed to use appropriate cueing if required, and to score each body part added into four categories: Body part added Spontaneously (3), Body part added following a General Cue (2), Body part added following a Specific Cue (1), or Body part not added at all (0).
p Values for Visual I Task by Age Band.

Note. In the Visual I task, the first item was a teaching item (triangle), and “recognizing the skip” was an item scored as part of the total (12). Standard deviations are indicated in parentheses.
Number of Animals Named by Age Band.

Note. In the Naming Animals task, the total number of items in the task was predetermined to be 60 as a baseline for all age groups.
p Values for Prepositions Task by Age Band.

p Values for Digit Repetition Task by Age Band.

Note. Administration was terminated when child unsuccessfully repeated two out of three digit sets in the row.
p Values for Comprehension Task by Age Band.
p Values for Color Forms Task by Age Band.
p Values for Three-Hole Form Board Task by Age Band.
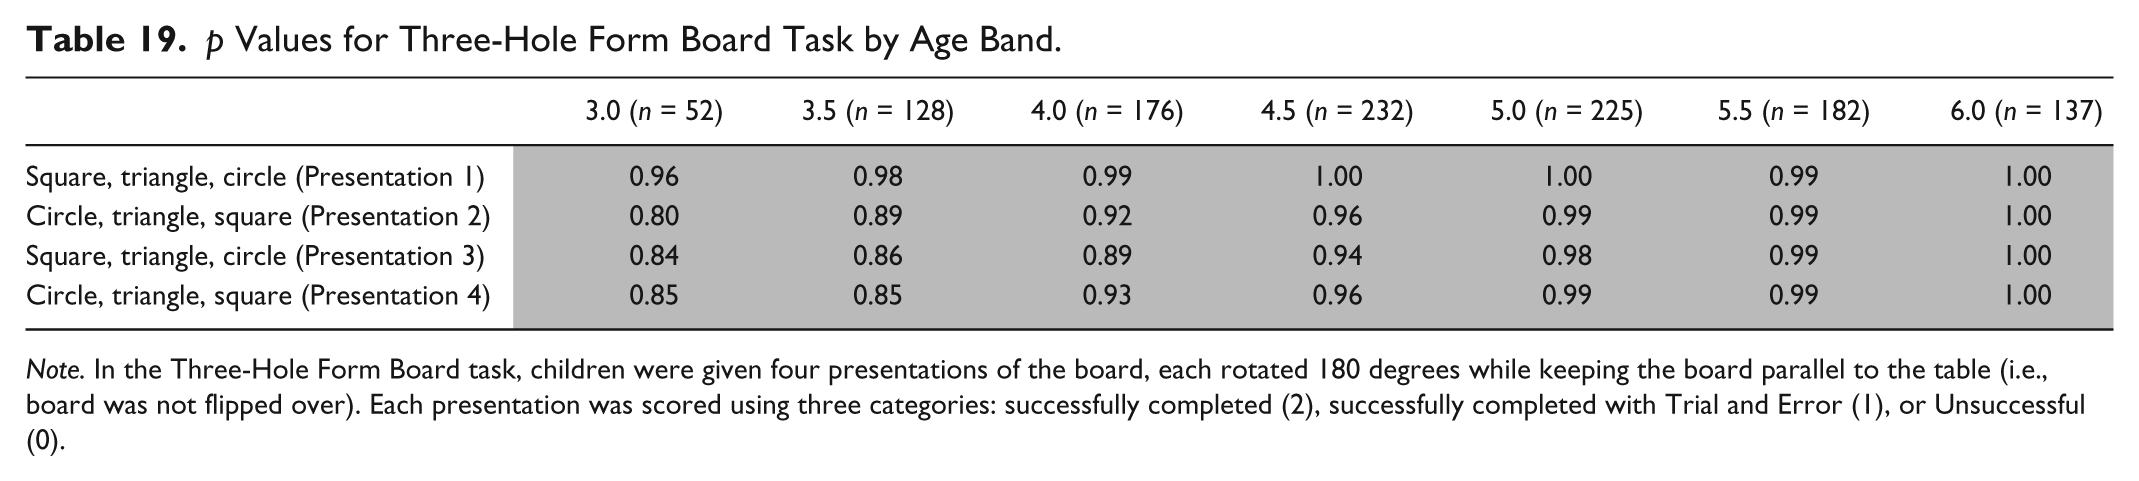
Note. In the Three-Hole Form Board task, children were given four presentations of the board, each rotated 180 degrees while keeping the board parallel to the table (i.e., board was not flipped over). Each presentation was scored using three categories: successfully completed (2), successfully completed with Trial and Error (1), or Unsuccessful (0).
p Values for Action Agents Task by Age Band.
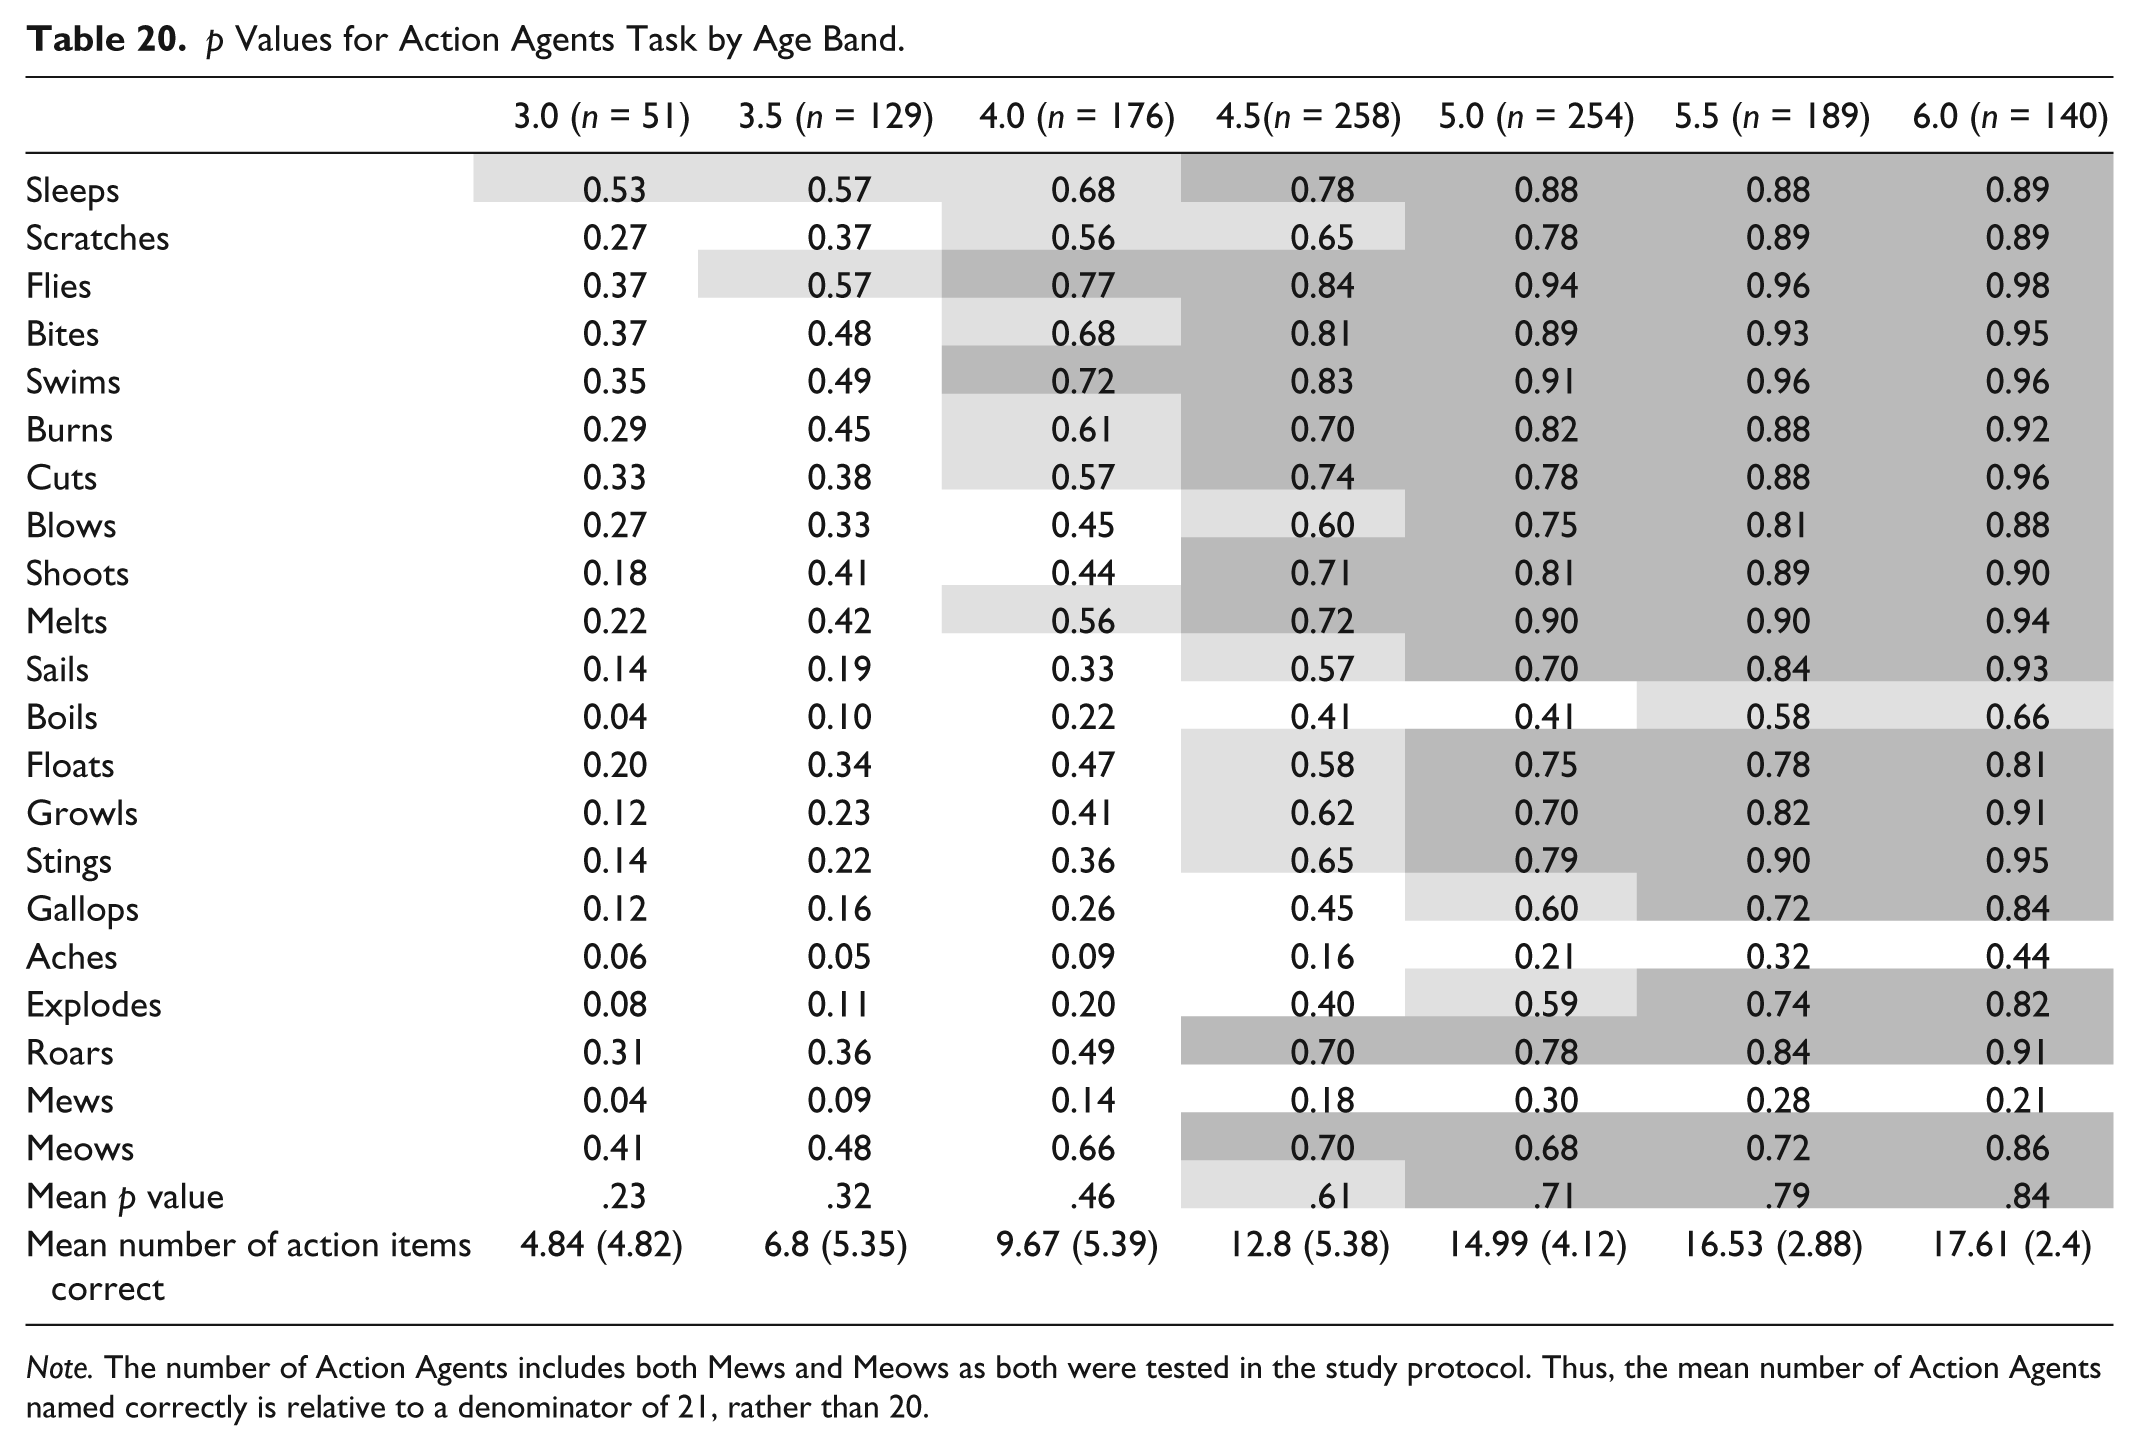
Note. The number of Action Agents includes both Mews and Meows as both were tested in the study protocol. Thus, the mean number of Action Agents named correctly is relative to a denominator of 21, rather than 20.
p Values for Identifying Letters Task by Age Band.

p Values for Identifying Numbers Task by Age Band.

Descriptive Statistics for Counting Task.

p Values for One-to-One Correspondence and Conservation Tasks by Age Band.

p Values for Calculations Task by Age Band.
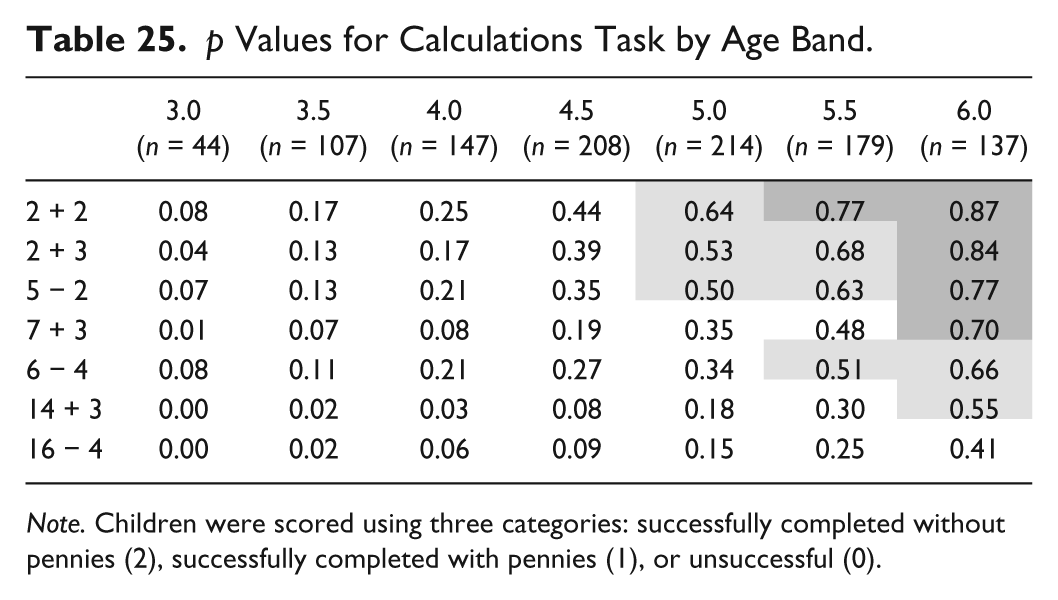
Note. Children were scored using three categories: successfully completed without pennies (2), successfully completed with pennies (1), or unsuccessful (0).
Descriptive Statistics for Pellets Task.

Frequency Distribution for Distinguishing Features: Pencil Stroke by Age Band (%).

Frequency Distribution for Distinguishing Features: Pencil Grasp by Age Band (%).

p Values for Motor Items by Age Band.

Note. In the Motor tasks, each item was scored according to varying levels of response: Walk on Tiptoe (0-3), Jump in Place (0-2), Stand on One Foot (0-5), Hop on One Foot (0-2), Skip (0-2), Jump (0, 1), Beanbag Throw (0-3), and Beanbag Catch (0-4).
Some tasks/items have been organized into separate tables because they require different statistical operations to best demonstrate the findings. These are as follows:
Tasks that contain continuous items that are scored from 0 to a maximum number: the number of numerals written, and the number of those numerals that were in sequential order (Table 10); the number of animals named (Table 14); how high the child counted (Table 23); and the number of seconds for dominant hand pellets (Table 26). Also included are Social/Emotional/Adaptive Items (Table 30). Because the items are scored in terms of a maximum number, means and standard deviations provide better evidence than p values regarding children’s performance.
Tasks that contain categories: items from Distinguishing Features and Overt Behavior. These items were analyzed using a frequency distribution, because means and standard deviations were not appropriate. These are not reported here.
Mean Scores of Social/Emotional/Adaptive Items.
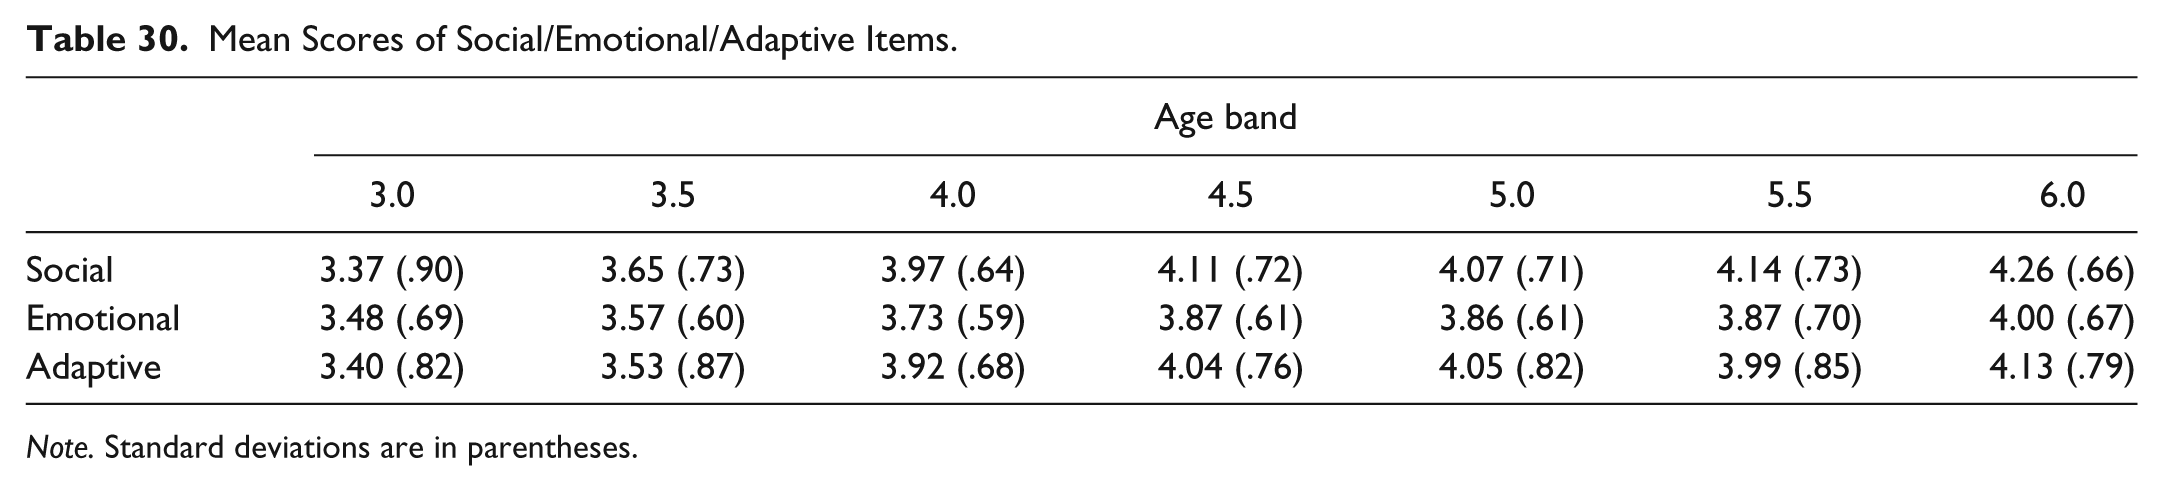
Note. Standard deviations are in parentheses.
Item p Values by Task and Age Band
Tables 8 through 29 provide results for the GDO-R items by task and age band. The tasks are described in order of test administration. Some item responses were missing when children did not provide an answer to an item or were not administered an item because they gave incorrect responses to the number of previous items that met the stop rule. Missing item responses were treated as incorrect for these analyses.
The p values for items within a task tend to reflect the fact that items gradually increase in difficulty. For this reason, p values tend to be somewhat higher for earlier items and lower for later items. p values also reflect children’s increased competency with age; p values are lower for the younger children and higher for the older children. Dr. Gesell utilized two levels for identifying developmental competence, successful or not successful, on items and tasks at a 51% benchmark. The results presented here utilize three Performance Level Expectations for each GDO-R task, rather than two. The criteria set for each expectation were established using a developmental framework of growth and learning in which a child acquires the capacity to succeed at more difficult items after having mastered the less complex items which precede it. They are shaded accordingly:
Solid Expectation (SE)—over 70% of the children could complete the task (dark gray shading)
Qualified Expectation (QE)—50% to 69.9% could complete the task (light gray shading)
Not Yet Expected—under 50% of the children could complete the task (no shading)
The Performance Level Expectations for each task reflect responses of a large group of children of the same age in the sample that were able to complete the task independently, without demonstrations or cues from the examiner. Typical GDO-R administration allows for demonstrations and cues for some items because it allows the examiner to differentiate between developmental levels and also reveals the child’s approach to the task, especially when they are challenged by an item or task. In this article, we report on Solid Expectation, over 70% of the children could complete the task.
Content-Related Validity
Content-related validity is evidenced by uniformity between task content and the developmental milestones widely accepted to precede instructional content in each area. To ensure such correspondence for the GDO-R, Gesell Institute conducted a comprehensive review of current child development theory and met with education experts to determine common educational goals and the knowledge and skills emphasized in today’s early childhood curricula. The graphic design of the assessment and its manipulative materials reflect the types of activities found in early childhood classrooms and in children’s everyday lives. An online user survey provided additional information regarding overall assessment effectiveness (addressing such topics as the appropriateness of the criteria for developmental age, ease of administration, and appropriateness for each age). These validation efforts resulted in an assessment that reflects the needs of classroom teachers, children, and parents.
Inter-Rater Reliability
Four NLS members participated in the Qualitative Review Study. Three hold a master’s degree in Early Childhood and/or Child Development, and one a bachelor’s in Child Development. Collectively, the Qualitative Review Study team held over one hundred years of experience administering the GDO and conducting Gesell workshops on topics such as school readiness, parent involvement, and child development.
Inter-rater reliability of the GDO-Revised provides evidence regarding the degree to which Developmental Age can be reliably assigned. The inter-rater reliability study included a subsample of children’s performance on the Incomplete Man and Copy Forms tasks. Table 31 describes the sample used in the inter-rater reliability study. The sample for Incomplete Man was smaller than the sample for Copy Forms, because some children were rated as unable to score by one or both raters.
Inter-Rater Reliability Study Sample.

Inter-rater reliability was calculated by comparing the agreement between the developmental ages assigned by Rater A and Rater B of Team 1 for each task. During Phase 1, Rater A and Rater B of Team 1 rated Copy Forms, while Rater A and Rater B of Team 2 rated Incomplete Man. Inter-rater agreement for assigning overall Developmental Age was calculated for Copy Forms and Incomplete Man samples. Inter-rater agreement was also calculated for each individual Copy Form item in Phase 2.
During Phase 1, for both Incomplete Man and Copy Forms, neither team had access to the child’s chronological age; the raters used only the actual work samples and process sheets of the children in the sample. Inter-rater agreement on developmental age, as measured by the Pearson product moment correlation, was high for both Incomplete Man and Copy Forms (see Table 32). These high correlations provide evidence that developmental age can be reliably assigned by trained raters using the GDO-R.
Inter-Rater Agreement Evidence for Developmental Age.

Note. IM = Incomplete Man; CF = Copy Forms.
In addition, each rater was asked to rank order all the children in the sample by developmental age. The rank order correlation (Spearman rho) presented in Table 32 provides further evidence of the reliability of developmental ages as assigned by trained GDO-R administrators. The agreement between the two raters’ overall developmental age rankings was high for both Copy Forms (.91) and Incomplete Man (.92), showing that raters ranked the children by developmental age very similarly.
Finally, to examine the degree to which the Developmental Age assigned by raters corresponded to the children’s actual age (i.e., chronological age), the Pearson product moment correlations between Developmental Age and chronological age were calculated. Correlations were calculated separately for Rater A and Rater B. These correlations were high (range = .78-.82), and in the expected range, providing evidence that the assigned Developmental Ages corresponded closely, but not exactly, to children’s chronological age (see Table 32). Perfect correlations are not expected because of the variation in development between children.
In Phase 2, Table 33 presents results of inter-rater reliability for Copy Forms items. Raters used the same children’s work samples as were used in the examination of the reliability of Developmental Age (Phase 1). However, each team of raters that conducted the inter-rater reliability for Incomplete Man during Phase 1 subsequently conducted the inter-rater reliability for Copy Form items for Phase 2, and vice versa. For item inter-rater reliability of individual Copy Forms items, raters also had access to children’s chronological age, because this is the standard scoring practice. Sample sizes varied by item, because some children were rated as unable to score by one or both raters.
Inter-Rater Reliability for Copy Forms Items.

Note. n = sample size; M = mean; SD = standard deviation; r = Pearson product moment correlation coefficient.
The results in Table 33 indicate strong correlation between raters for each Copy Form item. In addition, the means and standard deviations for Rater 1 and Rater 2’s scores are very similar. It is important to note that for Cube Face-on and Cube Point-on items, a proportionally large number of children were rated as unable to score by both raters. All children who could be scored received a score of 0, resulting in an inter-rater reliability of 1.00. Cube Face-on and Cube Point-on are some of the most difficult items in the entire GDO-Revised. Very few 6-year-old children in the entire study sample received a correct score on these items.
Limitations
The GDO Study contributes a comprehensive sample of child development data to the educational field at large. As with any study of its size and scope, it has limitations. The distribution of child ethnicity across the total sample more closely resembled the U.S. Census than did the distribution of child ethnicity in each age band. Thus, interpretation of change across age bands could possibly be attributable to a sample shift as opposed to a definitive age shift. In the case of the PQ, the percentage of missing data for child’s ethnicity was strongly mitigated by efforts on the part of the school and research team to gather this information from other school records (as reported by parents). However, since the native language of the child was also derived from the PQ, efforts to collect accurate information on a child’s native language from the school were less fruitful, and resulted in higher percentages of missing data across age bands. In some sites, it was not possible to administer the PQ due to the nature of testing at the site (i.e., GDO-R tests were part of admission protocol in private schools. These schools did not administer the GDO Study PQ because it contained questions that could be perceived to affect a child’s eligibility for school acceptance [special evaluations, services, level of education of parent]). In other sites, bussing of children in urban communities meant that parents did not physically come to the school to return a PQ or may have been reluctant to share such information with the school administration.
While the examiners were trained carefully on the GDO-R task administration, they did not receive recording and coding rubrics to score the following observations of the child during all tasks in the assessment: Paper Position, Head Shift, Body Posture, Non-Dominant Hand Posture, and Eye Movement. This may explain why observational data on these items contain missing cases (examiners did not complete the section of the form). Thus, a shortcoming of this study is that these items cannot clearly be interpreted. However, the Qualitative Review Study and Inter-rater Reliability Study strongly confirm the developmental characteristics of each age band as related to the Copy Forms and Incomplete Man tasks. This is very important because it provides recent validity evidence for these specific developmental tasks and allows for continual improvements to the training of examiners.
Implications
The most valuable implication of this research is that the GDO-R has renewed reliability and validity evidence to support its continued use as a developmental instrument to evaluate growth and development of children aged 3 to 6 years and to inform instruction for developmentally appropriate activities. The results from this study also support the original findings for developmental tasks as originally published by Arnold Gesell (Gesell, 1925). Children are developing and reaching the major developmental milestones at about the same time as they did when Dr. Gesell first started collecting date over a century ago.
A few of the important implications of the research for educators nationwide include the following:
Perceiving oblique lines is a prerequisite to letter formation and writing—two essential expectations in the kindergarten curriculum of today. Building the Gate (Task 1: Cubes) and copying the Triangle (Task 4: Copy Forms) require that the child not only perceive the oblique angle of the cube or the form, but is able to reproduce the structure in 3-D or on paper. The GDO study documents that this developmental capacity is solid only by age 5 (Task 1: Cubes–Gate) and 5.5 (Task 4: Copy Forms–Triangle). Educators must be alert to both variations in chronological age and developmental level to properly balance the pace and sequence of daily learning activities for each child.
Children correctly identify letters in the alphabet in a graduated process that is affected by age, experience, and exposure to the printed word. As such, the average 4.5 year old can successfully identify approximately 12 letters of the alphabet while a year later, at 5.5, they can identify 21 to 22 letters. Educators who attempt to teach writing letters before the age of 5.5 (when most children can perceive and execute the oblique lines of letters) are doing their young students a disservice, which may result in a child internalizing failed attempts at writing before his or her developmental capacity for the task exists. Taking the time to understand how developmental level can be leveraged for teaching will benefit both children and teachers.
Educators who are able to recognize when a child is beginning to conserve 10 or more items will likely find that the child can also begin to succeed at simple calculations which have final answers less than 5 (beginning around 5.5 years and solid expectation by 6). Until a child can conserve item sets of 13 to 20, his or her success at calculations will likely remain the product of memorization or chance, as opposed to concepts of true numeracy.
Conclusion
The results of this study, based on a culturally and socioeconomically diverse sample of children 3 to 6 years of age in seven age bands, provide evidence that children’s performance on developmental and academic tasks, as measured by the GDO-Revised, occurs in a sequential progression of mastery which increases with age. In addition, the results provide evidence that not all children of the same chronological age arrive at each developmental level for the same tasks at the same time. Thus, there exists variation in performance on developmental and academic tasks between children of the same age. Future research should include a more intensive analysis of the data by weighing variables such as child ethnicity, geography, and socioeconomic level to pursue stability in the findings.
It is essential that educators, policy makers, and parents understand the significance of developmental level when setting standards for all children. Because children in kindergarten are at various chronological ages and develop at varying rates, having the same set of standards and expectations for all children at a given time is both inappropriate and potentially harmful for children.
Utilizing standardized, performance-based instruments to understand a child’s developmental level, cultural and social influences, and individual interests allows for appropriate expectations, relevant goals for learning, and proper accountability in the educational system. Educators can utilize each child’s unique developmental profile to plan curriculum that respects the developmental level and potential of the child by using robust observational methods coupled with comprehensive developmental assessment tools.
The results of the GDO Study presented here strongly support the GDO-R as a reliable and valid developmental measurement tool, confirm the essential role that a child’s developmental level plays in his or her success for learning today, and suggest that having the same expectation for all children at the same time is inappropriate if not impossible.
Footnotes
Declaration of Conflicting Interests
The author(s) declared no potential conflicts of interest with respect to the research, authorship, and/or publication of this article.
Funding
The author(s) received no financial support for the research and/or authorship of this article.