
Abstract
Personality trait questionnaires are regularly used in individual differences research to examine personality scores between participants, although trait researchers tend to place little value on intra-individual variation in item ratings within a measured trait. The few studies that examine variability indices have not considered how they are related to a selection of psychological outcomes, so we recruited 160 participants (age M = 24.16, SD = 9.54) who completed the IPIP-HEXACO personality questionnaire and several outcome measures. Heterogenous within-subject differences in item ratings were found for every trait/facet measured, with measurement error that remained stable across the questionnaire. Within-subject standard deviations, calculated as measures of individual variation in specific item ratings within a trait/facet, were related to outcomes including life satisfaction and depression. This suggests these indices represent valid constructs of variability, and that researchers administering behavior statement trait questionnaires with outcome measures should also apply item-level variability indices.
Trait personality research takes the view that each individual possesses a set of stable traits to a greater or lesser degree, which can be measured using personality questionnaires (Costa & McCrae, 1992; Eysenck, 1947; Goldberg, 1992; Lee & Ashton, 2004). Research into person–activity fit suggests that to be satisfied with life, the individual needs to display personality traits that are suited to their goals or tasks. Happiness has been found to be higher in participants pursuing social goals supported by sociable traits (McGregor, McAdams, & Little, 2006), while different types of positive psychology intervention have also been found to be more suited to trait extravert or introvert individuals (Schueller, 2012).
There are also advantages for an individual to be able to respond to a variety of situational needs (Bem & Allen, 1974; Digman, 1997; Eysenck, 1947; McCrae & Costa, 1996; Saucier, Bel-Bahar, & Fernandez, 2007). Diary studies of Big-Five personality states have been conducted by Fleeson that show individuals display varied personality states across repeated state measurements (summarized in Fleeson & Gallagher, 2009). Intra-individual variability has also been found in the Interpersonal Circumplex (Moskowitz & Zuroff, 2004, 2005). Situational context has been found to have an effect on personality disposition (Church, Katigbak, & del Prado, 2010; Church et al., 2008; Fournier, Moskowitz, & Zuroff, 2008; Leszczynski, 2009; Robinson, 2009). The frame of reference for behavior has also been shown to be important in trait personality assessment when examined in organizational settings (Bing, Whanger, Davison, & VanHook, 2004; Bowling & Burns, 2010; Hunthausen, Truxillo, Bauer, & Hammer, 2003; Schmit, Ryan, Stierwalt, & Powell, 1995). These studies suggest both context-orientated items and instructions have an effect on responses in trait questionnaires, with work-related items or instructions leading to more positive responding, and being more valid in the organizational setting (than general instructions). Lievens, De Corte, and Schollaert (2008) found context to be associated with inter-item variations in responding, by imposing a frame reference on a non-contextual questionnaire. The frame of reference was found to reduce within-subject inconsistency in responding to non-contextual items. Such contextual dependence in trait questionnaire responding implies and requires the measurement of within-subject variations in general personality trait attributes. The contextual variation established at the broad trait construct level is a result of variations in different behaviors generally associated with the same trait. An examination of this kind of variation is rarely done or reported in personality trait research. Yet, according to McDonald (1999), measurement error of the constructs in a test remains moderately invariant, while the true components may differ.
Failing to account for true within-subject variation, as distinct from any measurement error, in a personality trait questionnaire means past research may have missed meaningful predictable relationships between intra-individual differences and outcomes. Past research has found personality traits to be related to a variety of behavioral acts (frequency of) and clinical indicators (Gruzca & Goldberg, 2007; Paunonen, 1998, 2003; Paunonen & Ashton, 2001), but has not distinguished between and within-subject variances separately.
A person’s contextual responsiveness may be revealed in the way in which personality trait measures are developed from item pools and analysis. The Cronbach’s alpha equation (Cronbach, 1951), for example, is a key statistic for measuring test reliability. Inter-item correlations are not always very strong (above r = .50) even in high reliability tests. Items correlating above r = .50 are likely to be too similar to be useful in a representative trait test for the wide spectrum of behaviors captured by that trait. This supports there being some meaningful true within-subject variation in the item ratings. This suggests some people may be displaying true within-subject variation in the item ratings within a trait, rather than displaying a strong trait disposition at either end of a trait dimension. When responding to personality trait questionnaires, individuals who do not display a strong trait disposition will display variations in their responses to highly specific behavior items, even if these items tap into a similar personality dimension. Consider, for example, these five behaviors that reflect expressiveness from the IPIP-HEXACO (Ashton, Lee, & Goldberg, 2007):
Talk a lot
Am never at a loss for words
Am the life of the party
Tell people about it when I am irritated
Have an intense, boisterous laugh
A respondent may give ratings that indicate they may talk a lot, but not tell people about it when they are irritated; or the respondent may be the life of the party, but not have an intense, boisterous laugh. Few studies have been conducted into this area in comparison to the mass of trait personality research available in the literature. The previous research into item-level variability, conducted from classical test and item response theory approaches, suggests that participants do display varied levels of consistency—sometimes called “traitedness”—between behaviors thought to tap into the same disposition (Baumeister, 1991; Biderman & Reddock, 2012; Britt, 1993; Dwight, Wolf, & Golden, 2002; Paunonen, 1988; Reddock, Biderman, & Nyugen, 2011; Reise & Waller, 1993; Shepherd & Belicki, 2008). This type of inter-item variability in responses has been found to display re-test stability (Baumeister, 1991) and is influenced by genetics (Hershberger, Plomin, & Pedersen, 1995). This would not be expected, particularly if the variation is due to measurement error. This variability is likely to be influenced by the difficultly of each item, which may be different for every participant (Reise & Waller, 1993), and item-specific variances that do not align solely with the trait construct it aims to measure. This may be because an item has different connotations for each participant, based on their personal experiences, that may cause meaningful changes in difficulty or its alignment with a particular trait construct for that individual.
There are reasons, therefore, to believe, that these variations in the different behavioral aspects of a trait validly measure variation in behavior of considerable importance in personality research, although the trait approaches appear to minimize it. Part of the reason for this may be that these indices have not been examined in relation to a wide range of psychological outcomes, which brings their validity into question. Recent research indicates that behavioral flexibility may itself be related to personal outcomes in health behaviors (Fletcher, Hanson, Pine, & Page, 2011), suggesting that within-subject variation may be important for well-being. The research reported here considers this issue—if item level within-subject variation is present (in a wide range of traits and facets), does this variation predict meaningful positive or negative psychological outcomes? If it does predict meaningful outcomes, then these indices would appear to be valid measurements of variability that should be applied in personality trait research to provide more information from the questionnaire.
To test whether the within-subject component of variation is valid, we first measure the extent of this variation in the HEXACO model and then consider how much of these variations can be considered true variation, rather than measurement error. Previous research found varied degrees of correlation in inter-item ratings and so we predicted that more variation will be explained by true within individual differences than error, which will be stable across traits or facets.
Within-subject standard deviations (WS SDs) of statement ratings within each personality trait and facet will be calculated as indices of variability. We will examine the WS SDs in relation to various outcomes including life satisfaction, anxiety, depression, self-pluralism, sensation seeking, and tendency toward habitual behavior. If the variability reflects useful responsiveness to particular behaviors within the attribute, the WS SDs are expected to correlate positively with life satisfaction and sensation seeking, and negatively correlate with anxiety, depression, self-pluralism, and tendency toward habitual behavior. This refers mainly to variation in item ratings for the emotionality (E) and extraversion (X) traits and sub-facets, as displaying extremes at either end of these attributes is not beneficial (being highly unemotional or emotional, or highly introverted or extraverted). For those WS SDs where variability of behavior might be detrimental, the opposite was expected. This mainly refers to variation in the honesty–humility (H), agreeableness (A), conscientiousness (C), and openness to experience (O) traits and sub-facets, as higher honesty–humility, agreeable, conscientious, and openness behaviors are generally considered positive trait qualities. It should be noted that there are reasons to believe the effect sizes for these correlations may not be as strong as in standard trait studies. First, the psychometric construction of trait questionnaires is designed to minimize such variability, even when it is “true” variability. Second, based on Britt (1993), the relationships between a dispositional outcome (traited) variable and an untraited variable display substantially lower effects than two dispositional (traited) variables.
Method
Participants and Procedure
A psychology department subject pool was used along with a smaller community sample to collect 160 adult participants via opportunity sampling (142 female, 18 male, Mage = 24.16, SD = 9.54, age range between 18 and 76). All participants accessed the study measures via the U.K. survey hosting site, Bristol online survey. One hundred and twenty of the participants (those recruited from the psychology school subject pool for course credit) completed all measures (113 female, 7 male, Mage = 20.94, SD = 4.73, age range between 18 and 46). For technical reasons, some measures were unavailable for the 40 community participants as these were collected earlier (specified in the measures section).
Measures
IPIP-HEXACO Personality Questionnaire
Developed by Ashton et al. (2007), the IPIP-HEXACO is based on the HEXACO-PI, which measures the HEXACO model of personality (Lee & Ashton, 2004). The IPIP-HEXACO measures the Big-Five and an additional honesty–humility trait, and 24 facets (4 for each trait). There were 10 items included in each facet scale. Behavior statement items were rated on a 5-point Likert-type scale (response options: 1 “very inaccurate,” 2 “moderately inaccurate,” 3 “neither accurate nor inaccurate,” 4 “moderately accurate,” 5 “very accurate”) to indicate the extent to which an item is characteristic of the individual, yielding a score between 10 and 50 for each personality facet (trait scores were divided by 4 to match this scale). The IPIP-HEXACO facet scales contain positively and negatively keyed items (the negatively keyed items were reverse coded prior to analysis). The IPIP-HEXACO items were in a randomized order when the questionnaire was administered. The IPIP-HEXACO facet scales have sound psychometric properties (Ashton et al., 2007) with Cronbach’s alphas ranging between .69 and .88 (Mα = .81).
Sensation seeking score
Sensation seeking was computed as an outcome based on an equation developed and reported in de Vries, de Vries, and Feij (2009) from the total facet scores for fearfulness, unconventionality, creativity, social boldness, sociability, fairness, and prudence. de Vries, de Vries, and Feij found this score to converge highly with other sensation seeking measures.
The Self-Pluralism Scale–30 (SPS-30)
The SPS-30 was developed by Altrocchi and McReynolds (1997) and consists of 30 items with a true/false response that measure the individual’s perception of how much their behavior varies across situations. The SPS-30 has been found to be highly reliable (α = .93; McReynolds, Altrocchi, & House, 2000).
Thoughts and Feelings Questionnaire
The Thoughts and Feelings Questionnaire from the FIT Profiler (Fletcher & Stead, 2000) measures frequency of feeling anxious (4 items) and depressed (4 items; each a 0-12 ratio scale). Items were rated on a 4-point Likert-type scale (response options: 0 “never,” 1 “very rarely,” 2 “now and again,” 3 “very frequently/often”). These have been shown to display high reliability (anxiety α = .80, depression α = .78) and have been validated against several other common measures of general free-floating anxiety and depression (Sharma, 2010). To avoid confusion with the anxiety facet in the IPIP-HEXACO, these two variables are referred to as anxiety(TF) and depression(TF).
Life satisfaction
Life satisfaction was measured with 17 items (n = 120). Five of these items were the item set from the Satisfaction With Life Scale developed by Diener, Emmons, Larsen, and Griffin (1985), found to display an α = .87. In addition, 12 items were designed by the researcher to measure aspects of life satisfaction as single item indicators. These items tapped into satisfaction with social, family, and romantic relationships; happiness and pride with the individual’s life; and satisfaction with career. An example item was, “I have satisfying social relationships.” All the items were measured on a Likert-type scale ranging from 1 “strongly disagree” to 7 “strongly agree.” The combination of these 17 items is referred to as life satisfaction in this study (α = .92).
Tendency toward habitual behavior
Tendency toward habitual behavior was measured using three items (n = 120). The three items were measured on a Likert-type scale ranging from 1 “strongly disagree” to 7 “strongly agree,” giving a scale range between 3 and 21. These general items were informed by Verplanken and Orbell (2003). High scores indicated a greater tendency toward habitual behavior. An example item was “I do not find making changes easy.” The three items displayed a reliability of α = .73.
Results
The following analyses were conducted using SPSS, Version 19. All of the variables used in the following analyses were found to be normally distributed.
Within-Subject-Level Variation in Each Trait and Facet
We conducted within-subject analyses of variance (ANOVAs) on the statements tapping into each trait and facet scale to determine whether the variation is due more to differences within the person, rather than measurement error. The within-subject ANOVA allows for this as it partials out the between-subject variation and examines the within subject variance as separate from between-subject variance. The mean square residual error (MSE) values for every trait were similar (ranging between 1.41 and 1.56), and the MSE values for the facets were similar (ranging between 0.79 and 1.26), meaning that error was quite stable. This means the F statistics (the ratios of the mean square of differences between behavior statements and mean square residual error) can be used to distinguish degree of within-subject variation between the attributes well.
The within-subject ANOVA statistics (based on Huynh-Feldt adjustments) for each facet are reported in Table 1. The results indicate there are significant within-subject differences in the rating of behavior statement items across the sample. The Mauchly test of sphericity for every analysis suggested heterogeneous variances, which is expected with individual differences in within subject varied response styles to the behavior statements. For the traits, the Huynh-Feldt values were below .75, so multivariate tests were also run based on Hertzog and Rovine’s (1985) recommendation. F statistics from multivariate tests are reported for the traits, which provided slightly reduced F statistics. Wilks’ Lambda effect sizes are reported for the traits. We ran the analyses using only the 40 community sample participants and highly significant differences were still found for the facet analyses. The F statistic for openness to experience was excessively large compared with the other trait WS SDs in the community sub-sample, suggesting extreme inflation. Overall, this suggests within-subject differences in behavior statement ratings are not just statistical artifact due to the sample size but are also meaningful.
The Within-Subject ANOVA Results for Differences in Ratings Within Each Trait and Facet.

Note. T = trait attribute, F = facet attribute.
Wilks’ Lambda value, rather than Partial η2.
p < .01. **p < .001.
The Within-Subject Standard Deviations (WS SDs)
We have established that true within-subject variation occurs in ratings for specific behaviors within a trait or facet attribute. To examine whether this within-subject variation is predictive of psychological outcomes, we calculated the WS SD of ratings in each trait and facet for each participant. The initial step was to calculate the within-subject variance using the conceptual variance equation (Equation 1).

Equation 1: The conceptual variance equation.
Y is the participant’s raw score of a single item.
N is the number of observations per participant (10 for the facets; 40 for the traits).
After the within-subject variance was calculated; the square root of the value was used to obtain the WS SD for each participant. The average WS SD in most traits and facets was close to or greater than 1, which is large on a 5-point rating scale (ranging between 0.77 and 1.06 for the 24 facets, and between 0.97 and 1.10 for the 6 traits). When reliability analyses were conducted on the WS SDs, they achieved a reliability of α = .88 for the six trait WS SDs, whereas the analysis for the 24 facets achieved a reliability of α = .87, suggesting the WS SDs all measure similar variability constructs.
Correlation Analyses Between the WS SDs and Psychological Outcomes
The following correlation analyses were run for each specific WS SD, its total trait/facet score and the psychological outcomes. Table 2 displays the correlations between the WS SD values for each trait/facet and the outcome variables. Many negative correlations were found between the WS SDs and trait/facet score (ranging between −.17 and −.45), suggesting that WS SDs reflect an opposing varied behavior style for these particular attributes. The expressiveness and patience WS SDs show positive relationships with the respective trait/facet scores. Significant correlations between WS SDs and outcomes ranged in strength between .16 and .36 for n = 160, and between .19 and .35 for n = 120. As some of these effect sizes were modest, bootstrapping analyses of WS SDs (based on 1,000 simulated re-samples) in relation to an outcome were conducted to help determine whether these findings were due to chance in this sample or are meaningful. If the confidence interval covered r = .00, this means the correlation lost significance. This resulted in a few of the correlations losing significance, although most retained significance suggesting the majority are meaningful significant relationships.
The Correlations Between the Within-Subject Standard Deviations, the Trait/Facet Scores, and Outcome Variables (Sample Size Differs by Outcome).

Note. For correlations involving life satisfaction and TTHB n = 120; all other correlations n = 160. WS SD = within-subject standard deviation. T = WS SD based on a trait. F = WS SD based on a facet. TTHB = tendency toward habitual behavior. OTE = openness to experience. AA = aesthetic appreciation.
p < .05 after bootstrapping.
p < .05. **p < .01. ***p < .001.
Partial correlations between the WS SDs and outcomes controlling for the trait/facet score were conducted. Table 3 displays the correlations between the WS SD values and the outcome variables when partialling out the trait/facet score. Two positive relationships to life satisfaction surfaced, with the extraversion WS SD, r(117) = .19, p = .04, and social boldness WS SD, r(117) = .22, p = .02. Several relationships lost significance—between honesty–humility facet WS SDs and outcomes, although the sincerity WS SD and anxiety relationship retained significance, r(157) = .18, p = .02. Most of the agreeableness facet relationships lost significance, although the flexibility WS SD to sensation seeking increased, r(157) = .17, p = .04. Most of the conscientiousness WS SD relationships decreased in strength, but still retained significance, with self-pluralism, r(157) = .30, p < .001; with anxiety, r(157) = .30, p < .001; depression, r(157) = .29, p < .001. The conscientiousness facet WS SDs were still significantly related to the outcomes, when the facet total score was partialled out. The organization WS SD with self-pluralism, r(157) = .18, p = .03; with anxiety, r(157) = .17, p = .03; with depression, r(157) = .17, p = .04; and with sensation seeking, r(157) = −.17, p = .03. The prudence WS SD with self-pluralism, r(157) = .19, p = .02; with anxiety, r (157) = .19, p = .02; and with depression, r(157) = .22, p = .005. The expressiveness WS SD relationship to life satisfaction decreased, r(117) = .21, p = .02, as did the emotionality WS SD relationship to sensation seeking, r(157) = .21, p = .01; however, both retained significance. All of these significant relationships retained significance after bootstrapping analyses.
The Partial Correlations Between Within-Subject Standard Deviations and Outcome Variables When Partialling Out the Trait/Facet Scores (Sample Size Differs by Outcome).
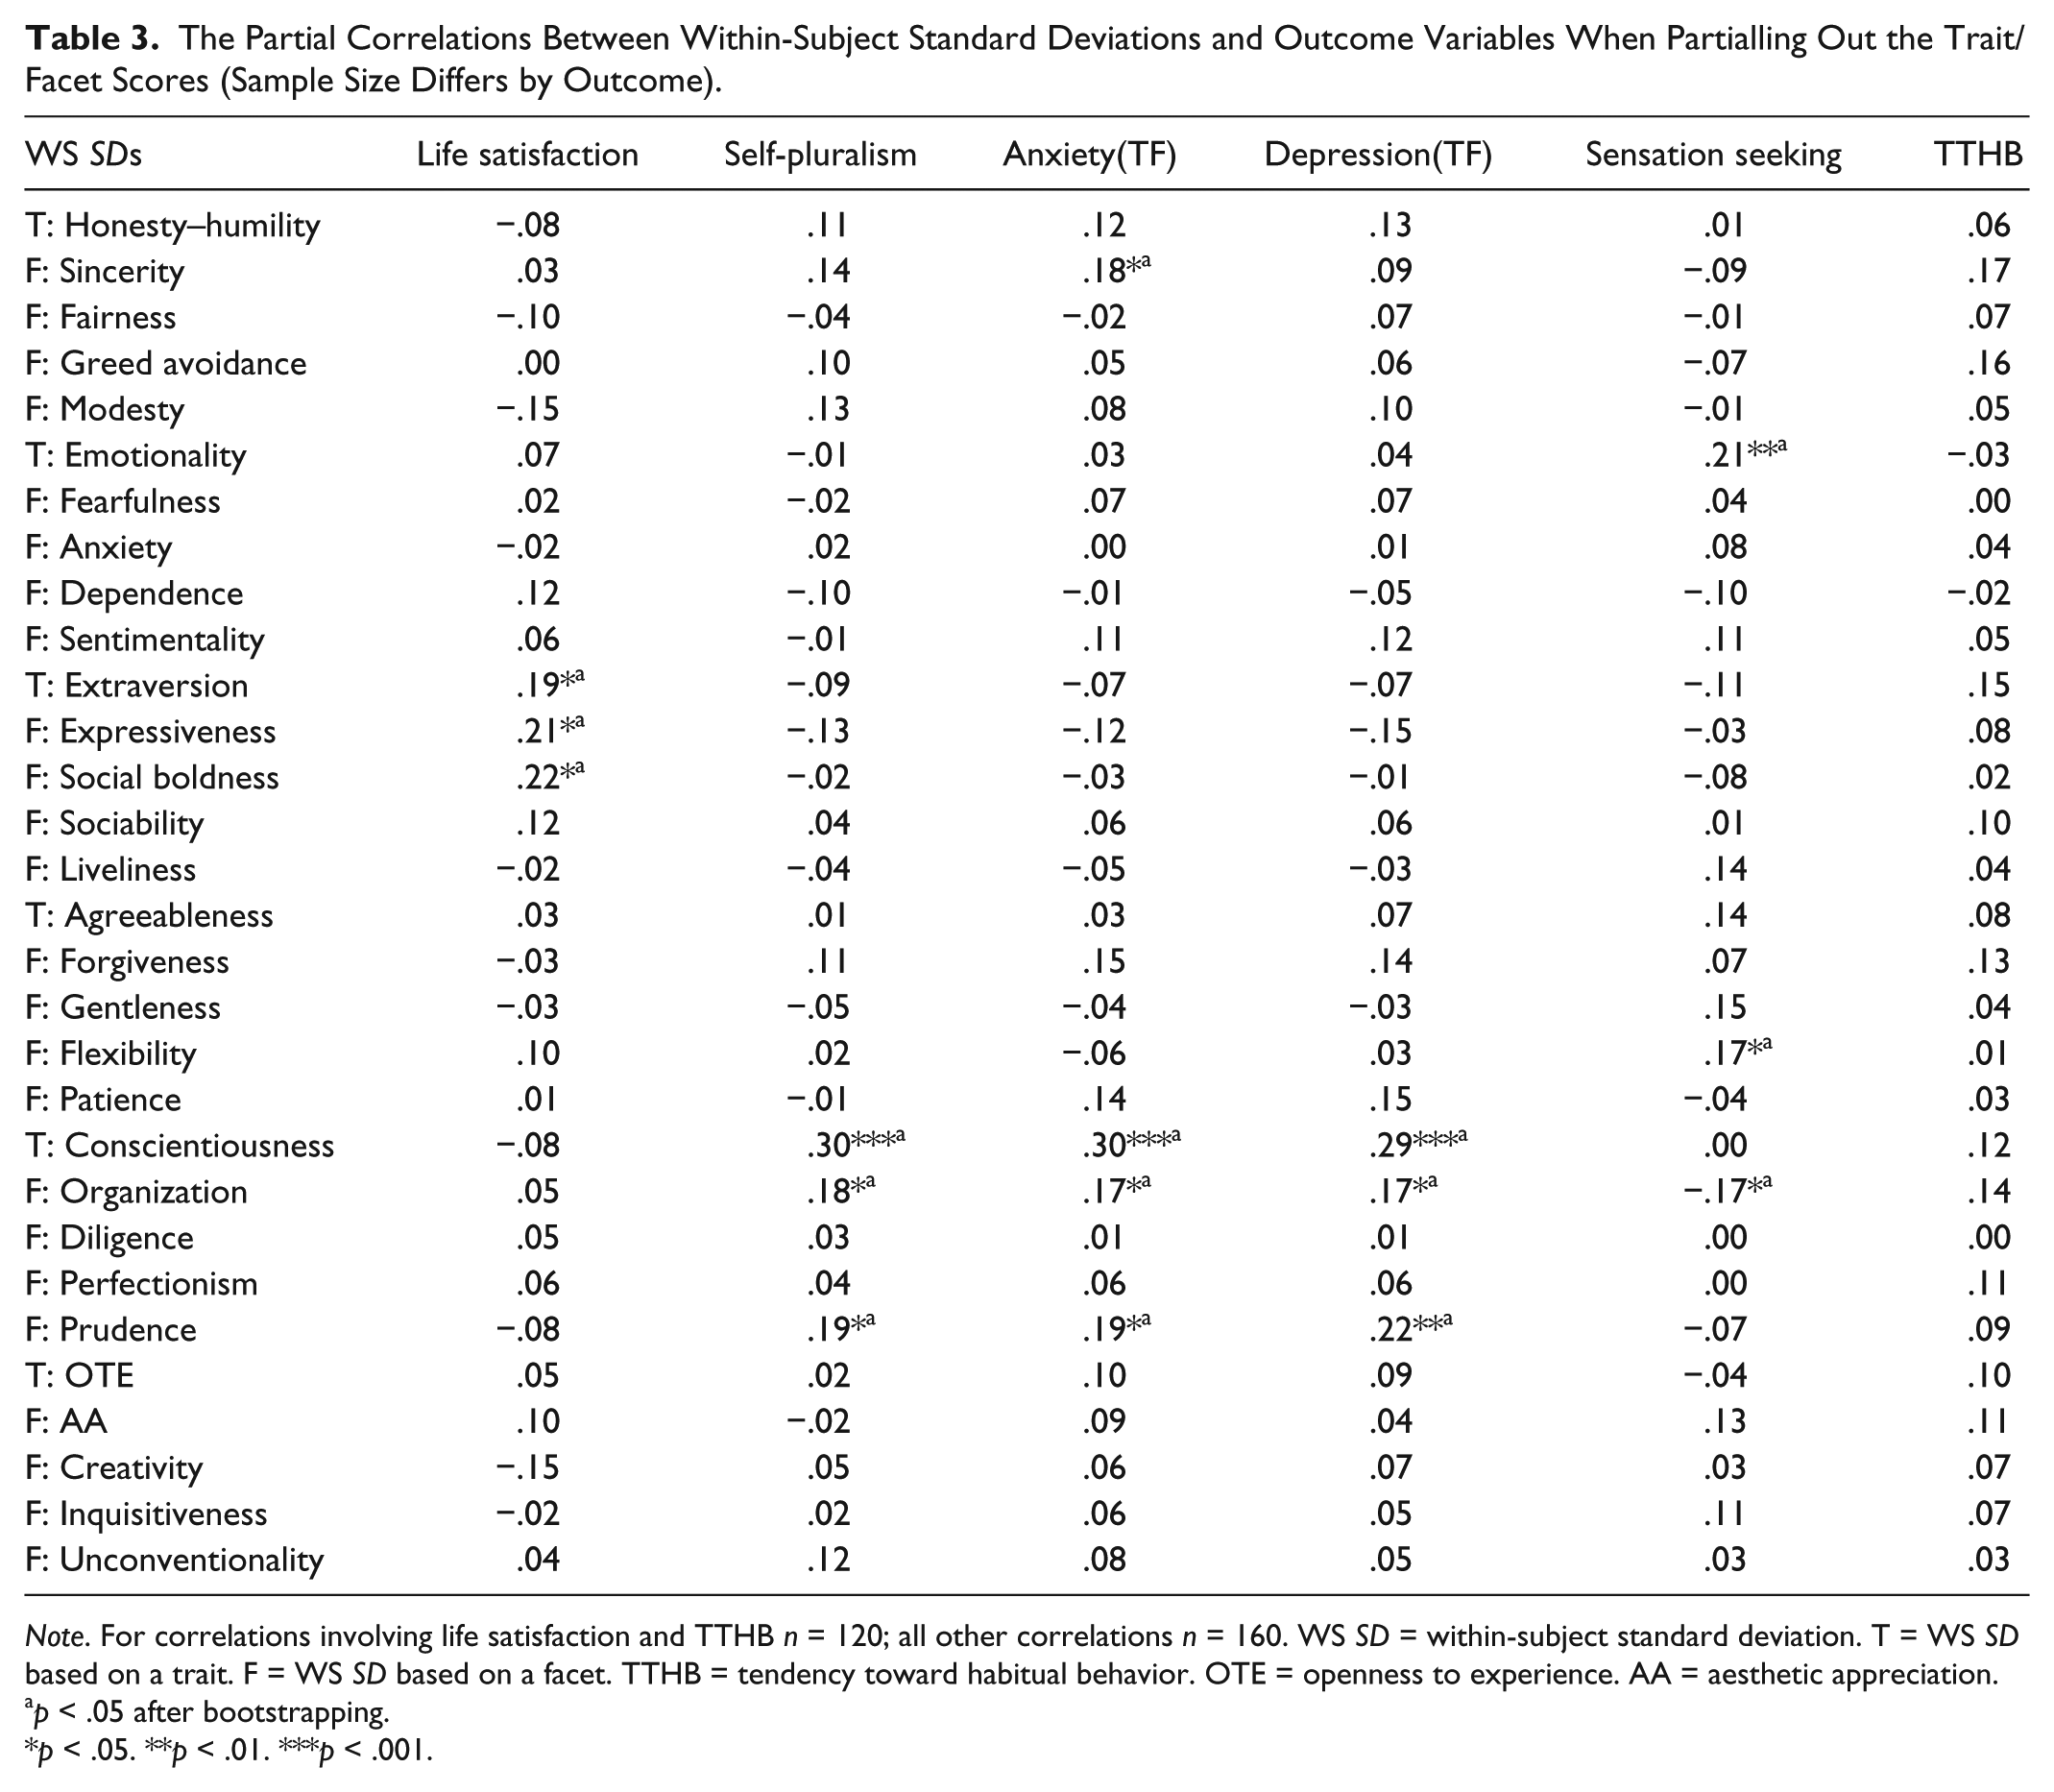
Note. For correlations involving life satisfaction and TTHB n = 120; all other correlations n = 160. WS SD = within-subject standard deviation. T = WS SD based on a trait. F = WS SD based on a facet. TTHB = tendency toward habitual behavior. OTE = openness to experience. AA = aesthetic appreciation.
p < .05 after bootstrapping.
p < .05. **p < .01. ***p < .001.
Partial correlations between the WS SDs and outcomes were then conducted when controlling for the trait/facet score and trait/facet score squared. Partialling out the trait/facet score squared helps to further account for the potential effects of participant traitedness on these relationships. Table 4 displays the correlations between the WS SD values and the outcome variables when partialling out the trait/facet score and trait/facet score squared. When compared with the correlations partialling out just trait/facet score, the relationship between the sincerity WS SD and self-pluralism regained significance, r(156) = .17, p = .03. The relationship of the sincerity WS SD to anxiety increased to r(156) = .20, p = .01. The relationship of the emotionality WS SD to sensation seeking remained the same at r(156) = .21, p = .007. The relationships of extraversion and expressiveness WS SD to life satisfaction lost significance, but the relationship of the social boldness WS SD to life satisfaction remained significant, r(116) = .18, p = .048. In terms of the agreeableness facets, the relationship of the flexibility WS SD to sensation seeking lost significance, but a weak relationship of the patience WS SD to depression surfaced, r(156) = .16, p = .045. The conscientiousness WS SD relationships remained the same, with self-pluralism, r(156) = .30, p < .001; with anxiety, r(156) = .30, p < .001; depression, r(156) = .29, p < .001. The organization WS SD relationships to negative outcomes increased slightly, with self-pluralism, r(156) = .19, p = .02; with anxiety, r(156) = .21, p = .009; with depression, r(156) = .18, p = .02. However, the organization WS SD relationship to sensation seeking lost significance. The prudence WS SD relationships with negative outcomes displayed minimal change with self-pluralism, r(156) = .19, p = .02; with anxiety, r(156) = .18, p = .02; and with depression, r(156) = .21, p = .007. All of these significant relationships retained significance after bootstrapping analyses, except for the social boldness WS SD and life satisfaction relationship.
Partial Correlations Between Within-Subject Standard Deviations and Outcome Variables When Partialling Out the Trait/Facet Scores and Trait/Facet Score Squared (Sample Size Differs by Outcome).
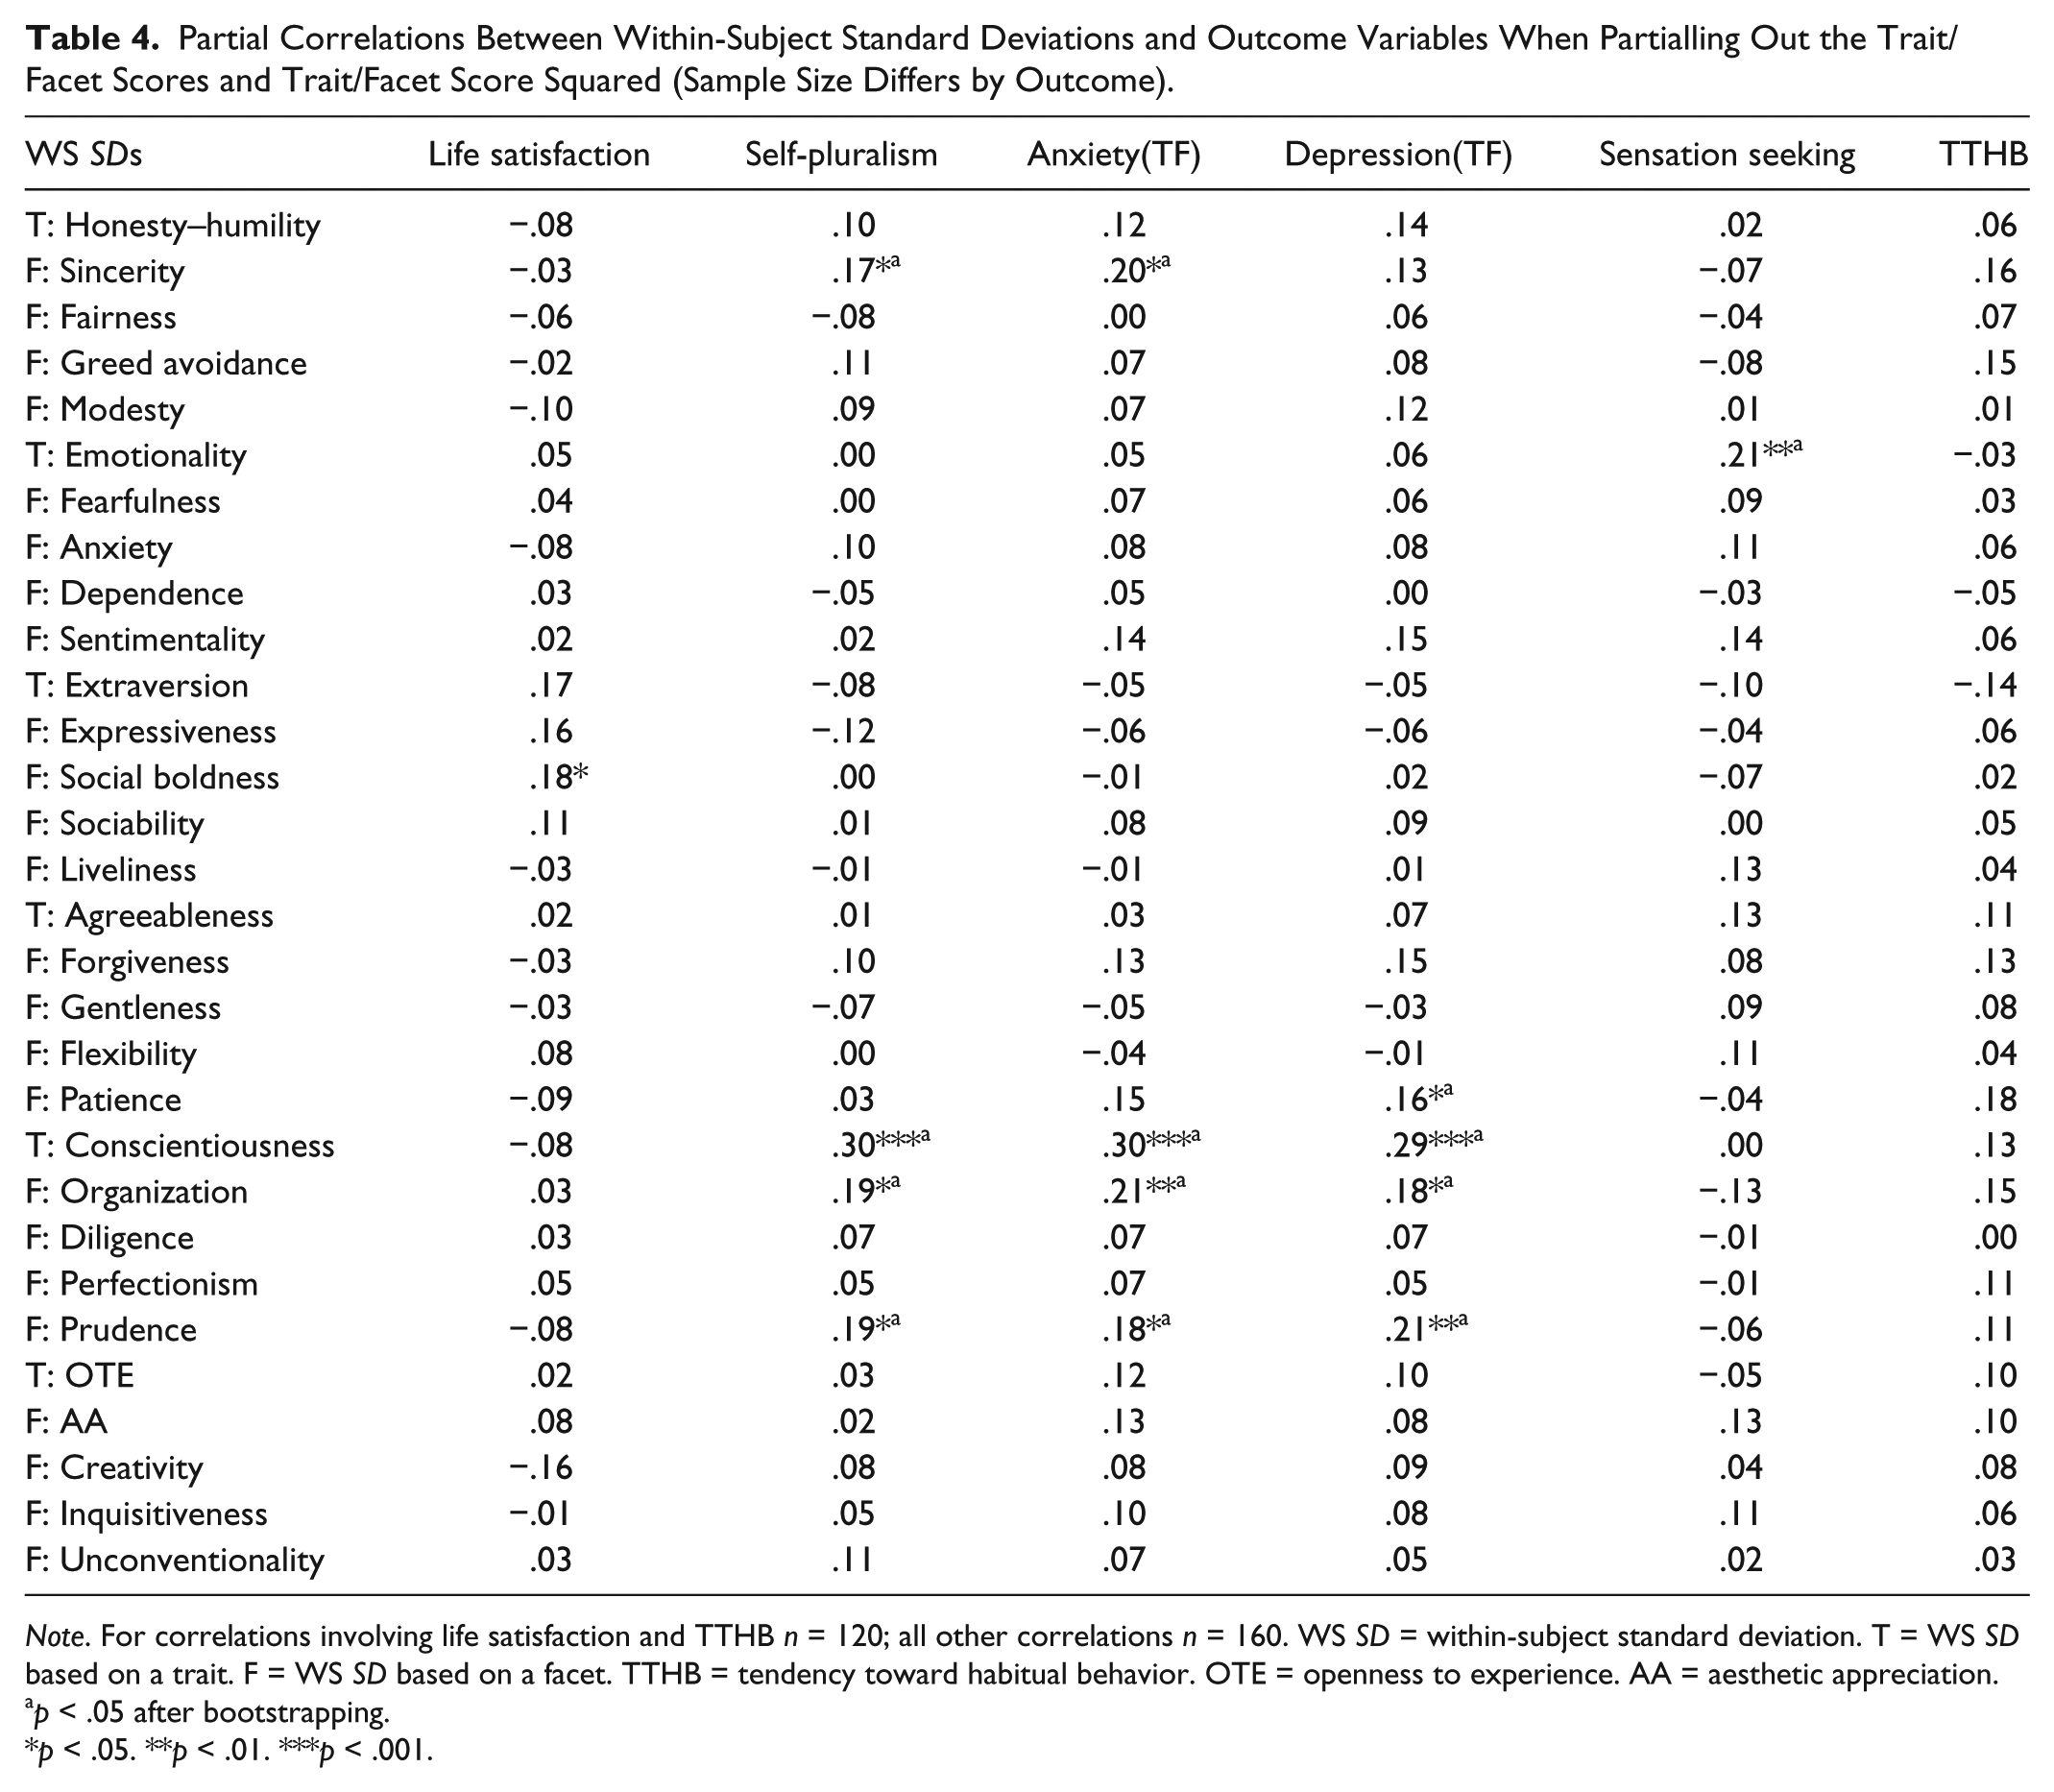
Note. For correlations involving life satisfaction and TTHB n = 120; all other correlations n = 160. WS SD = within-subject standard deviation. T = WS SD based on a trait. F = WS SD based on a facet. TTHB = tendency toward habitual behavior. OTE = openness to experience. AA = aesthetic appreciation.
p < .05 after bootstrapping.
p < .05. **p < .01. ***p < .001.
Discussion
Within-subject ANOVAs of the items for each trait/facet revealed that there were significant differences in the within-subject behavior statement item ratings that are not simply due to measurement error, supporting previous research suggesting inter-item variability is meaningful (Baumeister, 1991; Biderman & Reddock, 2012; Britt, 1993; Dwight et al., 2002; Hershberger et al., 1995; Reddock et al., 2011; Reise & Waller, 1993; Shepherd & Belicki, 2008). Not all behaviors that tap into a disposition are consistently displayed by an individual—people can and do vary their behavior within a trait or facet. The findings here also suggest that it is important to examine variability indices (WS SDs) based on specific attributes from a personality model, in this case the HEXACO model, rather than one or two indices as past research in this area has done. The findings show that this variability is related to positive and negative psychological outcomes, providing validity for the WS SD indices. The research here supports the need to take account of this true variation in responses, which is ignored in the vast bulk of trait research. Admittedly, it is difficult to completely remove measurement error from the WS SD indices; however, the Cronbach’s alpha values for the trait and facet WS SD indices constructs suggest that these mainly reflect that within-subject variability in scoring is a true, meaningful inter-individual difference.
Many of these relationships between WS SDs and outcomes found were modest, as would be expected, based on Britt (1993), but bootstrapping re-sampling analyses helped confirm the majority were meaningful relationships. As the WS SDs are calculated from the same items used to calculate the trait/facet score confounding of measures is an issue. We found that many trait/facet scores were related to their WS SDs, and also some WS SD—outcome relationships lost significance when partialling out trait/facet score and trait/facet score squared. This suggests that within-subject variability is not independent of traitedness in many cases, although some relationships remained even when trait/facet score and trait/facet score squared were partialled out.
It is possible that a participant with a midpoint trait score might have a small or large WS SD, depending on whether they responded in a varied way or used the midpoint response repeatedly. These are important factors that emphasize the need to calculate WS SDs separately to trait/facet scores as we did here. Other researchers in this area may find examining within-subject variation in responding, as well as the between-subject variation in scores valuable in their own data, for surfacing new relationships or for checking data quality.
Individuals may display specific behaviors relevant to a trait or facet to different degrees (at either end of a dimension), which can affect psychological outcomes. Whether the variations in questionnaire item ratings shown here represent real variations in actual behavior cannot be answered directly from this study, although we are optimistic that this is so, based on a diary study of personality states in different situations measuring the HEXACO model (Churchyard, Pine, Sharma, & Fletcher, 2013). This method will never be as effective as a diary study in measuring varied behavior styles; however; it could act as a useful indictor of within-subject variability in a single measurement occasion trait questionnaire studies. To confirm this, diary studies could be conducted that initially collect trait questionnaire data using a behavior statement questionnaire, before moving on to an adjective-based diary, to examine WS SD indices relationship to repeated diary measurements in a multi-level model analysis.
We would also suggest that being able to distinguish between meaningful and error variation—as our methods allow—is another reason to have more confidence the variation will reflect actual behavior. McCrae and Costa (1996), in their five-factor personality system, originally proposed the idea that characteristic adaptation exists alongside basic trait tendencies to help adapt to situational needs. This suggests variation initially occurs to try and adapt. The relationship of WS SDs to positive or negative outcomes likely reflects the feedback received from attempts at varied behavior. These reflect varied behavioral styles developed over time, which have become habitual, as they are strong enough to be significantly associated with an outcome. In our study, we found variability in expressiveness to be associated with a positive outcome (higher life satisfaction, lower anxiety, depression, and self-pluralism), suggesting that variability in expressive behavior has had consistently positive feedback; whereas variability in conscientiousness and its facets, and also sincerity, fairness, liveliness, and creativity variability were associated with negative outcomes (higher anxiety, depression, and self-pluralism), suggesting these are due to consistent negative feedback. The fact that only those WS SDs consistently related to anxiety and depression were also related to self-pluralism suggests this self-perceived variation is an aspect of negative affect, which results of from poor adaptation behaviors that differ from natural trait style. Research supports this since individuals higher in negative affect are more sensitive to punishment (Torrubia, Cesar, Molto, & Caseras, 2001), and will therefore associate this variation with a negative result strongly with negative affect. Of course, personality trait questionnaires are specifically designed to include a set of behaviorally representative items for each trait, and so we would expect the variation between items to also be representative.
When the WS SD relationships to psychological outcomes were examined, the significant relationships were focused around particular attributes, rather than being spread across all the WS SDs examined, as might be expected if variation in a general capacity was responsible. This suggests that it is the variability of a particular personality attribute, and not a general capacity for variation, that determines outcome relationships, even if all the WS SDs are tapped into a similar variability construct. This leads to an important question in personality trait research where WS SD variability is not routinely reported. Is the positive directionality of personality trait and facet constructs measured itself confounding reported relationships? A normal trait score on a personality trait or facet reflects only the between-subject differences of that attribute, and does not reflect any within-subject variation on that trait or facet but—by definition—the WS SD scores subsume and account more for negative as well as positive item ratings. The positive directionality of most of the personality trait and facet attributes measured here, where a higher score reflects a more positive quality (all except those associated with trait emotionality), may have led to more of the significant WS SD relationships found being associated with negative outcomes (negative relationships to life satisfaction and positive relationships to anxiety, depression, and self-pluralism). It may be that having a more negatively directed questionnaire, where higher scores indicate negative qualities, would change matters and reveal new insights into personality expression. Examples in this study include the positive relationships of the emotionality and sentimentality WS SDs to the positive outcome of sensation seeking. Because we have only examined a limited number of psychological outcomes here, we need to remain circumspect about this.
At least 10 statements or items were available to calculate the WS SDs for each trait (or facet), providing the WS SDs with validity as an index of variability. The sample size provided decent statistical power to find significant findings.
The calculation of the sensation seeking measure involved total facet scores from seven facets, so this could have raised a potential confound in the analyses between the WS SDs for these facets and the sensation seeking score. However, of the seven facets used to calculate this, only the fairness WS SD was (weakly) associated with sensation seeking. The selection of different facet attribute scores involved in the calculation likely dilutes the impact of each specific facet attribute. In addition, the WS SDs rather than trait scores are examined, which reduces the potential confound even further.
We did not measure behavior in context, although we suggested that specific behavior item ratings would reflect contextual-dependent behavior within the trait/facet (supported by Lievens et al., 2008). Future research could examine this by using shorter trait/facet questionnaires that allow the participant to note the context they think suits a specific behavior. The behaviors that are frequently assigned a particular context could be examined together in a reliability analysis to see whether they reveal contextually specific behavior sets. We would predict more different contexts assigned for those with higher WS SDs.
This study raises important issues in personality trait test research. In particular, it considers how variability in one personality trait/facet may affect, or be affected by, the expression of another personality trait/facet, and how this could affect psychological outcomes. The use of WS SD scores is core to answering these questions. In this study, we examined the relationships of WS SDs to other psychological outcomes and have partialled out trait/facet scores. It is possible that other subject level characteristics, such as intelligence or self-complexity (Linville, 1985, 1987), may have an impact on WS SDs. Future research might consider partialling out the impact of other subject characteristics. It does seem important that future personality research calculate WS SDs in multiple-item trait scales to examine the questions raised by this research.
This research was conducted to determine the validity of item-level within-subject variation of ratings in personality trait questionnaires, by examining the impact of variability indices in relation to a selection of psychological outcomes. Most of the attributes measured displayed a degree of within-subject variation considered to be true variation, rather than due to error. This within-subject variation was found to be associated with positive and negative psychological outcomes, depending on the attribute displaying the variation. This suggested that item-level within-subject variability is a valid psychological construct to analyze in behavior statement based personality trait questionnaires. There may be considerable value in examining this in existing data collected from previous trait studies using a behavior statement questionnaire, because it is likely to reveal new meaningful individual differences in those who completed them. We would recommend that future research examining personality traits and other outcomes using behavior statement based trait questionnaires also report this variability, considering the ease with which it can be calculated, and the added meaningful information on within-subject variability in relation to psychological outcomes that it provides.
Footnotes
Declaration of Conflicting Interests
The author(s) declared no potential conflicts of interest with respect to the research, authorship, and/or publication of this article.
Funding
The author(s) received no financial support for the research and/or authorship of this article.