
Abstract
A higher education institution’s mission statement should communicate its purpose and goals to both internal and external stakeholders. Unless there is a means of assessing the statement’s efficacy, it is little more than a vacuous public relations contrivance. Most teaching institutions’ mission statements directly or indirectly speak to student learning. Focusing on business schools, a literature review found little evidence of mission statement influence at the individual course level. Studies assessing the linkage between individual courses and the school’s mission statement are few. More comprehensive studies assessing the linkage from assemblages of multiple-section courses, majors, and programs could not be located in the available literature. This article presents a unique and cost-effective mathematical model that can be used to link aggregated student performance in individual courses to the institutional mission statement. Its utility permits the aggregation and disaggregation of data facilitating comparisons and contrasts performance within and across majors, required and elective, and general education within a curriculum in relation to the institution’s mission statement. Furthermore, the model could be used to isolate and compare and contrast targeted subgroups by class standing, faculty rank, experience, and full- or part-time status.
Keywords
Introduction
Drucker (1974) drew the corporate sector’s attention to the fundamental importance of mission statements. Mission statements have since become nearly universal accoutrements in internal and external communications in both for- and non-profit organizations, including colleges and universities. They are assumed to publicly affirm the organization’s purpose and goals to its internal and external stakeholders. Constituent units of colleges and universities in turn publish their own mission statements. Thus, a business school’s mission statement while presumably aligned with its parent institution’s mission statement should communicate its own unique purpose and goals to both internal and external stakeholders. The efficacy of a mission statement in guiding performance is especially important to business schools seeking to attain or maintain their accreditation.
A business school’s mission statement is the potential fountainhead of the school’s strategic planning and subsequent tactical initiatives purportedly designed to fulfill its goals. These statements are assumed to serve both internal and external stakeholders. They are thought to provide a unifying internal focal point for the adopting governing board, faculty, students, and staff. For external stakeholders their influences vary widely in the strength according to affinity or strength of interest. They include but are not necessarily limited to prospective students, employers, accrediting organizations, government officials, non-government organizations, donors, and the public at-large. A well-crafted mission statement can unify and energize internal stakeholders while enhancing external stakeholders’ perceptions, expectations, and possible actions.
Tangible evidence of a mission statement’s efficacy should be reflected in organizational performance data relevant to its stated goals. Unless a validated linkage can be demonstrated between the school’s implemented programs and activities, little is revealed of the mission statement’s efficacy. Without data supporting its effectiveness throughout the curriculum, it is little more than vacuous marketing copy. The for-profit enterprise’s profit and loss statement provide an easily derived efficacy proxy. Non-profit organizations do not have a metric as readily accessible. Teaching institutions and their business schools typically do not have such easily accessible proxies. Metrics such as graduation rates, time to employment, initial salary, and alike are post instruction and are at best indirect metrics. They do not provide any direct data of the institutions’ mission statement’s influence on instruction at the point of delivery, the individual classroom. The mathematical model offered below provides more direct evidence of the statement’s influence and relative strength from the individual course level. The model permits the subsequent comparison and contrast up through the circuitous paths of the curricula.
Literature Review
Studies of mission statement influence in the for-profit corporate sector have been emerging since at least the 1980s. The bulk of findings suggest that statements have a potential for influencing the organization’s performance (Bartkus, Glassman, & McAfee, 2006). In a study of Fortune 500 firms, Pearce and David (1987) found that the mission statements of firms exhibiting superior financial performance differed from the inferior results of their peers. Firms with superior mission statements appeared to have effectively communicated their purposes, values, goals, and priorities to both internal and external stakeholders. The internal stakeholders appeared to be uniformly focused and energized, while the externals knew what to expect (Pearce & David, 1987).
Kenneth and Bart Baetz (1998) reviewed the relationship between 136 large Canadian organization’s mission statements and their performance. They found that some mission statement characteristics and elements were related to higher levels of organizational performance. Bart, Bontis, and Taggar’s (2001) study of 83 large Canadian and U.S. firms found that mission statements appeared to influence financial performance. The effect was, however, attributed to enabling policies, organizational structures promoting employee commitment.
Mission statements should define how the institutions see themselves and how they want others to see them. Typically drafted through broad internal and external stakeholder consultation, tertiary institutions tend to publish bold statements depicting a dynamic institution. Palmer and Short (2008) noted that business schools use mission statements to present their values, motivate faculty, recruit students, and promote their accreditation aspirations. Crafting a compelling mission statement is expensive consuming relatively large quantities of institutional resources. Recasting the mission into an effective context is a first step in building a visionary organization (Collins & Porras, 1996).
In their individual courses, faculty use a wide array of assessment tools to measure student learning to subsequently assign a final course grade. Course grades are not customarily recognized as proxies of the school’s mission statement influence in the classroom and beyond. Evidence of suggesting a linkage, strong or weak between student learning in specific courses and the mission statement, has to date been scant at best.
Two business school studies were identified. They describe specific studies used to satisfy applicable accreditation requirements. A gateway MBA course, Personal Development, and Social Responsibility, was used to relate course learning to the school’s mission (Hazen, Cavanagh, & Bossman, 2004). Lawrence, Reed, and Locander (2011) used a chi-square test of differences to compare learning results of two consecutive cohorts on the ethical decision-making learning goal. Such studies of individual courses provide isolated suggestions of possible linkage. These studies are more akin to snapshots rather than a comprehensive photo album. Studies focused on the intricate relationships between and among the courses delivered with an institution’s mission statement are lacking.
The literature contains comments on the importance of mission statement linkage in relation to accreditation challenges while noting the complexity and cost of meeting the requisite demands (Cotton, McKenna, Van Auken, & Yeider, 1993; Gore, Steven, & Bailey, 1998; Henninger, 1998; Jantzen, 2000; Julian & Ofori-Dankwa, 2006; Kerby & Weber, 2000; Slone & LaCava, 1993; J. A. Yunker, 2000; P. J. Yunker, 1998). There is an array of familiar methods for suggesting aggregate performance for the institution mission. They include alumni and employer surveys, portfolios, external examiners reviews, and advisory board contributions. Categorically, all tend to be costly and labor-intensive. They are indirect at best. With the exception of the capstone course none directly focus on classroom. Capstones, delivered by a few instructors, rely on a single course as a proxy for the entire curriculum. Furthermore, they do not permit comparisons among instructors, class standing, majors, and a host of other variables.
There is no grading method that can be used as a multidimensional evaluation. Grades cannot be used in all places and purposes. However, grading is a time-honored way for professors to communicate with the students about the achievement of student learning outcome. Professors can use grades to reinforce the student learning feedback and provides rewards. In addition, grading can be used to motive student learning. It gives students a sense of the student learning quality as a whole. Universities can use grades to evaluate program effectiveness (Feldmesser, 1972; Frisbie & Waltman, 1992; Guskey, 1994).
Standardized assessment tools, College Learning Assessment, Determining Issues 2, Major Field Test, and alike are often used to infer mission fulfillment. While comparatively easy to assemble but costly to use these proxies do not provide much of an insight into the complementary relationship, if any, between and among these metrics and the school’s mission statement. They can only suggest partial or aggregate linkages rather than a comprehensive data set capable of validating the presence and relative strength of the mission’s influence throughout the curriculum. A direct and potentially more comprehensive source of linkage data is readily at hand with minimum additional time and expense required to secure and evaluate. The course grades that are already routinely generated at the end of each academic term.
Mathematical Model
This article presents a model that can be used to effectively and efficiently link individual and aggregated classroom performance to the institutional mission statement. Measures of student learning, final course grades provide the model’s database. Governed by institutional policy, course grades are required at the end of each academic term. No additional assembly costs are required. When the numeric equivalents of final grades assigned are subsequently paired with the instructor’s predetermined proration of the mission statement’s goals addressed in the course a linkage emerges. The aggregate numeric grade paired with each of the proration of each goal pursued also provides an indication of the relative strength of linkage. The model links each course’s grade distribution to the mission statement’s stated goals providing an efficacy metric. Furthermore, the model readily permits heretofore challenging comparisons between and among the same course taught by different instructors, course sequences, majors, class standing, pedagogy, and other possible inquiries limited only by imagination.
The authors have developed an easily implementable cost-effective model for bridging the circuitous curricular and organizational path linking the mission statement to individual courses. It uses following steps for linking classroom performance to the institutional mission statement.
Each instructor of record identifies the institutional mission statement’s weighted learning goals into each course syllabus.
At the end of a term, the instructor of record assesses each student’s aggregate performance and enters the grades per institutional policy.
The Institutional Research personnel use the mathematical model linking and aggregating each assigned grade to the course’s weighted mission statement goals.
The resulting data set is subject to cross-sectional analysis beyond the individual classroom—between and among the same course taught by different instructors, course sequences, majors, class standing, pedagogy, and other possible inquiries limited only by imagination.
Numerical Example of the Five Steps
A simplified numerical example, with five learning goals, five students, and three courses in one semester, is shown in this section to demonstrate the processes in detail.
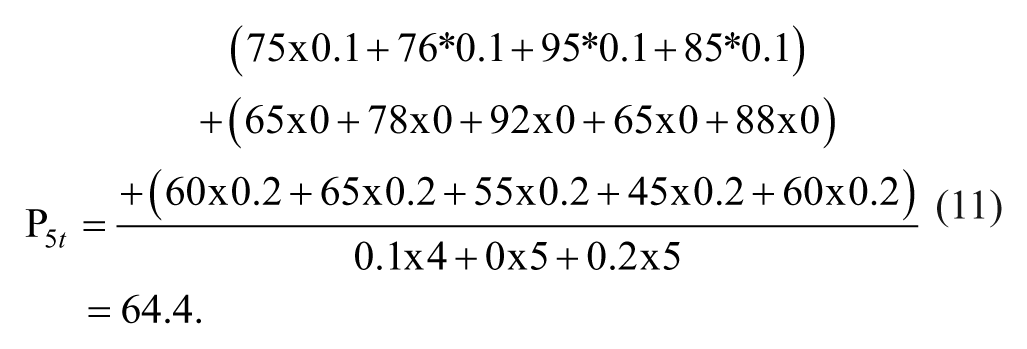
Institutional consensus on the mission statement’s articulated or implied learning goals is a prerequisite. Subsequently, each instructor of record embeds and weighs the institutional mission statement’s identifiable learning goals into each of their course’s syllabi. In the event of multiple sections taught by different instructors, a consensus weight assignment is adopted. Table 1 shows the weights of each learning goal on each course assigned by professors. The weights are 0.5, 0.3, 0.1, 0, and 0.1 for the Learning Goals 1, 2, 3, 4, and 5 of course 1, respectively. The weights are 0.2, 0.3, 0.3, 0.2, and 0 for the Learning Goals 1, 2, 3, 4, and 5 of course 2, respectively. The weights are 0.1, 0.5, 0, 0.2, and 0.2 for the Learning Goals 1, 2, 3, 4, and 5 of course 3, respectively. Some courses may cover all of the five learning goals and some other courses may only cover few learning goals.
At end of academic term, individual student grades are reported as normal. Each instructor of record is free to assign course grades. Using assessment tools and rubrics complementary to her or his teaching style or within the constraints of any consensual syllabus members on collecting data for analysis. The learning goal achievement level is defined. Table 2 shows the original final scores of students in each course. There are four, five, and five students in courses 1, 2, and 3, respectively. Original scores for the four students are 75, 76, 95, and 85 for Course 11. Original scores for the five students are 65, 78, 92, 65, and 88 for Course 2. Original scores for the five students are 60, 65, 55, 45, and 60 for Course 3.
The mathematical model aggregates each assigned grade to the course’s weighted mission statement goals as described below.
Learning Goals and Weights.

Student Original Scores.
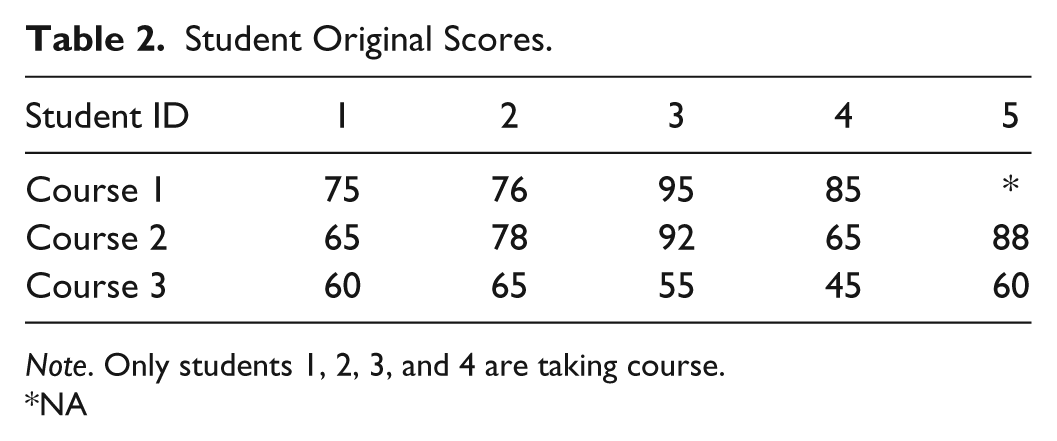
Note. Only students 1, 2, 3, and 4 are taking course.
NA
One piece of important information in this model that is needed to link the classroom performance to the institutional mission statement is the student score of learning goals.
If every student takes all of the courses in the program, the student performance of a learning goal i at time t for the program as a whole is

and
This score represents a specific learning goal performance of all of the students in a program.
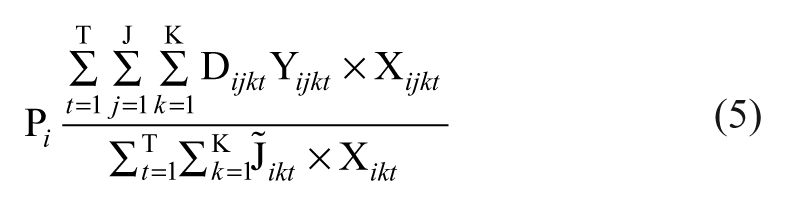
If students only take some courses in the program, the student performance of a learning goal i at time t for the program as a whole is

and
If students only take some courses in the program, the student performance of a learning goal i at time t for a specialization m in the program as a whole is

and
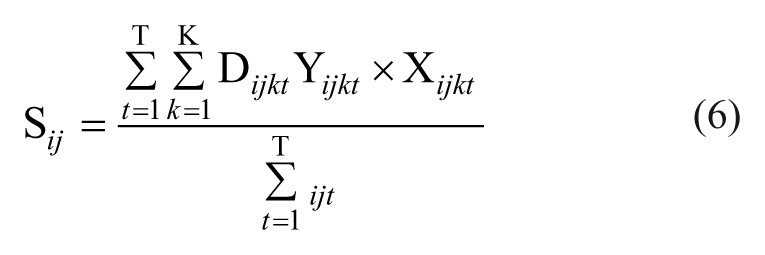
The performance of learning goal i of student j in year t is

and
If students only take some courses in the program, the student performance of a learning goal i from time 1 to time T for the program as a whole is
and
The performance of learning goal i of student j from time 1 to time t is
and
4. Aggregate and cross-sectional analysis is applied.
Equation 2 is used to calculate the student performance of learning goal i at time t for the program as a whole.
The student performance of Learning Goal 1 at time t is

The student performance of Learning Goal 2 at time t is

The student performance of Learning Goal 3 at time t is

The student performance of Learning Goal 4 at time t is

The student performance of Learning Goal 4 at time t is
5. Information analysis directing adjustments as suggested.
Learning goals achievement for the whole program are 77.6, 68.88, 78.68, 67.3, and 64.36, respectively. The Achievement of Learning Goals 2, 4, and 5 are lower than the predefined satisfaction level of 70 (see Table 3). Necessary changes of curriculum, content, or teaching method will be implemented to improve the learning goal achievement in the future.
Learning Goal Achievement.

Note. Learning Goals 2, 4 and 5 failed to meet the 70 minimum standard.
Limitations
The authors recognize the model’s validity is constrained by the following six inherent limitations.
First, the model cannot be implemented without the mission statement leads to learning goals that are generalizable throughout the curriculum.
Second, not all of the learning goals manifested in institution’s mission statement are pursued in the classroom. Extracurricular programming may seek to pursue mission statement learning goals.
Third, the model’s foundation, the host institution’s course grading system is subject to the rigor of each instructor. Thus, some instructors may “game” the system for their own purposes. We recognize that the outliers, both left and right tails, may influence the results.
Fourth, the model assumes that each instructor’s apportions and delivers instruction accurately reflecting the requisite learning goals. Fifth, the model cannot be generalized to courses taken outside the institution’s curriculum. Finally, the model is not intended to replace any other measures that may be in use. Our literature review found nothing about the reflected attempts at direct linkage. It is offered as an initial step in filling the gap. Whether it is used in conjunction with other measures is a matter of institutional choice.
Application of the Model to a Business School
The model was applied to a business school with five learning goals in the BBA program and five learning goals in the MBA program in the fall semester of 2011. Students in both BBA and MBA programs had 1 week of orientation. The mission and learning goals were introduced to the students during the new student orientation and new faculty orientation. Students were subsequently reminded of the mission statement’s learning goals and the specific course through the syllabus. Syllabi are continually reviewed at the departmental level to confirm that each instructor demonstrates a linkage between the mission statement’s learning goals and the course to be delivered. Thus, all parties, students, and instructors should be familiar with the linkages between school mission and learning goals.
Table 4 shows that there 44 BBA courses and 22 MBA courses that were used to measure the learning goal achievement. The means of the weights are 28%, 16%, 29%, 13%, and 14% of the Learning Goals 1, 2, 3, 4, and 5, respectively, for the BBA program. The maximum percentages of weights were 60%, 40%, 100%, 40%, and 30% for the Learning Goals 1, 2, 3, 4, and 5, respectively, for the BBA program. The minimum percentage of weight was 0 for every learning goal for the BBA program. The average percentages of the weights for the MBA program were 32%, 16%, 27%, 9%, and 15% for the Learning Goals 1, 2, 3, 4, and 5, respectively. The maximum percentages of weights were 50%, 30%, 70%, 20%, and 30% for the Learning Goals 1, 2, 3, 4, and 5 for the MBA program. Except the Learning Goal 1 with 20% minimum weight, all the other learning goals had 0% minimum weight for the MBA program. The minimum and maximum numbers of student in a course are 4 and 88, respectively, for the BBA program. The minimum and maximum numbers of students in a course were 1 and 25, respectively, for the MBA program.
Descriptive Statistics for the Learning Goals and Weights of the Programs.
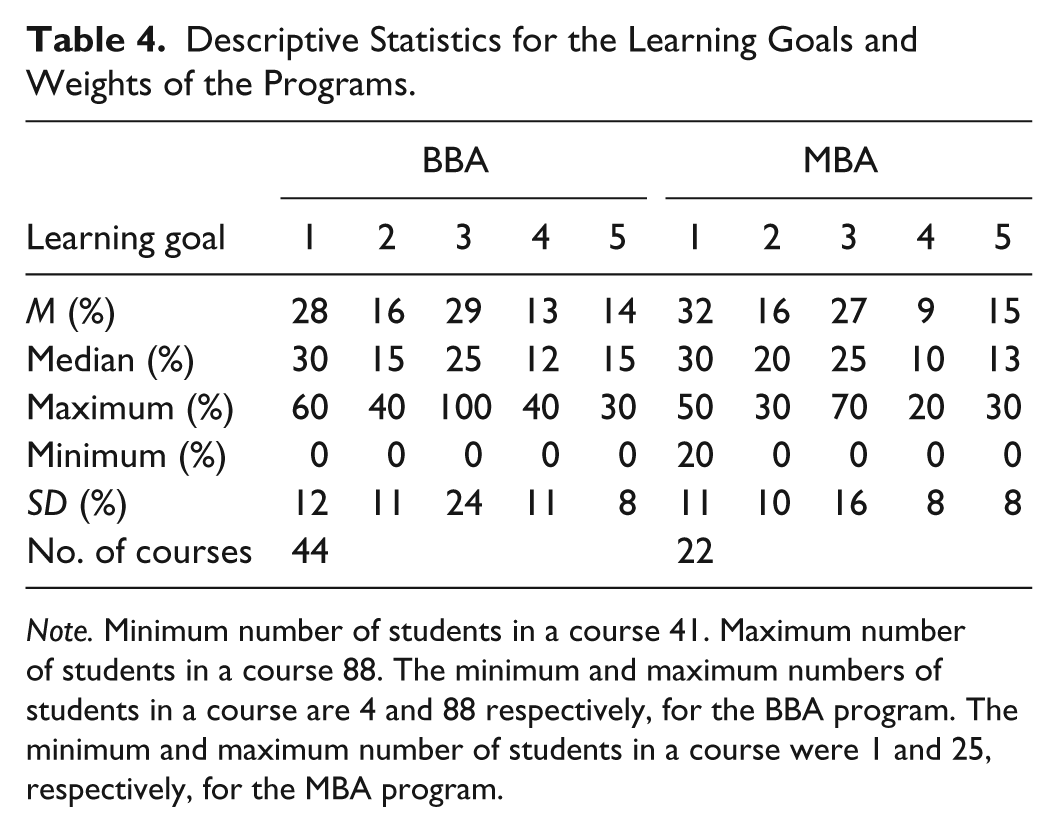
Note. Minimum number of students in a course 41. Maximum number of students in a course 88. The minimum and maximum numbers of students in a course are 4 and 88 respectively, for the BBA program. The minimum and maximum number of students in a course were 1 and 25, respectively, for the MBA program.
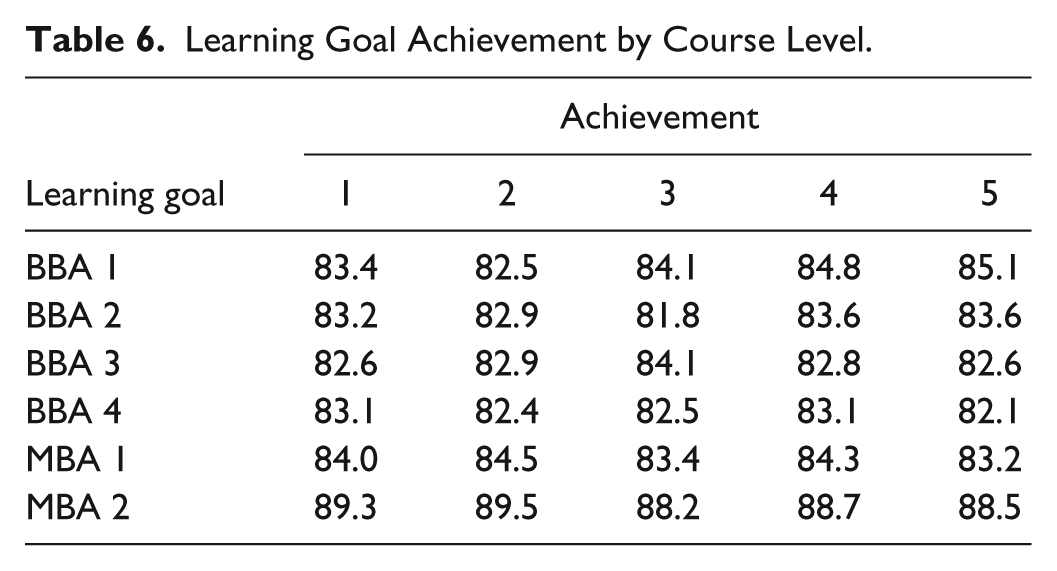
Tables 5, 6, and 7 show the learning goal achievements by program, course level, and specialization. It is shown that the MBA program has higher learning goal achievement; especially the MBA second year students have the highest learning goal achievement among all of the students. Specialization 1 has the highest learning goal achievement among all of the specializations. The lowest achievements of Learning Goals 1, 2, 3, 4, and 5 are BBA 3, BBA 4, BBA2, BBA 3, and BBA 4. This information can be used in the future improvement process.
Learning Goal Achievement by Program.

Learning Goal Achievement by Course Level.
Learning Goal Achievement by Specialization.
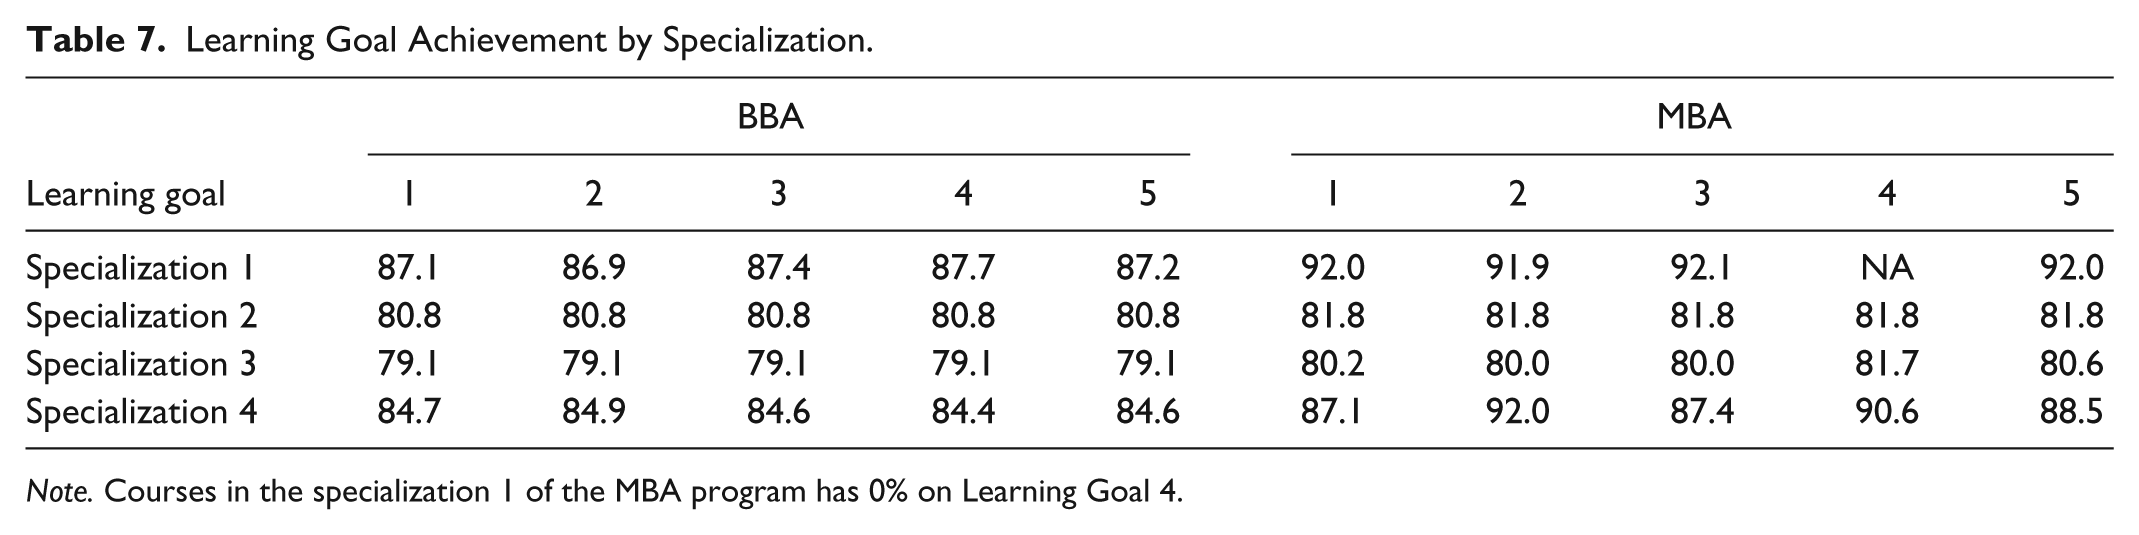
Note. Courses in the specialization 1 of the MBA program has 0% on Learning Goal 4.
The results indicate that overall the BBA and MBA programs both have learning goal achievement of more than 80. However, most of the results are lower than the predetermined learning goal satisfaction level of 85. The improvement process, including curriculum, teaching method, and contents, and so on are discussed in the curriculum and faculty group meetings. New information on learning goal achievement is collected in the following semester for another round of assessment. With more data available from several semesters, the learning goal achievement over time can be used to analyze the trend of each learning goal for the program as a whole, the course levels, and specializations.
Conclusion
A higher education institution’s mission statement should communicate its purpose and goals to both internal and external stakeholders. Unless there is a means of assessing the statement’s efficacy, its value is purely for public relations. Most teaching institutions’ mission statements directly or indirectly speak to student learning. Focusing on business schools, a literature review found little evidence of mission statement influence at the individual course level. Studies assessing the linkage between individual courses and the school’s mission statement are few. More comprehensive studies assessing the linkage from assemblages of multiple-section courses, majors, and programs could not be located in the available literature.
This simple yet robust proxy of linkage will benefit business schools and other institutions in two complementary ways. It will enable them to demonstrate more effectively to their external stakeholders that the strength of the mission statement’s influence in the classroom and will assist internal stakeholders in identifying the strengths and weakness of the linkages across the institution. Incidentally, it will bolster institutional documentation that they are in fact doing what the mission statements claim.
This article provides a cost-effective comprehensive metric-gauging institutional teaching/learning performance directly linked to the mission statement. Using data routinely prepared in the classroom, that is grades/scores, professors only need to provide information of percentages/weights of each learning goal of the course. There is no extra cost of data collection. It has minimal impact on faculty and staff time. It can be applied to nearly all courses across the curriculum. And the data are ready for analysis by the mathematical formulas in this article.
Segments of the data may be compared and contrasted across multiple dimensions. The achievement of classroom performances can be aggregated into the program as a whole, and be disaggregated into course level, specialization, class, and so on. These data can be used to analyze the achievement of the learning goals that are linked to the institutional mission and can be used for the future improvement of the curriculum, teaching, and course contents. The classroom performances of a program, course level, specialization, or class from consecutive years can be used to study and compare the learning goal achievements over time. Repeated applications will contribute to continuous quality control. All of this information is clear and concise and can be used for communication with stakeholders, such as faculties, students, staffs, employers, government, and communities. More importantly, it can be easily applied to every institution. The school that decides to utilize this model can take all the procedures and mathematical formulas without any major modification. Expansion and modification for special purposes and applications are simple tasks.
The learning goals have to be measurable to be used in the mathematical model of this article. However, many mission statements are open ended and may not contain the requisite specific or at least implied learning goals. Those learning goals that are hard to be measured may have difficulties to implement the mathematical model in this article. Courses with pass and fail grades and courses that are studied abroad are not appropriate for the mathematical formulas and may have to be left out of the analysis. Every semester, every year, there is a requirement of continuing refinement of the curriculum, teaching method, and content. It requires all faculty members and students to understand the importance of the mission statement and the linkage between the learning goals and the mission statement. Without the faculty commitment the mathematical model of this article will not be able to provide useful information in the pursuit of institutional quality.
This model is the first, to the authors’ knowledge, to explore the evidence of an institution’s mission statement on classroom instruction are the curriculum. It should be replicated in other institutions to validate its efficacy beyond the confines of its infancy. There are ample opportunities to explore additional statistical tools, including analysis of covariance.
Footnotes
Declaration of Conflicting Interests
The author(s) declared no potential conflicts of interest with respect to the research, authorship, and/or publication of this article.
Funding
The author(s) received no financial support for the research and/or authorship of this article.