
Abstract
Continuous Performance Tests (CPTs) are commonly utilized clinical measures of attention and response inhibition. While there have been many studies of CPTs that utilize a visual format, there is considerably less research employing auditory CPTs. The current study provides initial reliability and validity evidence for the Auditory Vigilance Screening Measure (AVSM), a newly developed CPT. Participants included 105 five- to nine-year-old children selected from two rural Midwestern school districts. Reliability data for the AVSM was collected through retesting of 42 participants. Validity was evaluated through correlation of AVSM scales with subscales from the ADHD Rating Scale–IV. Test–retest reliability coefficients ranged from .62 to .74 for AVSM subscales. A significant (r = .31) correlation was obtained between the AVSM Impulsivity Scale and teacher ratings of inattention. Limitations and implications for future study are discussed.
Keywords
Continuous performance tests (CPTs) are commonly utilized in the evaluation of attention and response inhibition. Early clinical measures of attention, however, typically included rote recall tasks similar to digit span and digit symbol tasks. As an alternative to the more traditional recall tasks, Rosvold, Mirsky, Sarason, Bransome, and Beck (1956) developed a CPT involving the use of an apparatus that presented letters visually at a fixed rate. The participant was then asked to respond whenever the letter X was presented (X-CPT), while also inhibiting responses to other letters. This X-CPT was followed by a second task which required the participants to respond to the letter X only when it was preceded by the letter A (AX-CPT).
Many current CPTs are very similar in format to the original Rosvold et al. (1956) CPT, although many variations have since been introduced. For example, CPTs may vary in terms of presentation modality, target type, criteria for responding, stimulus intensity and frequency, placement of target stimulus in visual or auditory field, and duration of stimulus presentation (Riccio, Reynolds, & Lowe, 2001). While many aspects of the task have been altered, the unifying characteristics of CPTs have not. A CPT involves presentation of continuously changing stimuli with a designated target stimulus or target pattern. The participant is directed to respond to specific target stimuli while refraining from responding to nontarget stimuli.
Various performance indicators have been utilized in examining an individual’s CPT performance. Traditional performance indicators include total number of correct responses, errors of omission, and errors of commission. While the total number correct reflects overall accuracy, errors of omission are typically associated with inattention, and errors of commission are generally associated with impulsiveness or hyperactivity (Barkley, 1997; Halperin et al., 1988; Riccio, Reynolds, & Lowe, 2001). Halperin and colleagues (Halperin, Wolf, Greenblatt, & Young, 1991; Halperin et al., 1988) further investigated commission error subtypes with A–X CPT. They noted that commission errors associated with rapid false responses (i.e., A-not X errors) are generally associated with impulsivity, while those associated with delayed responses (i.e., X-only errors) are typically associated with inattention. Further validation of the commission error subtypes has subsequently been examined with mixed results (Halperin, Sharma, Greenblatt, & Schwartz, 1991; Marks, Himelstein, Newcorn, & Halperin, 1999; Matier-Sharma, Perachio, Newcorn, Sharma, & Halperin, 1995; Nigg, Hinshaw, & Halperin, 1996).
CPTs are most commonly utilized as part of a comprehensive evaluation for referrals related to inattention, such as a suspected attention deficit hyperactivity disorder (ADHD; Barkley, 1997; Riccio, Reynolds, & Lowe, 2001). A great deal of research has been conducted utilizing CPTs to distinguish between ADHD and non-ADHD participants with most studies indicating impaired performance for ADHD subgroups. These results were obtained with auditory, as well as visual CPTs. While more of the studies indicated superiority of omission errors in discriminating between ADHD and non-ADHD groups (Berlin, Bohlin, Nyberg, & Janols, 2004; Collings, 2003; Forbes, 1998; Perugini, Harvey, & Lovejoy, 2000; Teicher, Ito, Glod, & Barber, 1996), several studies suggested that commission errors provide better discriminative power (Shapiro & Herod, 1994; Sykes, Douglas, & Morganstern, 1972; Zentall & Meyer, 1987).
CPTs have also been utilized to evaluate the effectiveness of various interventions for attentional disorders. Most commonly, these interventions have included psychostimulant treatment (Barkley, 1997; Riccio, Reynolds, & Lowe, 2001). CPT performance has generally shown significant improvement with the introduction of psychostimulant medications (Barkley, Fischer, Newby, & Breen, 1988; Fischer, Newby, & Gordon, 1995; Keith & Engineer, 1991; Nigg et al., 1996; Pollak, Shomaly, Weiss, Rizzo, & Gross-Tsur, 2010; Tillery, Katz, & Keller, 2000). In addition, these improvements have been observed across major performance indicators.
Riccio, Waldrop, and Reynolds (2001) noted that there are many advantages for using CPTs as measures of attention. Primarily, CPTs demonstrate excellent face validity, as they appear to directly measure the ability of a person to sustain attention for an extended period of time. They are objective and are not subject to biases that have been shown to influence behavioral ratings. Riccio et al. (2001) also indicated that the ease of administration is an advantage in the use of CPTs. In addition, CPTs have the advantage of not being significantly impacted by practice effects and, thus, can be given several times to monitor intervention effectiveness (Thompson, 1988).
Despite their popularity, there are only a handful of studies examining the reliability of CPTs. The test–retest reliability estimates of CPTs utilizing visual stimulus presentation (Halperin, Sharma, et al., 1991; Harper & Ottinger, 1992; Llorente et al., 2000) range from .50 to .75 for total correct hits, omission, and commission errors. Two of these studies also examined internal consistency reliability (Halperin, Sharma, et al., 1991; Llorente et al., 2000) and provide internal consistency estimates that range from .71 to .99 for total correct hits, commission errors, and omission errors. Only one reliability study utilizing an auditory CPT could be located. Test–retest reliability coefficients for the Auditory Continuous Performance Test (Keith, 1994) were collected utilizing 46 seven-year-old children (r = .67) and 40 nine-year-old children (r = .74). As such, there continues to be a need for further investigation of the reliability of auditory CPTs.
The validity of CPTs has been investigated through various methods. Many studies have compared CPT performance with ratings on teacher and parent behavioral rating scales. The majority of these studies have indicated a significant correlation between CPT performance indicators and behavioral ratings. Furthermore, a number of studies have confirmed the relationship between omission errors and ratings of inattention (Driscoll, 1994; Epstein, Erkanli, & Conners, 2003; Halperin et al., 1988), as well as commission errors and ratings of impulsivity (Aylward, Gordon, & Verhulst, 1997; Epstein et al., 2003; Halperin et al. 1988; Oppenheimer, 1986; Shapiro & Herod, 1994). Interestingly, Oppenheimer noted that the Total Correct score for the visual CPT was more highly correlated with parent ratings, while Total Correct for the auditory CPT was more highly related to teacher ratings.
CPT performance has also been compared with direct observations of behavior (Arcia & Roberts, 1993; Barkley, 1991; Harper & Ottinger, 1992; Kupietz & Richardson, 1978). These studies have generally found significant correlations between direct observational measures and CPT performance; however, there does not appear to be a consistent trend in indicating a relationship between certain behaviors and specific performance indicators. Likewise, mixed results were obtained in studies comparing CPT performance indicators with clinical measures of physical movement (Marks, Himelstein, Newcorn, & Halperin, 1999; Matier-Sharma et al., 1995; Reichenbach, Halperin, Sharma, & Newcorn, 1992; Teicher et al., 1996). Recently, the factor structure of a popular not-X visual CPT has been evaluated (Egeland & Kovalik-Gran, 2010) yielding a five-factor model, although little research on the factor structure of CPTs has been completed.
While there are a number of CPTs currently available, the vast majority utilize visual presentation of stimuli, which require a computer for administration or a stand-alone microprocessor unit. Four popular CPTs (i.e., Gordon Diagnostic System, Conners’s CPT, Integrated Visual and Auditory CPT, and Test of Variables of Attention) range in price from US$590 to US$1,595. Two of these measures also charge additional scoring fees. Thus, the expense of utilizing these measures is prohibitive to their popular use, especially in school districts where fiscal resources are quite limited.
Another difficulty frequently encountered with current CPTs is apparent ceiling effects (Berlin et al., 2004; Doyle, Biederman, Seidman, Weber, & Faraone, 2000; Fischer et al., 1995; Holmes, Hever, & Hewitt, 2002; Mahone, Pillion, & Hiemenz, 2001; Perugini et al., 2000), which seem related to the ease of visual format CPTs and use across too broad an age range. It has been suggested that auditory CPTs are more difficult than visual CPTs and, thus, less likely to produce such ceiling effects (Aylward, Brager, & Harper, 2002; Driscoll, 1994; Mahone et al., 2001).
Taken together, there continues to be a need for an objective measure of attention that addresses some of the shortcomings of current CPTs. The Auditory Vigilance Screening Measure (AVSM) was constructed by the primary author to meet this goal. The AVSM is an auditory CPT that is inexpensive, portable, easy to administer, and is designed to circumvent the psychometric shortcomings such as ceiling effects (review instrumentation for detailed description of AVSM). The AVSM is 6 min in length, which was determined to be more manageable for early elementary children. Its brevity would also make it more useful in frequent monitoring of intervention effectiveness. In addition, it was hypothesized that by utilizing the auditory format, the AVSM would continue to elicit sufficient errors to be clinically useful. In addition, the test is targeted for use with early elementary students, where a shorter assessment may be better tolerated by examinees.
The purpose of the current study was, therefore, to provide initial evidence of reliability and validity for the AVSM as a measure of attention in kindergarten through third grade children. The following research questions framed the context of the present study:
Method
Participants
The current study utilized 105 participants from two rural Midwestern public elementary schools. All students were between 5 years 0 months and 9 years 11 months of age, which is the age range generally represented by Kindergarten through third-grade students. Fifty-seven of the participants were male and 48 were female. The average age for the participants was 88 months (7 years 4 months). This study included 21 five-year-old, 29 six-year-old, 19 seven-year-old, 18 eight-year-old, and 18 nine-year-old participants. One hundred and four participants were Caucasian and 1 participant was African American. On receipt of consent for participation, 1 parent indicated that their child took medication to treat an ADHD. As the purpose of the study was to determine how this instrument works across the range of attention levels, this student was included in the current study.
One hundred and four of the rating scales for the current study were completed by Elementary classroom teachers employed in the participating districts. One rating scale was completed by a paraprofessional who worked directly with a participant with a visual-impairment. Teachers had the participants in their classroom for a minimum of 30 days prior to completing the rating scales.
Instrumentation
The AVSM (see the appendix) is an auditory X- and AX-CPT, which was developed by the primary investigator. The AVSM is intended for use with elementary students in kindergarten through third grade. Target and nontarget stimuli for the AVSM are presented via an audio recording. The interstimulus interval (ISI) for all AVSM stimuli is 2 s. The audio recording was made using a multitrack recorder and digital metronome set to “click” at 1 s intervals. The numbers were read once every other click and the metronome track was then edited out of the audio recording. Stimuli for the AVSM consist of the numbers one through nine, excluding seven. The number seven was excluded because it is multisyllabic, which would result in a shorter ISI than with the other numbers. Directions for the AVSM require that students be screened to determine if they have basic numerical knowledge by having them count from 1 to 10. If a child cannot count from 1 to 10, testing is discontinued.
The AVSM consists of two sections, Part A and Part B. Part A is an X-CPT which requires the student to raise his or her hand whenever they hear the number nine. For Part A, there are 26 target and 64 nontarget stimuli which are presented at the rate of 1 stimulus every 2 s. With a total of 90 target and nontarget stimuli, Part A has a duration of 3 min. Part A is preceded by a practice task that includes three target (9) and three nontarget stimuli. If the child is unable to successfully complete the practice items, the examiner is directed to provide further instruction on how to complete the task. Conversely, if the child is successful with the practice items, the examiner directs the child to listen to the recording of stimuli for Part A. The examiner then records responses by circling the number on the protocol that corresponds to the number presented on the audio recording whenever a participant raises his or her hand.
Part B of the AVSM is an AX-CPT, which requires the child to raise his or her hand whenever the numerical sequence of 3–9 is presented. Part B includes 16 occurrences of the target sequence of 3–9, and 74 nontarget stimuli. Part B also has a total of 90 target and nontarget stimuli and lasts 3 min. The organization of Part B is similar to Part A: Following directions by the examiner, the child completes a practice task which includes the target sequence of 3–9 and 4 nontarget stimuli. If the child is unable to successfully complete the practice items, the examiner is again directed to teach the task. If the child is successful with the practice items, the examiner directs the child to listen to the recording of stimuli for Part B. Recording of responses is completed similarly as in Part A of the AVSM.
Following administration, items are scored in the following manner. Total number of correct responses is calculated by summing the number of correct responses to target stimuli. Omission errors are scored by summing the number of target items for which an examinee failed to provide a correct response. Commission errors are calculated by summing the number of nontarget items for which an examinee demonstrated a response.
This study also examined the utility of adapting Halperin’s commission error subtypes (A-not-X errors, and X-only errors) for Part B of the AVSM. A-not-X errors refer to responses where the participant erroneously responds to numbers other than 9 following the presentation of the priming stimulus 3. For scoring simplicity, this is referenced as “3-not-9 Errors” on the protocol. X-only errors refer to situations where the participant responds to the number 9 when it is preceded by any number other than 3. This is referenced as “9-not-3 Errors” on the AVSM protocol. Consistent with previous CPT research, omission and commission errors for the X-format portion of the AVSM contribute to the AVSM Inattention and Impulsivity Scales. Omission errors from both portions of the test are combined with X-only errors (9-not-3 errors) to form an inattention scale. Commission errors from the X-format portion of the test are combined with the most frequently occurring error subtype, A-not-X errors (3-not-9 errors) to form an Impulsivity Score.
The School version of the ADHD-IV was used as a criterion measure of attention. The ADHD-IV is a brief norm-referenced rating scale designed to gather information from teachers with regard to inattentive, impulsive, and hyperactive behaviors demonstrated by students. The ADHD-IV contains two 9-item subscales (Inattention, Hyperactivity-Impulsivity) which reflect behaviors from the Diagnostic and Statistical Manual of Mental Disorders (4th ed.; DSM-IV; American Psychiatric Association, 1994) ADHD subtypes. The ADHD-IV utilizes a 4-point Likert-type rating scale of 0 (never or rarely) to 3 (very often) to describe the frequency of behaviors associated with each test item. Questions associated with each subscale are presented in an alternating symptom format.
Normative information for the ADHD-IV was obtained through a standardization sample of 1,040 boys and 948 girls ages 4 to 19 years (M = 10.6, SD = 3.6). Internal consistency and test–retest reliability data are presented for the ADHD-IV (DuPaul et al., 1998). Internal consistency alpha coefficients ranged from .88 to .96 for the ADHD-IV. Test–retest coefficients (4-week retest) were .90, .89, and .88 for the Total score, Inattention, and Hyperactivity-Impulsivity scales, respectively.
Criterion validity for the ADHD-IV is supported through comparisons with behavior rating scales, observations, and relationships with classroom productivity (DuPaul et al., 1998). The ADHD-IV Total, Inattention, and Hyperactivity-Impulsivity scores demonstrated significant correlations with the Conners’ Teacher Rating Scales (CTRS)-39 Hyperactivity Score (.73, .79, and .86, respectively). The ADHD-IV Total, Inattention, and Hyperactivity-Impulsivity scores also demonstrated significant correlations with the CTRS-39 Daydream-Attention Problems Score ( .80, .85, and .44, respectively,). The ADHD-IV Inattention and Total scores were also significantly correlated with direct observations of off-task (.35 and .34, respectively) and fidgety behavior (.28 and .29, respectively). Furthermore, an academic efficiency score (AES) was calculated for participants based on three samples of independent seatwork. All ADHD-IV scales demonstrated a significant negative correlation with AES, ranging from −.47, −.46, and −.34 for the Total, Inattention, and Hyperactiviy-Impulsivity Scales, respectively. Thus, as a student’s ratings on one or more of the ADHD-IV scales increases, work productivity generally decreases.
Exploratory and confirmatory factor analyses of the ADHD-IV test items supported one- and two-factor models (DuPaul et al., 1998). The two-factor model was selected as it was consistent with the DSM-IV classification system for ADHD. Information is also presented in support of the discriminant validity of the ADHD-IV. The ADHD-IV Inattention and Hyperactiviy-Impulsivity subscales were found to differentiate significantly between children diagnosed with ADHD Combined, ADHD-I, and psychiatric controls. Classification rates ranged from 65% to 84% for the three ADHD-IV scales.
Procedure
A description of the study was provided to parents of 5- through 9-year-old children in addition to consent forms. The forms were sent home with each child by their classroom teachers. Thirty-seven percent of the consent forms were signed by parents and returned. The consent included several questions that ask whether the parents suspect that their participating child has any hearing or attention difficulties, or takes medication for an attention-related disorder. Significant difficulties with hearing would render the AVSM inappropriate as a measure of attention. In addition, each child was given a verbal description of the study and assent was obtained before any testing occurred.
All testing was conducted in a quiet space that was free of distraction. The AVSM was administered to each child according to test directions by the primary investigator who had 14 years experience as a practicing school psychologist at the time of data collection. At the time of testing, classroom teachers for each child were provided with the ADHD-IV protocols. Each teacher was encouraged to complete the ADHD-IV rating scales as promptly as possible and return them to the researcher. The average interval for return of the completed protocols was 9 days. To provide test–retest data, a subset of 42 participating students were randomly selected and retested with the AVSM. The average retest interval was 11 days. Following administration, items were scored in the manner, stated earlier.
Data Analysis
Initially, raw scores from the individual administrations of the AVSM were pooled and analyzed. Analyses of possible age and gender differences were investigated through use of separate two-way between-group ANOVA procedures to determine whether there are significant AVSM score differences for age, gender, and the interaction between age and gender. This information was used to determine if separate normative groupings were necessary for age and/or gender. This information was also utilized to determine groupings for calculating standard scores (M = 100, SD = 15) for AVSM subscales. Standard scores (M = 100, SD = 15) were also calculated for ADHD-IV subscales utilizing descriptive information published in the ADHD-IV test manual (DuPaul et al., 1998). Subsequent analyses were conducted with the computed standard scores.
Research Question 1 addresses the reliability of the AVSM, which was examined through bivariate correlation of standard scores of the AVSM performance indicators between the two administrations of the AVSM. Research Questions 2 and 3 were addressed via computation of bivariate correlations between the AVSM Inattention and ADHD-IV Inattention scores as well as between the AVSM Impulsivity and ADHD-IV Hyperactivity-Impulsivity scores.
Results
Two-way between-group ANOVA procedures were conducted to determine the impact of age and gender on AVSM Omission Errors, Commission Errors, 3-not-9, and 9-not-3 subscales. Levene’s Test for Equality of Error Variance was completed for each analysis. F-test values for all Levene’s Test of Equality of Error Variance analyses were significant (p < .05) indicating that variance for each AVSM Scale is not equal across the different age and gender groups. In such cases, it has been recommended (Stevens, 1999) that more stringent significance levels be utilized for evaluating the results of two-way ANOVAs. For the presented ANOVA’s, .01 was utilized to determine significance. A significant main effect, F(4, 94) = 5.12, p = .00, was obtained for age with AVSM commission errors. Based on these results, standard scores for subsequent analyses with the AVSM Scales were computed for 1-year age groupings.
Initial inspection of data indicated four extreme scores that might have a significant influence on further data analyses. Further inspection of the protocols was conducted to determine if each participant understood the task, or if there was an unusual pattern of responses that might threaten the validity of the assessment. For example, a participant might respond to all items, no items, or consistently to a nontarget number. For three of the cases, the inspection did not indicate such difficulties; therefore, they were included in all analyses. One 6-year-old participant responded to all 3’s and 9’s on Part B of the AVSM, thus yielding 33 commission errors. This score is approximately 3.9 standard deviations above the mean for 6-year-old participants and seemed to indicate that the participant did not follow test directions for that portion of the test. For this reason, this participant was excluded from all analyses.
Means and standard deviations for AVSM scales are shown in Table 1. Table 2 provides intercorrelations for the AVSM Scales. In reviewing the reported correlations, it is important to note that 3-not-9 and 9-not-3 errors were highly correlated with commission errors because they are commission error subtypes. Test–retest reliability coefficients were computed between first and second testing of the AVSM. Test–retest reliability coefficients for the AVSM Omission Errors, Commission errors, Inattention Scale, and Impulsivity Scale are .62 (p < .001), .64 (p < .001), .64 (p < .001), and .74 (p < .001), respectively. Table 3 provides means and standard deviations for initial and retesting with the AVSM.
Means and Standard Deviations (in Parentheses) for AVSM Scales.
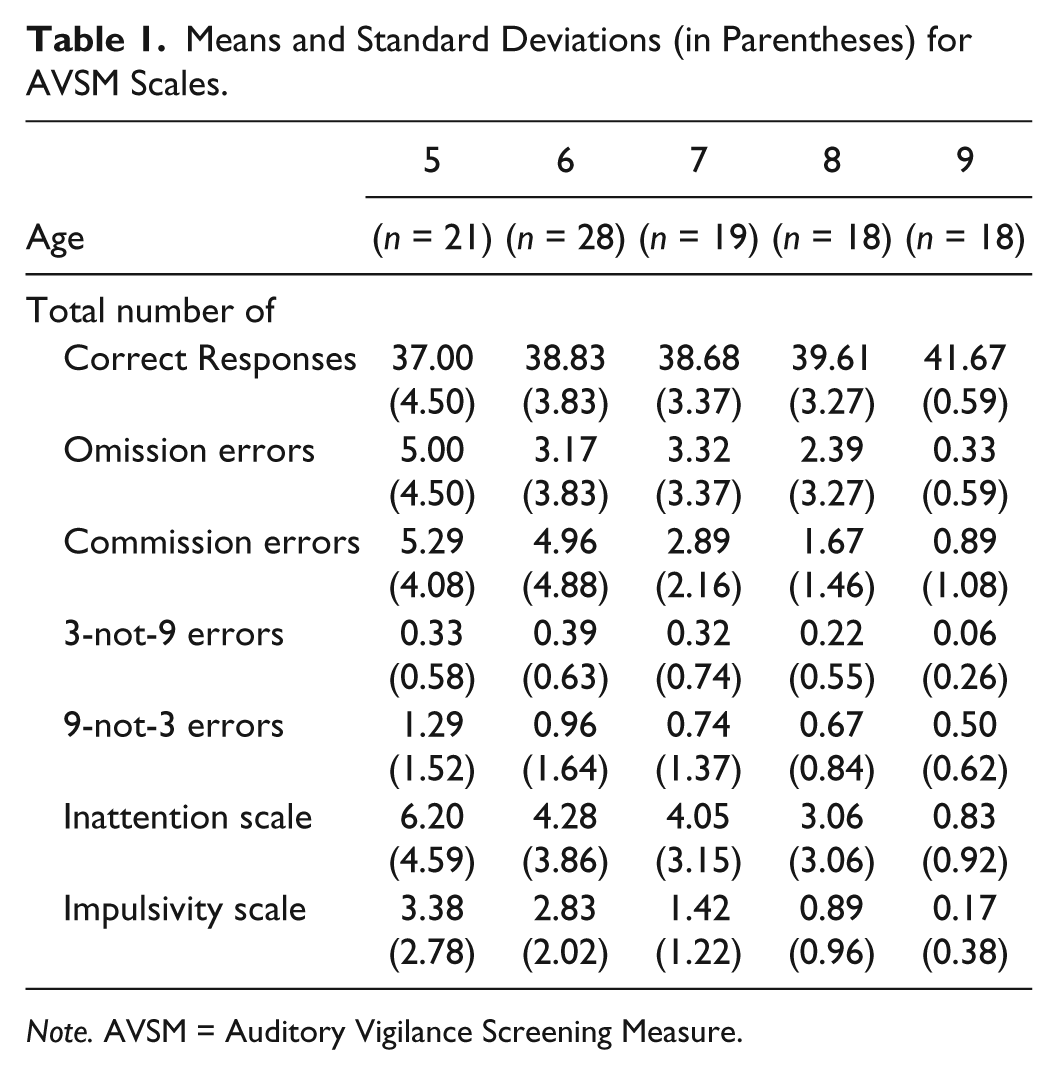
Note. AVSM = Auditory Vigilance Screening Measure.
Intercorrelations for AVSM Scales (n = 104).

Note. AVSM = Auditory Vigilance Screening Measure.
p < .05. **p < .01.
Means and Standard Deviations (in Parentheses) for AVSM Test–Retest (n = 42).
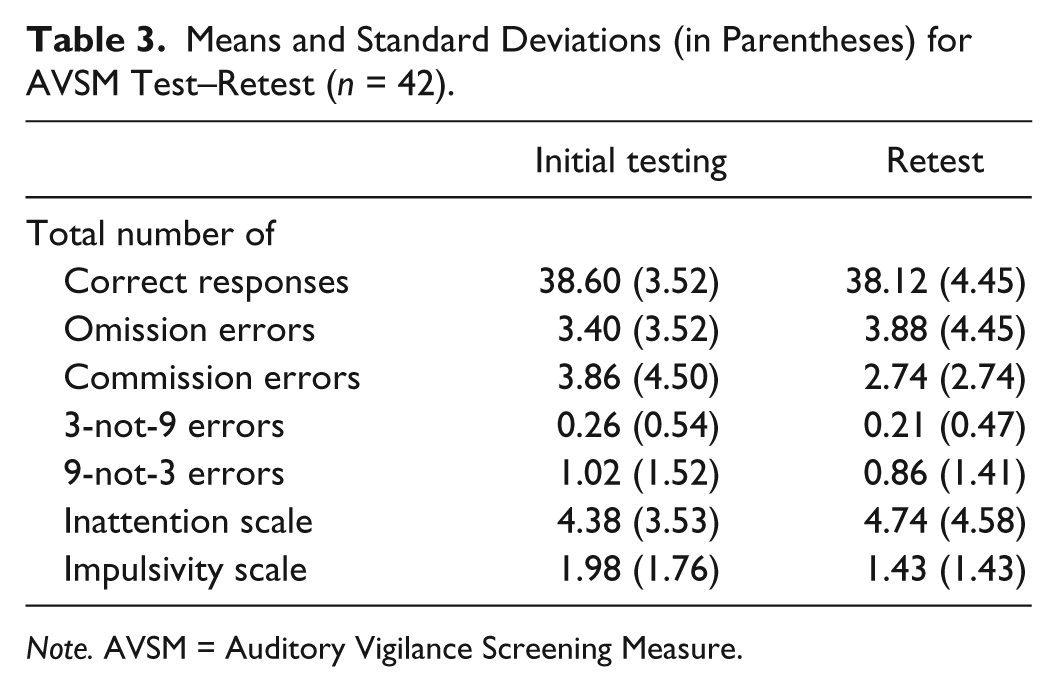
Note. AVSM = Auditory Vigilance Screening Measure.
For criterion-related evidence for validity, correlations were computed between AVSM and ADHD-IV scales. Table 4 provides bivariate correlations between AVSM Scales and ADHD-IV Subscales. AVSM Commission Errors were significantly correlated with the ADHD Inattention (r = .31, p < .01) and Total Scales (r = .27, p < .05). AVSM 3-not-9 Errors were also significantly correlated with ADHD Inattention (r = .25, p < .05) and Total Scales (r = .23, p < .05). In addition, the AVSM Impulsivity Scale was significantly correlated with the ADHD Inattention Scale (r = .31, p < .01). It should be noted that the ADHD-IV Inattention and Hyperactivity/Impulsivity Scales were also significantly correlated (r = .638, p < .001).
Correlations Between AVSM and ADHD-IV Teacher Rating Scales (n = 104).

Note. AVSM = Auditory Vigilance Screening Measure; ADHD = attention deficit hyperactivity disorder.
p < .05. **p < .01.
Discussion
Overall, the results of the current study indicate several strengths of the AVSM. Participants demonstrated few difficulties understanding the directions or completing the AVSM. Only 1 of the 105 participants demonstrated observable difficulties understanding task demands for Part B of the AVSM. As such, there did not appear to be significant cognitive demands in the AVSM that would confound results. Because of the shorter administration time, the AVSM has some appeal for use with early elementary children who may not cooperate with longer assessments. Also, differences in performance between same-aged males and females were not found, thus the AVSM appears to be gender fair.
While the current study yielded reliability data that is below the generally accepted convention of .80, it has been suggested (Cicchetti, 1994; Heilbrun, 1992) that .70 may be a more acceptable level for evaluating such clinical instruments. Test–retest reliability coefficients for the AVSM Omission and Commission Errors, as well as the Inattention and Impulsivity Scales, ranged from .62 to .74. These results are generally consistent with the results of recent studies of test–retest reliability for visual CPTs. It is possible that the state nature of attention may reduce the possible magnitude of correlations in test–retest studies of CPTs. This may be even more evident with young children. Harper and Ottinger (1992) have also noted the instability of performance of young children and the related impact on test–retest reliability coefficients. Moreover, there were few students who received significantly high ratings on the Inattention or Hyperactivity/Impulsivity Scale of the ADHD-IV. Considering the restriction of range in the teacher ratings, the moderate reliability coefficients suggest that coefficients above .80 may be attainable with a more heterogeneous sample.
Traditionally, omission errors have been associated with inattention and commission errors have been associated with impulsivity and/or hyperactivity. As discussed, Halperin, Wolf, et al. (1991) also provided evidence that the broad category of commission errors is made up of various subtypes, which can be associated with attention or impulsivity/hyperactivity. Results of the current study found very little relationship between the AVSM Inattention Scale or Omission errors with teacher ratings of inattention. Conversely, the AVSM Impulsivity Scale and Commission errors were significantly correlated with teacher ratings of inattention, although these correlations were of a low magnitude. A commission error subtype, 3-not-9 errors, which was hypothesized to be associated with impulsivity/hyperactivity, demonstrated a significant correlation with teacher ratings of inattention, although this correlation was also of a low magnitude.
As stated, the newly developed AVSM Inattention and Impulsivity Scales did not have a high degree of association with attention or hyperactivity/impulsivity, as rated by classroom teachers. While there was a significant relationship between the AVSM Impulsivity Scale and teacher ratings of inattention, this is not consistent with the design of the measure, as the AVSM Impulsivity Scale comprised commission errors which were predicted to be associated with hyperactivity and impulsivity. Previous research has provided mixed results in this area with multiple studies supporting each interpretation. The weak correlations obtained in this study do little to resolve this controversy.
There are several factors that may have contributed to the lack of a strong relationship between CPT performance and teacher ratings of attention and impulsivity/hyperactivity. The restriction of range in teacher ratings on the ADHD-IV may have contributed, as there were few students who received significantly high ratings on the ADHD-IV. The high correlation between the ADHD-IV Inattention and Hyperactivity/Impulsivity Scales also suggests that teachers of such young children may have a broader perception of what constitutes normal attention, impulsivity, and hyperactivity for that age group.
With the few students obtaining extreme behavioral ratings, it is possible that issues related to participant selection could have impacted results. Out of the 105 participants, only 1 parent indicated on the consent form that their child was being treated for an attention-related disorder. Furthermore, only 1 parent indicated concern related to their child’s attention. It is possible that parents who suspected their child may have difficulties with attention, hyperactivity, or impulse control were reluctant to participate in the study.
While the AVSM demonstrates excellent face validity, the results of the current study provide limited psychometric data to support use of the AVSM as a screening measure of attention, hyperactivity, or impulsivity. These results continue to reinforce Barkley’s (1991) observation that, while clinic-based measures demonstrate excellent face validity, psychometric validity is low to moderate. Halperin, Sharma, et al. (1991) have suggested that because children with attentional difficulties are so heterogeneous, no single measure will emerge that adequately reflects deficits in attention and hyperactivity. Certainly, the current study continues to underscore the need for practitioners to include additional clinical assessments, observations, and rating scales in the assessment of suspected ADHD.
In addition, results of the current study provide little support for use of Halperin, Wolf, Greenblatt, & Young’s (1991) commission error subtypes in improving the validity of CPTs. Halperin’s research with these measures was conducted with visual CPTs and, thus, it may not readily translate to auditory CPTs. Given the restricted range of teacher ratings and its possible impact on the results of the current study, further research with clinical subgroups may also be needed to evaluate the effectiveness of these subscales.
For the current study, teacher rating scales were utilized as a criterion measure. While behavior rating scales have the advantage of collapsing an extended period of observations into a single measure, they cannot yet be established as the “gold standard’ by which measures of attention should be compared. Currently, no such “gold standard” exists as a comparison measure of attention. DuPaul, Anastopoulos, Shelton, Guevremont, and Metevia (1992) have also questioned whether attention in the classroom is the same as attention measured by CPTs in a clinical environment. For example, Melnyk and Das (1992) have suggested that behavior rating scales rate the child’s ability to inhibit responses to distractors rather than what might be considered sustained attention. It is, however, still important to make such comparisons with teacher rating scales to establish the ecological validity of clinical measures, such as CPTs.
For future studies, efforts should be made to include either an ADHD subgroup or substantially more students with significant deficits in attention, impulsivity, or hyperactivity to ensure the adequate range of scores for the correlational analyses. Future studies should also include a larger sample that includes minority participants and participants from varying geographic regions. The current study utilized a sample of primarily Caucasian children from two rural Midwestern communities. As such, the representativeness of the current sample is limited. In addition, while the brevity of the test might make it more tolerable to younger sister, results did show a significant improvement in performance for children older than 8 years. There were few errors committed by participants in the 9-year-old group. This suggests that a longer assessment would be needed to elicit enough errors to be clinically useful with children ages 9 or older.
Footnotes
Appendix
Declaration of Conflicting Interests
The author(s) declared no potential conflicts of interest with respect to the research, authorship, and/or publication of this article.
Funding
The author(s) received no financial support for the research and/or authorship of this article.