
Abstract
Research on school dropout extends from early 20th-century pioneers until now, marking trends of causes and prevention. However, specific dropout causes reported by students from several nationally representative studies have never been examined together, which, if done, could lead to a better understanding of the dropout problem. Push, pull, and falling out factors provide a framework for understanding dropouts. Push factors include school-consequence on attendance or discipline. Pull factors include out-of-school enticements like jobs and family. Finally, falling out factors refer to disengagement in students not caused by school or outside pulling factors. Since 1966, most nationally representative studies depicted pull factors as ranking the highest. Also, administrators in one study corroborated pull out factors for younger dropouts, not older ones, while most recent research cites push factors as highest overall. One rationale for this change is a response to rising standards from No Child Left Behind (NCLB), which can be ultimately tested only by future dropout research.
Keywords
Introduction
The cause of a student dropping out is often termed as the antecedent of dropout because it refers to the pivotal event which leads to dropout. This event, however, is the culmination of a much longer process of leaving school that began long before the date that a student actually discontinues attendance. Historic scholarship on school dropout spans from as early as a 1927 monograph that labeled it “school leaving” and associated those at risk with possible mental inferiority (Fuller, 1927, p. 1). At the same time, previous research has explained dropout causes and even cataloged dropout scholarship from the ensuing decades in terms of content and empirical merit (Dorn, 1993; Rumberger & Lim, 2008; Short & Fitzsimmons, 2007). However, never before have reports of students who dropped out been compared from all the available nationally representative dropout studies and then analyzed. What follows will describe seven nationally representative studies on school dropout and their findings. Also, these studies will be analyzed using the framework of push, pull, and falling out factors, as set forth by Jordan, Lara, and McPartland (1994) and Watt and Roessingh (1994), to determine which types of factors were most prominent. The discussion section will posit potential reasons for predominant types of factors, and the implications this has on dropout scholarship in the past, present, and future.
Background
School completion rates have grown continually during much of the past century from single digits at the turn of the 20th century, to 50% just after World War II, to 80% in the late 1970s, and finally leveling off at near 89.9% in the recent times (Baldwin, Moffett, & Lane, 1992; Chapman, Laird, & KewalRamani, 2010; Dorn, 2003; Jones, 1977). This dramatic shift coincided with educational changes, such as the standards movement in education, as well as social movements and cultural changes, including women’s rights, civil rights, dual income families becoming the norm for many families, and the strong impact of inflation on the need for employment. Partly as a result, it became an essential rite of passage for all adults to have stable work, and school completion guaranteed a higher wage and opened doors to higher educational institutions. Still, the dropout problem has persisted through these changes even amid higher rates of school completion; moreover, it is still found in alarming rates in many culturally and linguistically diverse groups, including African Americans, Hispanic Americans, and immigrants (Rumberger & Larson, 1998; Rumberger & Thomas, 2000; Valenzuela, 1999). Although this problem has earned much scholarship, no previous publication has addressed dropout perceptions in terms of all the nationally representative studies on dropout. These refer to studies done at the federal level, and often using sample sizes of tens of thousands of students. As interesting as it may be, many of these nationally representative studies were named in Rumberger and Lim’s (2008) extensive review of empirical dropout research conducted from 1983 onward; but to date, the dropout antecedents of these studies have not been collected in one volume and analyzed together.
To best understand school dropout as a national problem, studies with nationally representative student populations should be compared together and their findings considered as a whole. Thus, studies which were included in the current research were operationally defined as specifically addressing student-, teacher-, or administrator-reported dropout causes and being funded by federal government (either through the Department of Education, or the Bureau of Labor Statistics [BLS]). The reason for excluding private studies of dropout that included dropout causes had to do with the lack of standardization of survey protocols, including sample selection, sample size, and the fact that although many such studies bore fruitful intent, they sometimes lacked representative populations or the added benefit of increased numbers of marginalized ethnic groups, like Hispanics and African Americans (called oversampling, and performed in the nationally representative studies). With this in mind, six large federal studies from 1966 onward satisfied these criteria; also, one earlier study which used Federal funds was included because it paved the way toward researching dropout at a national level and drew attention to the need for special considerations of potentially marginalized ethnic groups. Overall sample sizes of these seven studies had an average of 21,707 students per study, peaking at over 35,000, while dropout numbers trailed behind at 1,718, or 7.3% per study.
All seven studies included reports by students of why dropout had occurred. Also, one study included teacher and administrator perceptions of dropout causes, and thus, elucidated differences in dropout perceptions between school representatives, which several researchers have used as a guide for comparing respondent groups (Dalton, Glennie, Ingels, & Wirt, 2009; McMillen & Kaufman, 1996; McMillen, Kaufman, Hausken, & Bradby, 1993; Obasohan & Kortering, 1999; Spadafore, 2006).
Push, Pull, and Falling Out Factors of Dropout
A framework was developed by two groups of authors to explain reasons why students drop out such that they can be pushed, pulled, or fall out of school (Jordan et al., 1994; Watt & Roessingh, 1994). These accounts can be integrated to explain the overall dropout experience.
Jordan et al. (1994) explained pressures on students of push and pull dropout factors. A student is pushed out when adverse situations within the school environment lead to consequences, ultimately resulting in dropout. These include tests, attendance and discipline policies, and even consequences of poor behavior. However, students can be pulled out when factors inside the student divert them from completing school. These occur when factors, such as financial worries, out-of-school employment, family needs, or even family changes, such as marriage or childbirth, pull students away from school. They can even include illnesses, as these cause students to put a greater value on something outside of school, and therefore they do not complete school.
Watt and Roessingh (1994) added a third factor called falling out of school, which occurs when a student does not show significant academic progress in schoolwork and becomes apathetic or even disillusioned with school completion. It is not necessarily an active decision, but rather a “side-effect of insufficient personal and educational support” (p. 293). Also, more than push or pull factors, falling out factors highlight a process in school dropout whereby the student gradually increases in behaviors or desires of academic disengagement, yet without being forced out by the school (by push factors) or lured out by things they need or want (by pull factors; Finn, 1989; Finn & Pannozzo, 1995). As a result, these students eventually disappear or fall out from the system.
The key difference between push, pull, and falling out factors has to do with agency. With push factors, the school is the agent whereby a student is removed from school as a result of a consequence. With pull factors, the student is the agent, such that attractions or distractions lure them out of school. Finally, with falling out factors, neither the student nor school is the agent. Instead, circumstances exist that neither the school nor the student can remediate, and as a result, the connection students have with school gradually diminishes. Although there seems to be a similarity between pull and falling out factors in terms of both involving an action of the students, the definitive difference is that pull factors have a distinct object working as an attraction/distraction that is sought by students, leading to dropout, whereas falling out factors lack this attraction/distraction.
With this background in mind, the results from several dropout studies used dichotomous (yes/no) responses by students and Likert-type scale responses by teachers/administrators. Thus, students were given easier tasks of identifying dropout factors, whereas teachers and administrators were asked to rate the severity of these factors. Two studies were previously reported according to student’s ethnicity and were similarly reported herein, whereas the remaining studies only reference dropout causes according to gender. In what follows, each study is displayed with relation to the presence of push, pull, and falling out factors.
The Studies
The Explorations in Equality of Opportunity Study (EEO:55)
The first nationally representative study to address reasons for high school dropout was the EEO study of 1955. It was a private study of 35,472 high school sophomores and seniors conducted by Educational Testing Services from a National Science Foundation grant (Eckland, 1972; Griffin & Alexander, 1978). It included 35,472 high school sophomores and the dropout causes they had reported. In 1970, a total of 2,077 original students were contacted through a cluster sampling that dealt with work-related issues, including former schooling experiences. Overall, 220 dropouts (10.5%) responded and provided information on the reasons related to the dropout experience. Table 1 shows the 15 ranked dropout causes, according to gender.
Explorations in Equality of Opportunity (1955) Ranked Reasons for Dropout by Student Dropouts.

Source. Eckland (1972, p. 487); Dropout Indicator 47.
From this study, pull factors, such as Got married or Had to work, played the most significant role in dropout, at a rate of 60.0%, with females leading in this area due to a high rate of the antecedent, Became pregnant. Also, women reported marriage as a dropout antecedent at a much higher rate than men, which suggests that marital responsibilities and childbearing had a stronger impact on dropout for young mothers. Moreover, the falling out factor, Didn’t like school, played a less significant role, at 26.4%, but was ranked much higher for men than for women. Second, male responses in 11 out of 15 areas were much higher than female responses, which may have reflected the male-centered culture of the 1950s in these areas or the male orientation of some questions. Also, men had significantly higher ratings of two dropout causes that were male-focused: Wanting to go to work (25.9%) and Enlisting in the Armed Forces (14.5%). Conversely, women expressed much higher rates in the two areas that were female-focused, Got married (58.7%) and Became pregnant (18.2%), and also reported that neither delinquency nor participation in the military led to dropout. Overall, males reported push factors at a rate more than double than that of females, at 29.1% as compared with 13.9%. Third, there were similarities in survey questions, such as Wasn’t doing well in my studies, and I failed or was failing in my studies, which could only be understood in terms of the former referring to difficulties the student had in school and the latter to consequences that resulted.
Although this was an early study, it provided insights into the social and cultural experiences from this bygone era. The differences between males and females established a precedence for comparing various populations in future studies.
The National Longitudinal Survey of Young Women and Young Men (NLSY:66)
The next study was by the BLS and was officially called The National Longitudinal Survey of Labor Market Experiences for each subgroup for young men or for young women. The “original cohorts” study was performed in 1966 on a pool of 5,159 young women and 5,225 young men between 14 and 21 years of age. Table 2 depicts the ranked dropout causes in this study, according to gender.
National Longitudinal Study of Young Women and Young Men (1966) Ranked Reasons for Dropout by Student Dropouts.
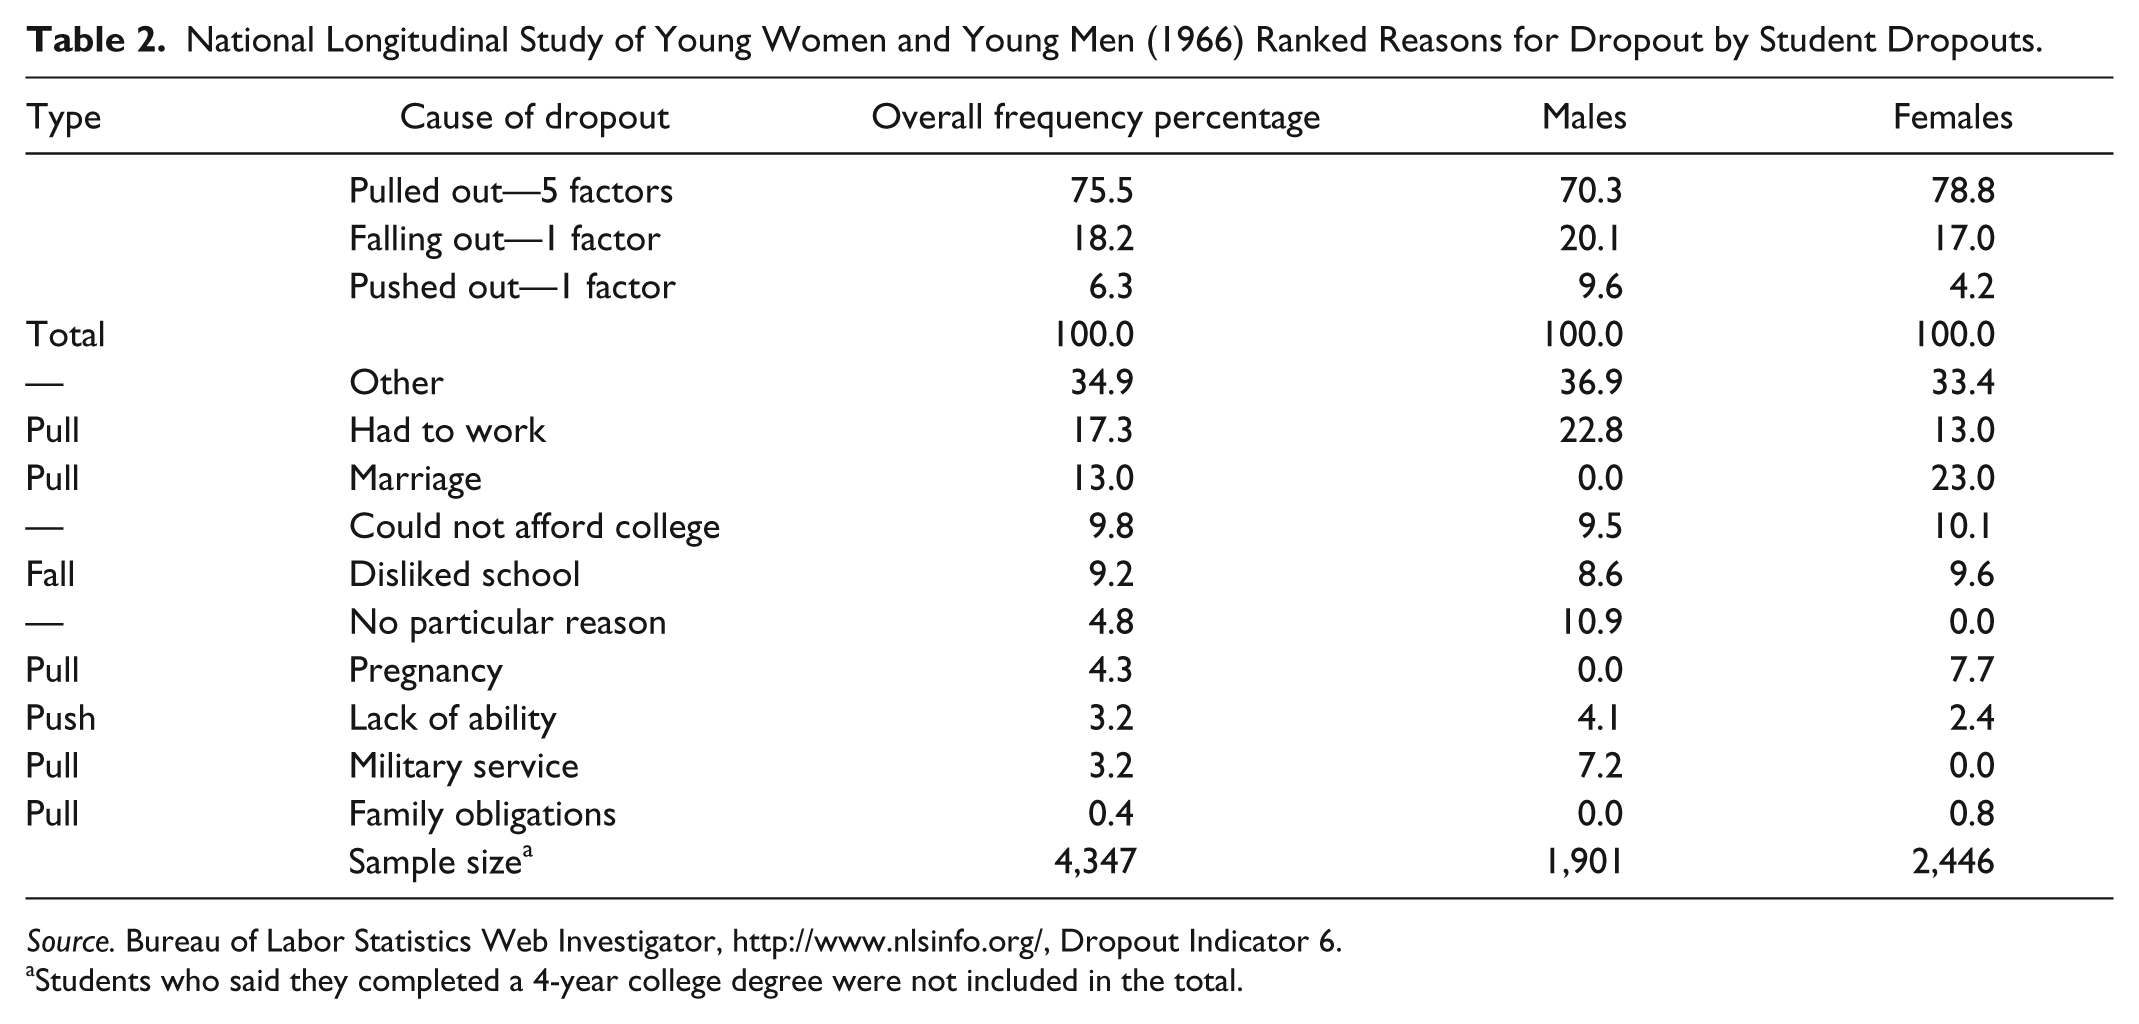
Source. Bureau of Labor Statistics Web Investigator, http://www.nlsinfo.org/, Dropout Indicator 6.
Students who said they completed a 4-year college degree were not included in the total.
As a fully government–sponsored longitudinal study of a nationally representative cohort, NLSY:66 made a first ever attempt to insure that minority ethnicities were sufficiently represented. To that end, African Americans were polled at a rate of double the census population rate to insure an adequate representation of students of this ethnicity (BLS, 2005a, 2005b). Overall, the racial breakdown of respondents included 7,372 Whites (71.0%), 2,897 Blacks (29.9%), and 115 Others (1.1%), which could have been improved by breaking down the category “Others” further.
From this study, pull factors were reported to play the strongest role in dropout at 75.5%, with females leading in this area. Partly explaining this, the instrument itself assessed several pull factors and only one each of push and falling out factors, which led to a higher overall ranking for the category. Second, the item, Had to work, was reported at significantly lower ranks for women, at 13.0% as compared with 22.8% for men. However, this was a common gender difference in other nationally representative studies as well. Third, because differing instruments were used for men and women, gender comparisons could not be made for all dropout factors. For example, the choices, No particular reason and Military service, were offered to men but not women. Similarly, the item, Pregnancy was offered only to women. Finally, the highest ranking factor in this study was Other, which suggests that respondents did not feel that the nine dropout causes offered could accurately account for their dropout experience. Interestingly, this is a known limitation of early dropout studies and suggests that more factors should be queried (Cunningham, 2007; Glennie & Stearns, 2002).
The National Longitudinal Study of the High School Class of 1972 (NLS:72)
The next and possibly most well-known nationally representative study in the United States was the NLS:72. This was an annual study of 17,726 high school seniors starting at age 18 and continuing for 14 years and was termed the grandmother of the longitudinal studies because it offered what the National Center for Educational Statistics (NCES) called as “probably the richest archive ever assembled on a single generation of Americans” (NCES, 2009, para. 1). Table 3 depicts the ranked dropout causes in this study, according to gender.
National Longitudinal Study of the High School Class of 1972 Ranked Reasons for Things That Interfered With Education for Students Who Dropped Out, According to Gender.

Source. U.S. Department of Education, National Center for Education Statistics, National Longitudinal Study of the High School Class of 1972–Base Year Survey, 1972, unpublished data, Dropout Indicator 17.
From this study, falling out factors were reported most frequently by all students at 48.8%, with females leading in this area. Second, fall and push factors occupied the first seven causes, while pull factors revealed lower frequencies, and some antecedents, such as pregnancy and marriage, were not even polled. Third, the instrumentation showed a more robust understanding of dropout problems than earlier studies in its use of new antecedents. For example, the student’s adjustment to school routines was considered, as well as problems with transportation. Also, teacher quality was broken into two dropout causes: one for poor teaching and the other for the teacher not actively helping the students. Such understandings underscore the reason why this study is seen as significant by NCES.
The National Longitudinal Survey of Youth Labor Market Experience (1979)
Next, the National Longitudinal Survey of Youth Labor Market Experience took place in 1979, and was the first study to receive extensive dropout scholarship (Powers & Wojtkiewicz, 2003; Rumberger, 1982, 1983). It included 12,686 students aged 14 to 21 years, with annual follow-ups to determine who dropped out and why this occurred. NLSY:79 reflected improvements since NLSY:66 by having more elaborate response choices for student ethnicity, more potential dropout causes, and by using the same dropout indicators on all gender and ethnic groups. Also, follow-ups were much more regular, with participants still being surveyed today. Table 4 depicts 13 ranked dropout causes and causal groups, organized according to gender and ethnicity.
National Longitudinal Survey of Youth Labor Market Experience (1979) Ranked Reasons for Dropout by Student Dropouts by Rumberger.

Source. Rumberger (1982, p. 459; 1983, p. 210); bold categories provided in original, Dropout Indicator R00171.00.
Aggregate numbers for ethnicity and gender were not available.
Totals for antecedents were only available to the nearest unit. Bold rows vertically sum to 100%.
From this study, dropout causes that were associated with pull factors, such as Employment and [Became] Pregnant, ranked highest, led by Hispanic students. Also, students reported that the falling out factor, Disliked school, played the most significant role in dropout. In addition, ethnic groups were considerably polarized on many issues. For example, White students reported high rates of disliking school, while African American students cited high rates of expulsions or suspensions leading to dropout. Also, Hispanic students reported the highest ranks of pull factors, with females reporting a rate of 72% (mostly from [Became] Pregnant and Got married) and males, 53.2% (from Work and Home responsibilities), which suggests that English Language Learners (many of whom are Hispanics) often dropped out due to pull factors.
Over time, the percentage of falling out factor students reported increased considerably from the initial Educational Testing Service (ETS) study of 1955 to be nearly double in 1979. Also, improvements were made during this time in the number and variation of dropout antecedents used. Still, the main emphasis of findings from three out of four studies until NLSY:79 was that dropouts primarily had left school because of pull out factors.
The High School and Beyond Study: 1980 (HSB:80)
As time progressed, longitudinal studies continued to grow in stature, and so did the research that resulted from them. The HBS:80 involved two cohorts of 35,723 sophomores and 34,981 seniors, as well as 2,289 dropouts. It aimed to pick up where the NLS:72 study left off because the former study had only considered a senior class cohort. Table 5 shows the analysis of 16 dropout causes provided by Peng (1983), according to gender.
High School and Beyond Study (1980) Ranked Reasons for Sophomore Dropout in 1980 by Student Dropouts by Peng.

Source. Peng (1983, p. 5); bold categories provided in original, Dropout Indicator 12.
Detail may not sum to totals due to rounding.
From this study, women reported higher rates of pull out factors, such as marriage, at 30.7% compared with men at 6.9%. Also, men were also more likely than women to report the need to financially take care of family members. Conversely, deviant behavior by males including suspensions, expulsions, and not getting along with teachers played a more significant role in dropout. In addition, though pull factors were reported at the highest rates by females, the opposite was true for males who primarily had reported push factors including poor grades. These gender differences occurred in subsequent studies and have been duly noted by dropout researchers (Cairns, Cairns, & Neckerman, 1989; Ensminger, Lamkin, & Jacobson, 1996).
The National Educational Longitudinal Study: 1988 (NELS:88)
By far, the national longitudinal study that offered the most comprehensive analysis of dropout causes and received well-diversified scholarship was the NELS:88. Conducted on a representative panel of 24,599 eighth graders, the NELS:88 study lasted 12 years and collected many kinds of information related to dropout, which previous studies had not looked into, including administrator perceptions of dropout and comparisons of dropout at different grade levels. Table 6 depicts dropout causes by early dropout that were assessed when participants were sophomores in high school.
National Education Longitudinal Study (1988) Ranked Reasons for 8th- to 10th-Grade Dropout in 1990 by Student Dropouts.
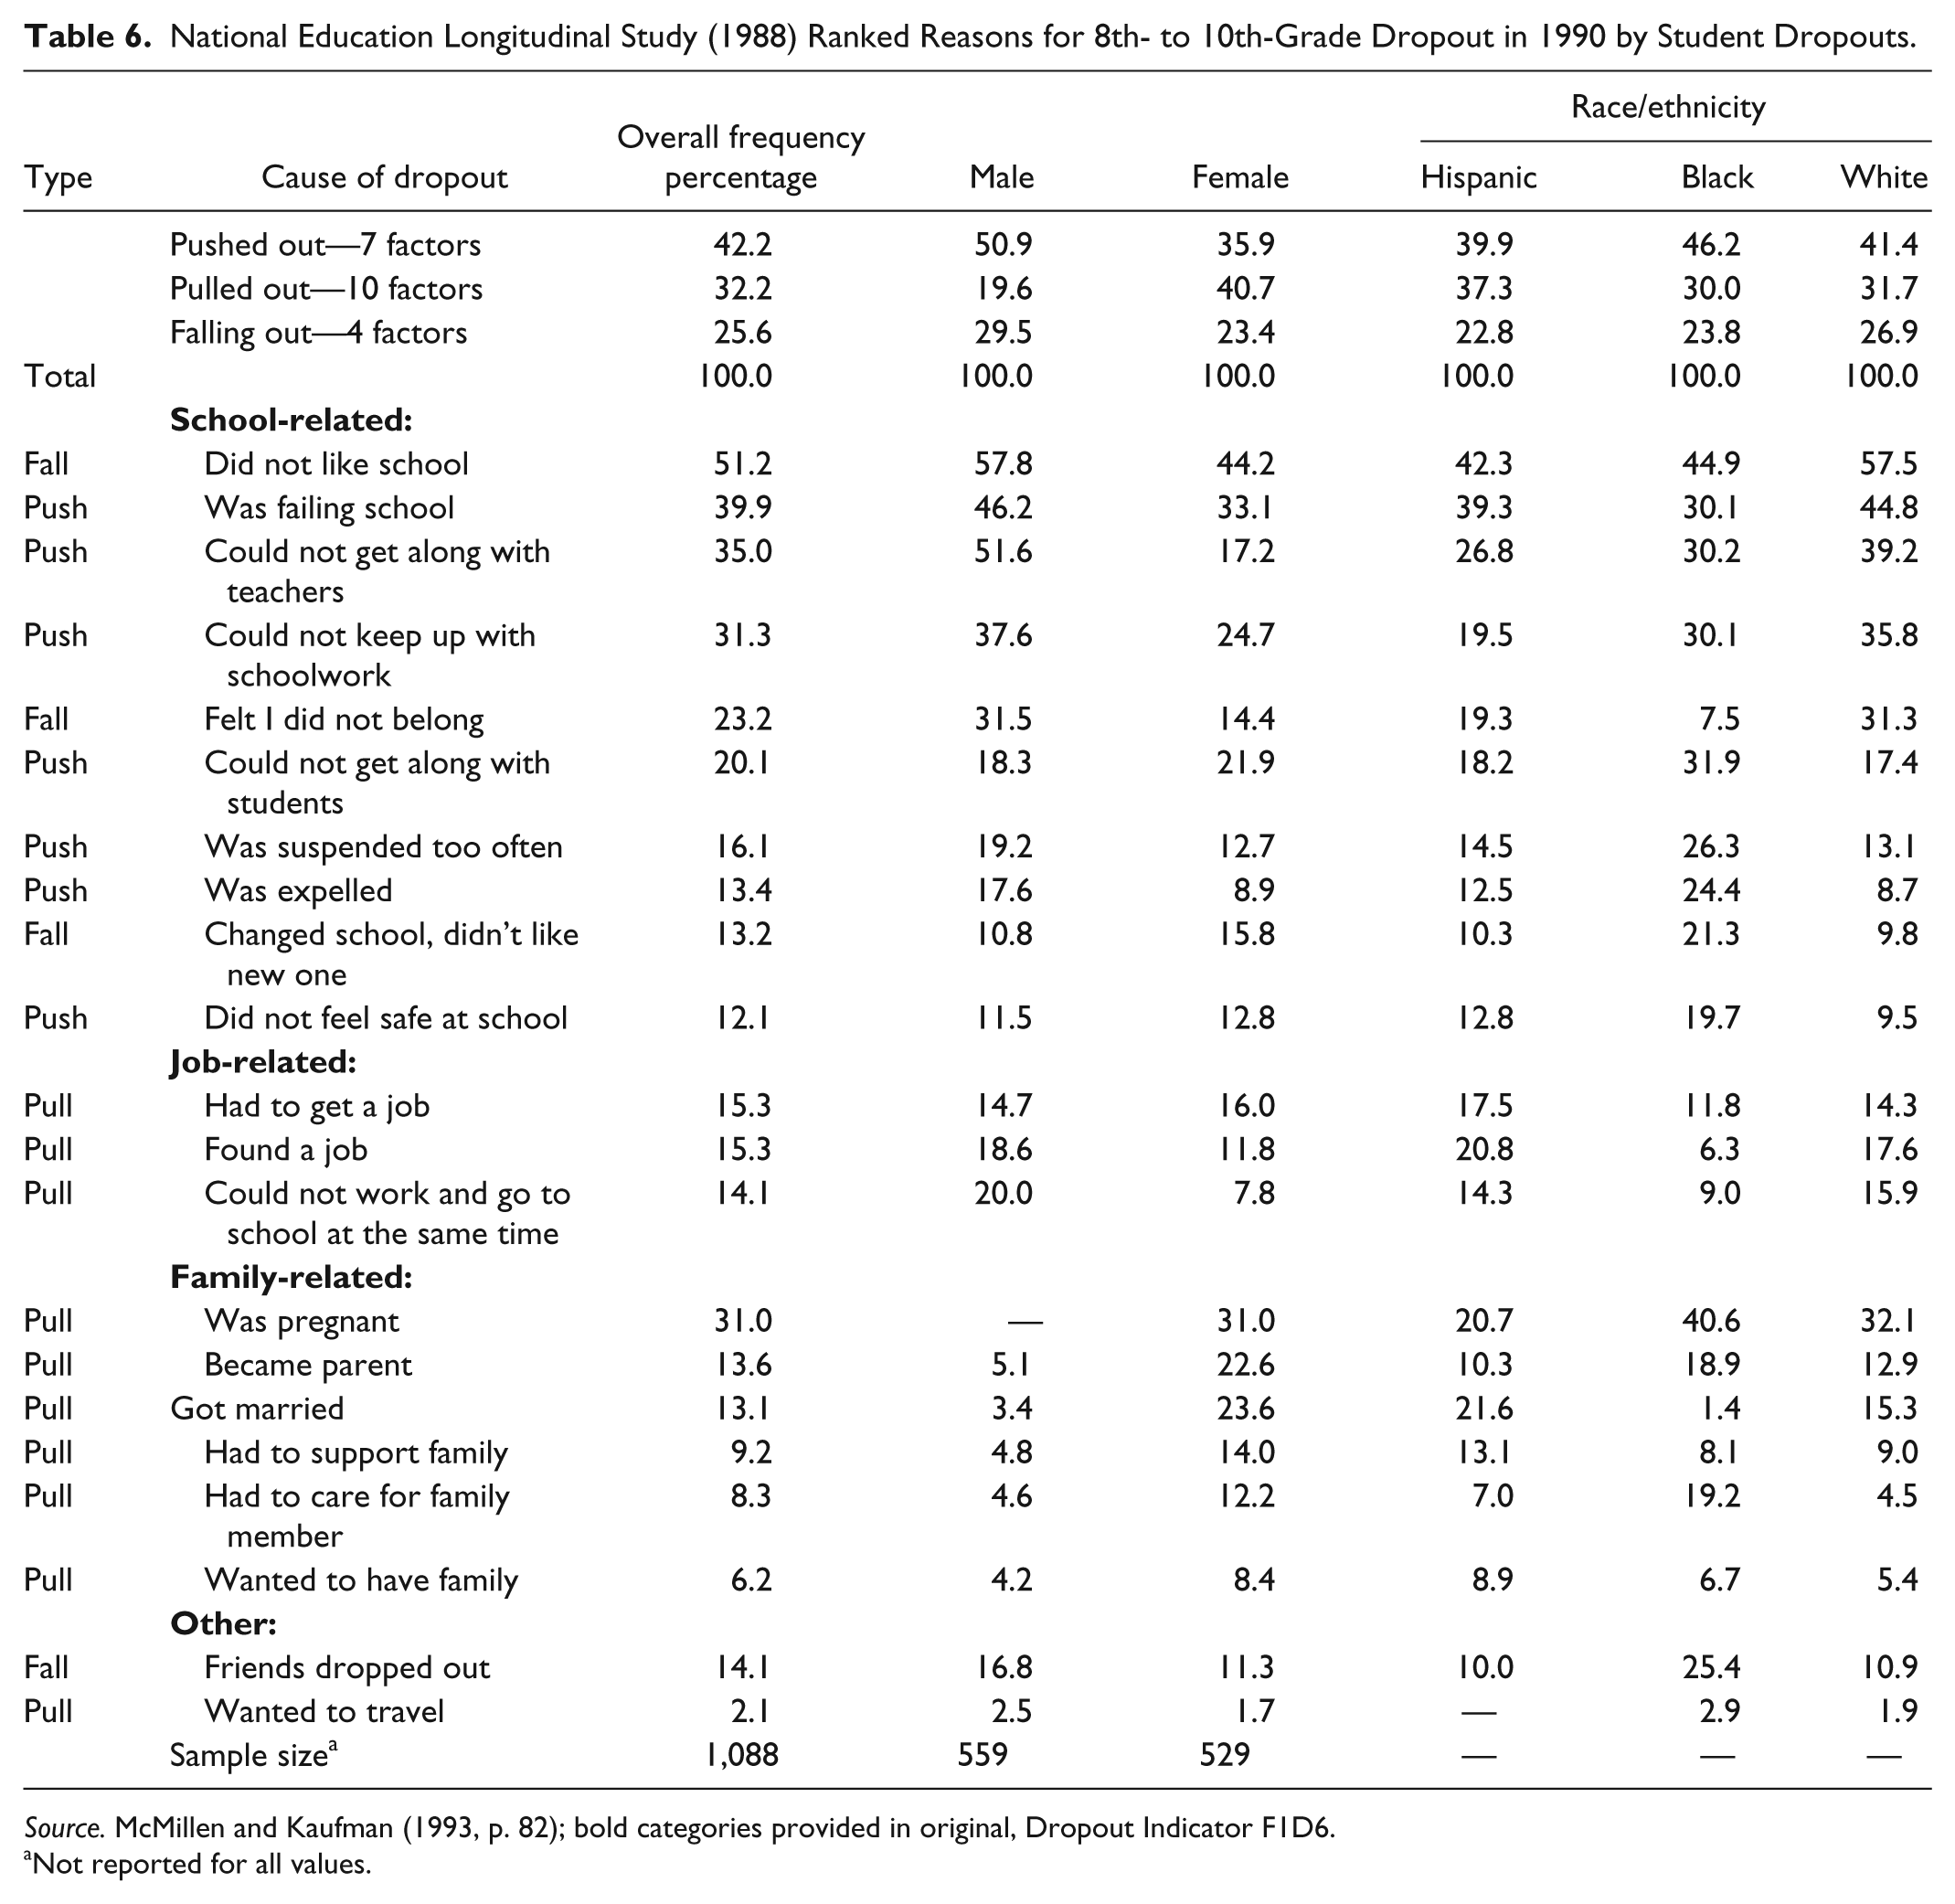
Source. McMillen and Kaufman (1993, p. 82); bold categories provided in original, Dropout Indicator F1D6.
Not reported for all values.
From the study of early dropouts, students reported that push factors were primarily related to early dropout, though this was not always the case regarding gender. Males reported that push factors, such as Was failing school or Could not keep up with schoolwork, played the most significant role in early dropout, as well as that they Did not like school. Females, however, reported that pull factors, especially related to family and parenting, frequently led them to dropout early on. In addition, while females reported pull factors had played the most significant role in dropout, males reported that these factors played the least significant role.
NELS:88 also queried the participants when they were seniors to ascertain reasons students dropped out later in high school. One anticipated benefit of this second dropout study was to be able to compare early and late dropouts. Discussion of changes in dropout causes over time has included a book chapter by Scott, Rock, Pollack, and Ingels (1995) on demographic issues and more extensive discussions by Jordan, Lara, and McPartland (1996), Konstantopoulos (2006), McMillen et al. (1993), and Rotermund (2007), and comparisons with HSB:80 and ELS:2002 (Dalton et al., 2009). Table 7 depicts reported causes of late dropout according to gender and ethnicity.
National Education Longitudinal Study (1988) Ranked Reasons for Dropout in 1992, From 10th to 12th Grade by Student Dropouts.

Source. McMillen and Kaufman (1993, p. 36); bold categories provided in original, Dropout Indicator F2D9.
Not reported for all values.
From the study of late dropouts, students reported that pull factors were primarily related to early dropout, though this was not always true regarding gender and ethnicity. To this end, females reported that pull factors, especially related to family and parenting, frequently led to them to dropout early on. However, males reported that push factors, such as Was failing school or Could not keep up with schoolwork, played the most significant role in early dropout. African American students also reported that push factors relating to suspensions, expulsions, and not getting along with students or teachers often led to dropout.
From both of these studies, the highest ranked dropout causes reported by early dropouts were school-related reasons, while late dropouts reported a mixture of both job and family-related reasons. This helped explain why early dropouts cited higher rates of push factors, while late dropouts, especially females, cited more pull factors. One additional reason was that teenage employment for young teens can be in smaller jobs like lawn mowing and babysitting while more higher paying jobs come later in high school and could thus be a more significant pull factor for older students. This difference can also be understood as lower achieving students being pushed out in ninth grade creating the ninth-grade bulge (McNeal, 1997). Then, as the remaining students with better grades progress through high school, they succumb to other desires, such as family pressures and employment, and in the end they do not graduate from high school because these desires were stronger than that of finishing school. Also, falling out factors of dropout showed a slight shift from the early to late years such that early dropouts were much more likely to fall out due to reasons, such as moving to a new school, not liking school, and experiencing friends drop out, while late dropouts cited the lack of belonging at a higher rate.
In addition, some interesting differences took place with regard to gender and ethnicity. For example, it was much more common for male dropouts to be pushed out throughout high school, which was often attributed to a notable disliking for school or poor performance. Conversely, females reported that pull factors played the most significant role during high school. In the early years, this was due to family reasons, such as pregnancy, marriage and caring for family members, while in later years, employment reasons ranked highest. Thus, while many dropouts had reported push factors in early years, female students also attributed dropout to marriage and family. Regarding ethnicity, Hispanics were more likely than others throughout high school to report pull factors, and also that they did not feel safe at school. This suggests the strong forces of jobs, family, and possibly even language issues made school completion insurmountable for Hispanic students, which has been previously noted (Jordan et al., 1996; McMillen et al., 1993, Rumberger, 1983, 1987). Also, African Americans reported push factors at higher rates than other ethnicities during all of high school, which was interesting because it was self-reported information rather than a perception about them. This underscores that African American dropout may indeed be battling against structural systems pushing them out of schools in addition to the behaviors associated with dropouts. Last, White students reported falling out factors, such as not liking school and not feeling that they belonged, at high rates throughout high school.
In addition to surveying students who dropped out, NELS:88 also queried administrators and teachers in public schools on their perceptions of dropout causes and other school problems. Regarding dropout causes, administrators were queried alone on their perceptions of potential dropout causes; these rankings occurred in the first and second NELS follow-ups (1990, 1992), with perceptions of both early and late dropout being provided. Table 8 depicts the ranking of 15 dropout causes, as reported by administrators.
National Education Longitudinal Study (1988) Ranked Reasons for Dropout in 1990 and 1992 According to Administrators Perceptions.

Source. NCES (1999): First follow-up (1990, pp. 1424-1428); Second follow-up (1992, pp. 1547-1552); Dropout Indicators F1C97 and F2C58.
Note. NCES = National Center for Educational Statistics.
Illegal drug use and Alcohol problems were combined into one reason in the second follow-up (1992).
From this study, administrators perceived that students dropped out for entirely different reasons than students had reported, as described previously. Administrators reported that pull out factors ranked highest for early dropouts, whereas falling out factors ranked highest for late dropouts. Second, the antecedent, Family problems, was ranked highest by administrators for early dropouts along with Lack of parental support whereas Poor academic performance and Student disinterest in learning ranked highest for late dropouts, with the students’ dislike for learning showing the largest growth over time. This suggests that during the high school years, students at risk of dropout were perceived early on to perform poorly and ultimately lose interest in school, which is an essential argument of disengagement theory (Finn, 1998; Finn & Fish, 2007). Also, late dropouts reported that Low student expectations for payoff to education played a significant role in dropout, which confirmed that as students got closer to the dropout stage, the hope of completing school diminished. Third, Family problems were seen as a strong influence on dropouts during both time periods, which highlighted the impact of these focal needs throughout high school. Finally, some antecedents were worded differently in both surveys, such as two antecedents for alcohol or drug abuse being combined into one antecedent in the second follow-up, which ultimately reduced consistency between comparisons.
Last, NELS:88 surveyed administrators, teachers, and students regarding school problems perceived as serious. Though this area of contrast did not directly involve dropout, it was still important because many of the school problems are closely connected with the occurrence of dropout. Also, sample sizes for these groups were quite large, which added strength to comparisons that were made. Table 9 shows the ranking of 11 school problems that were perceived as serious. As a note, pull, push, and falling out factors were not listed for these school problems because all of them were generally related to push factors.
National Education Longitudinal Study (1988) Ranked School Problems in 1988 According to Administrators, Teacher, and Student Perceptions.

Source. NCES (1999): Students (pp. 71-74), Teachers (pp. 1879-1883), and Administrators (pp. 1163-1166), Dropout Indicators BYS58, BYT3_26, and BYSC49.
Note. NCES = National Center for Educational Statistics.
From this comparison study, the overall ranking of responses varied widely between groups, with administrators reporting the lowest ranking perceptions for all areas and students reporting highest ranking ones. This suggests that administrators may not have been as seriously affected by school problems or even that they were not as forthright in identifying problems as other respondents because such admissions could adversely affect administrators’ positions. Second, a distinct vantage point for each group was clearly reflected in responses. As such, administrators expressed a large concern for absenteeism and tardiness, which is most related to their job duty in monitoring schools. However, teachers expressed a heightened alarm at Student verbal abuse of teachers as well as a similar regard for Student physical abuse of teachers, which are views where they may have had firsthand experience. Finally, students reported high rates of dropout causes that reflected immutable consequences (fighting, vandalism, drug and alcohol abuse, and skipping classes) and expressed lesser concern for issues that may have had less severe penalties or less social appeal (verbal and physical abuse of teachers and weapons usage, absenteeism). In this way, it seemed intuitive that each respondent type reported views of school problems that were in their best interests either politically, or with their peers. Thus, administrators and teachers felt that absenteeism/tardiness were severe problems whereas students perceived them as minor in relation to other more daunting school problems. This suggests that the vantage points of students and school personnel (both administrators and teachers) can account for how they perceive problems in schools, which mirrored the results of Obasohan and Kortering (1999).
The Educational Longitudinal Study: 2002 (ELS:2002)
The final nationally representative study conducted by NCES and for which reported dropout causes were available was the ELS:2002. It was conducted on a representative panel of 15,362 sophomore students, as well as 13,488 parents, 7,135 teachers, 743 principals, and 718 librarians. Although ELS:2002 is the most recent study, it has ambitious plans to complement previous ones and assist researchers and policymakers with new analyses and conclusions that build upon aims of all of the principal NCES nationally representative studies (NLS:72, HSB:80, and NELS:88). The timeline for ELS:2002 includes biennial follow-ups and extends to 2013. Table 10 shows Dalton et al.’s (2009) ranking of 21 dropout causes, according to gender.
Education Longitudinal Study (2002) Ranked Reasons for Dropout in 2006 by Student Dropouts.

Source. Dalton, Glennie, Ingels, and Wirt (2009, p. 22); Dropout Indicator 29.
Detail may not sum to totals due to rounding.
From this study, the scope of surveyed dropout choices increased because previous studies reflect more areas of student’s educational experience. In addition, there was a special emphasis on new push factors that reflected higher expectations over students and of schools, such as Could not keep up with schoolwork, Thought could not complete course requirements, and Thought would fail competency test. To this end, students reported that dropout resulted mainly because of school-related reasons. Second, push factors including Missed too many school days and Was getting poor grades/failing school ranked highest among all dropout causes and is consistent with the ABCs (Attendance, Behavior, and Course Performance) of dropout, using the early warning systems methodology (Balfanz & Fox, 2011). With that in mind, ELS:2002 was the only dropout study where push factors ranked highest for both genders, and suggests the culmination of a gradual change in the way students perceive dropout. Moreover, it may signal an end to the powerful influence of pull factors among students, school representatives, and study designers. As ELS:2002 is still being conducted, some students currently listed as dropouts may finish General Educational Development (GED) work and later become graduates. In turn, this may sway overall reports of dropout by remaining school dropouts either providing strength to the growing trend of push factors, or negating this trend altogether.
Summary of Nationally Representative Studies
Table 11 depicts a summary of the push, pull, and falling out factors that came from dropout causes as described by the seven selected nationally representative studies. These studies were EEO:55, NLSY:66, NLS:72, NLSY:79, HSB:80, NELS:88, and ELS:2002. The factors observed at the highest rates in each study are listed in bold whereas the overall number of push, pull, and falling out factors cited is in parentheses.
Summary of Push, Pull, Falling Out Factors in Selected Longitudinal Studies.

Note. The strongest category for each study has bold text.
In cases where a special population/respondent type is not listed, only student dropouts were considered.
Discussion
Overall, the message from many early studies from the 1950s to the 1980s was that students predominantly reported dropout factors related to being pulled away from schools. This occurred in each student-focused study, with the exception of NLS:72, which did not survey students on potent pull factors like Pregnancy and Getting married. The marked trend of highly ranked pull factors continued through the HBS:80. By that time, however, the prevalence in the reporting of pull factors (as well as the overriding number of pull factors queried) began to wane. In the NELS:88, many 8th- to 10th-grade students reported dropout factors related to being pushed out of school, whereas 10th to 12th graders still reported pull out factors. Also, administrators reported high rates of pull out factors for students between the 8th- and 10th-grade years and that falling out factors played the most significant role in dropout between the 10th- and 12th-grade years, which suggests that jobs and family have a stronger influence early on in school, whereas apathy and disengagement from school settles in during later high school years. This also underscores that school personnel had an entirely different view of dropout than students, which confirmed previous scholarship (Obasohan & Kortering, 1999; Secada et al., 1998; Spadafore, 2006).
Since HSB:80, the reported influence of dropout factors has shifted toward push factors, primarily through querying new push factors as well as by substantial increases in Could not get along with teachers and Could not get along with students. Not only did the emphasis in research shift toward a greater focus on in-school problem behaviors that push students out, but also dropouts have been less affable toward teachers and their peers. Perhaps a climate of such high expectations has led more dropouts to the point of exasperation and in turn to quit school. Although this trend was been observed in only two studies, NELS:88 and ELS:2002, researchers can look forward to the 2013-2014 findings of the upcoming first follow-up data collection in the High School Longitudinal Study (HLS:2010) on this regard.
Overall Insights About Push, Pull, and Falling Out Factors Relating to Gender
Across all the studies except NLS:72, male students reported the highest rates of push factors, which most often occurred in perceptions of poor academic performance and disciplinary problems leading to dropout. Conversely, female students reported the highest rates of pull factors in all but two studies (NLS:71 and ELS:2002), which highlights the out-of-school factors that may attract or distract them from completing school. These key differences between males and females point at areas where dropout interventions could be differentiated for each gender to offer the most help possible.
Since the earliest study in 1955, there has been an increasing prevalence of push factors being reported. As a result, both males and females in the most recent study, ELS:2002, reported the strongest incidence of push factors at 48.7%, with similar peaks also occurring during the NELS:88 study. Two possible explanations exist for the increasing ranks of push factors by both genders. First, the bar for students has been lifted higher in recent times beginning with the standards movement in education with the seminal NCES publication, A Nation at Risk, and culminating in the No Child Left Behind Act legislation of 2001 (National Commission on Excellence in Education, 1983; U.S. Department of Education, 2006, 2008). Although both movements aimed to define key areas where U.S. education can improve, it should be emphasized that push factors were seen at their highest rates immediately after NCLB came into existence. Second, since the first dropout study in 1955, gradual increases in school completion have occurred over time and reflect a growing societal expectation for completing secondary school and even pursuing college work (Dorn, 1993, 2003). The result is that pull factors like jobs and family, which historically played the most significant role in dropout, have shifted over time from being a primary lure for dropouts to being a dual focus in student’s lives while they still work toward school completion.
Conclusion
This article has attempted to discern the reasons that students have dropped out of high school over the past half a century, with perceptions by both students and administrators. Overall, there is credence for each type of dropout antecedent, whether being a push, pull, or falling out factor. At the same time, it was apparent that pull factors elicited the highest rates overall for all the studies, while eliciting prominence in four of seven studies. Future scholarship can build upon the awareness of each of these nationally representative studies, and further elucidate reasons as to why each antecedent occurred.
Finally, a significant closing note as well as implication for this manuscript is the direction of future practice. During Fall 2009, NCES launched its most recent nationally representative, longitudinal survey, the High School Longitudinal Study (2009). Although this study has promising elements and targets 25,700 high school freshmen with triennial instruments, it is at the cusp of the ninth-grade year. It is hoped that their research will not lose any of the initial students chosen for the study, yet at the same time those eighth graders who do not continue to their freshmen year may already be lost. The motivation for finding all the students who dropout out remains, to fully understand the dropout problem for students of all ethnicities and language groups, and with this knowledge, thereby learn how to combat and conquer the problem.
Footnotes
Declaration of Conflicting Interests
The author(s) declared no potential conflicts of interest with respect to the research, authorship, and/or publication of this article.
Funding
The author(s) received no financial support for the research and/or authorship of this article.