
Abstract
The research was a partial replication of Devah Pager’s study of the effect of a criminal record on employment opportunities in the Milwaukee, Wisconsin labor market. A quantitative and qualitative method was utilized to examine the effects of a criminal record, race, and the relationship between employers’ willingness to hire ex-offenders and their actual hiring of ex-offenders. An experimental audit was conducted by two testers (one Black male and one White male) to audit 30 employers. The results supported Pager’s findings. There was a dramatic negative effect for the Black male tester. Three themes emerged from the testers’ diaries and debriefings: (a) the application process was influenced in the favor of the White male by a “gatekeeper,” (b) racism was evident, and (c) an emotional effect was noted on both testers. Finally, during a telephone survey of the same employers, they indicated a willingness to hire both ex-offenders regardless of their race, yet the audit revealed the opposite.
Literature Review
A high incarceration rate of African American males has resulted in a high unemployment for African American ex-offenders. Harrison and Karberg (2004) of the U.S. Bureau of Justice Statistics examined the United States prisons and jails population at midyear 2003. The United States ended the decade of the 1990s with more people behind bars than any other decade in the nation’s history. From 1970 to 2001, the increase in the number of people in our jails and prisons unparalleled any other in our nation’s history. Harrison and Karberg (2004) reported that in 1970 our jails and prisons held 338,029 persons and by midyear 2004 that number was 2,131,180 inmates in state or federal prisons and local jails. It was also reported that African Americans comprised 47% of the United States jail and prison populations, yet only 13% of the nation’s population.
Carson and Sabol (2012) of the Bureau of Justice Statistics submitted an analysis of the corrections population in a report called “Prisoners in 2011.” Their analysis revealed that the state and federal prison populations had declined from 1,613,803 to 1,598,780 inmates. This was the second year in a row that the prison population had declined. According to Carson and Sabol, their analysis also revealed that during the same period African American and Hispanic males and females were incarcerated at a higher rate than Whites in all age groups.
The problem was discussed in a special report from the Bureau of Justice Statistics titled “Prevalence of Imprisonment in the United States Population, 1974–2001” (Bonczar, 2003). Bonczar reported that at the end of 2001, more than 5.6 million Americans had served time in prison or were currently in prison. The report provided updated estimates of the lifetime chances of going to prison using standard demographic life table techniques that projected the likelihood of incarceration for someone born in 2001. The prevalence report revealed that if the rates of first incarceration remained the same, 6.6% of all persons born in the United States in 2001 will go to State or Federal prison during their lifetime. More specifically, Bonczar claimed that based on his calculation of the prevalence of imprisonment in the United States, roughly 1 in 3 Black males born in the United States in 2001 are expected to go to prison in their lifetime compared to 1 in 17 White males.
Cox (2010) examined crime, incarceration, and employment in the context of economic choice theory. Cox reported that the current rate of incarceration will result in 11% of all males being incarcerated in their lifetime. Cox further reported that the lifetime rate for African Americans is a dramatic 18.6%.
Alexander (2012) reported the incarceration of African Americans as the new era of Jim Crow. Alexander explained how the disparity in incarceration has led to a new racial caste system. Alexander argues that the racial control of African Americans is conducted through the criminal justice system. According to Alexander, the “War on Drugs” has led to close to one-half of young African American men being incarcerated in our jails and prisons or labeled felons for life. Also, the felony disenfranchisement laws deny them the right to vote and serve on juries, and legally discriminated against in employment, education, and housing.
The literature has examined the effects of a criminal history on employment and future earnings (Allgood, Mustard, & Warren, 2003; Cox, 2010; Holzer, Raphael & Stoll, 2003; Pager, 2003; Pager & Quillian, 2005; Raphael, 2004; Stevans, 2009; Western & Beckett, 1999). For instance, Holzer, Raphael, and Stoll (2003) argued that arrests and imprisonments are associated with lower employment and earnings, suggesting that lower employment and earnings for ex-offenders were about 10% to 30% lower than for comparable individuals with no criminal record. In his study of employers’ demand for ex-offenders in Los Angeles, it was reported that 80% of employers’ surveyed indicated they would not hire or accept an application from an ex-offender. Employers’ willingness to hire ex-offenders is limited, therefore attributing to the higher rate of recidivism among individuals with a criminal history. The proposed research will further examine the effect of a criminal record on employment opportunities with regard to differences between Black and White male subjects.
Background of the Study
Devah Pager’s (2003) and Pager and Quillian’s (2005) research used field experiments to study discrimination against minorities and ex-offenders in the low-wage labor market. Holzer (2003) examined an employer’s reported willingness to hire an ex-offender and their actual hiring of ex-offenders. The subjects in Holzer’s research were 619 employers in Los Angeles. A 20-minute telephone survey was used to collect the data. The main variable in the research included indicators that reflect an employers’ reported willingness to hire ex-offenders and their actual hiring practices. More than 40% of the employers suggested they would “probably not” or “definitely not” be willing to hire someone with a criminal record. Thirty-five percent of the respondents indicated that their response would depend on the crime.
A major policy concern of Holzer’s (2003) research was employers’ reluctance to hire ex-offenders. Research has shown the notable praise we hear about the progress made in racial equality is not consistent with actual experiences of testers (Pager, 2003; Pager & Quillian, 2005). Pager (2003) and Pager & Quillian (2005) identified similar findings as they studied the effects of a criminal record on job searches by ex-convicts in Milwaukee and New York City. Pager used an experimental audit design and a survey to compare employers’ reported willingness to hire ex-offenders and their actual hiring practices. The studies conducted in Milwaukee and the New York City job markets used matched pairs of testers to apply for entry-level positions. Moreover, the effect of race in the findings was significant. Only 14% of Blacks with a criminal record received call backs compared with 34% of White non-criminals (p < .01). Also, Whites with criminal records received more favorable treatment than Blacks without criminal records (14%).
Pager (2003) and Pager and Quillian (2005) examined if the employers’ willingness to hire matched their actual hiring practices. Employers were surveyed after the testers had applied for entry-level positions.
During this second phase of Pagers’ study, the same employers were given an opportunity to respond to a telephone survey on their hiring process (Pager, 2003; Pager & Quillian, 2005). Pager (2003) reported that in 50% of the cases, employers were unwilling to consider equally qualified applicants on the basis of their criminal record.
Pager and Quillian (2005) found employers that were administered the survey indicated a greater willingness to hire ex-offenders than was evident during the audit. Responses obtained in the survey reports did not accurately reflect the actual behavior of an employer (Pager, 2003; Pager & Quillian 2005).
Statement of the Problem
The door is locked against a prisoner and he goes to live in a hidden world. If you were to enter that world you should be startled by what you see. In the United States today we have 2.1 million people behind bars. . . . Forty percent of the prisoners nationwide are African Americans. . . . Out of sight out of mind is not acceptable for any part of our justice system. (Supreme Court Justice Anthony Kennedy, 2003, pp. 1-4)
Mauer (1995) examined the status of African Americans males within the criminal justice system. He reported that one in three Black men between the ages of 20 and 29 were under some form of criminal justice control in 1995.
Mauer (2013) reported that the rate of incarceration of African American males declined by 9.8%. A decade of mass incarceration of African Americans has declined from the overall rate of incarceration. According to Mauer, the ratio of Black/Hispanic to White is 6.4:1. It can be concluded that the decline in the United States prison population had a marginal effect on the rate of African Americans incarcerated compared with Whites.
Other studies reported similar, disturbing findings of African Americans being under control of the criminal justice system. For instance, Beck and Mumola (1999) argued that a Black male born in 1991 stood a 29% chance of being imprisoned at some point in his life, compared with 4% for a White male. They argued, similar to others, that African Americans comprised 13% of the nation’s population, yet were imprisoned at 6.6 times the rate of Whites. In November 2012, Glaze and Parks (2011) of the Bureau of Justice statistics reported that 6.98 million offenders were under the control of the criminal justice system.
Method
Research Site
The research site was Milwaukee, Wisconsin. The timeline for collecting and analyzing the data from the three samples was from the first week of May 2007 to September 2007. The 2005 census American Community Survey indicated that Milwaukee was 44.7% White and 40.2% African American and that the Milwaukee African American population had become the city’s largest ethnic group.
The 2010 United States Census (Census) reported that the city of Milwaukee was 39.2% African American, 3.5% Asian, 17.3% Hispanic, and 37% White. The Census reported that the city of Milwaukee experienced a .4% population decrease since 2000.
Description of Sample: Experimental Audit Sites and Participants
The job sites underwent two randomizations. The first came from the initial random selection from the Milwaukee Journal Sentinel and JobNet. The second randomization placed them into the Criminal Record (CR) and No Criminal Record (NCR) categories. This allowed each tester the opportunity to frequent the same number of job sites. Plus, each tester visited the same job site and both applied based on whether the employer is randomized as CR or NCR. This allowed for both the Black and White tester to visit the same job site under the same experimental conditions (CR or NCR).
The goal was an equal number of trials for each tester. The testers applied for 30 entry-level job openings. Fifteen were CR and fifteen were NCR job sites. The dependent variable is the number of call backs from the employer after receiving the application. Also, an interview or a job offer is counted as a positive contact. An average of 10 audits (5 CR and 5 NCR) occurred a week. The rest of the week the testers called the researcher by telephone to schedule their start.
Each tester received individual training on how to respond to questions about a CR or NCR. The assigned criminal history of both testers was the same. The assigned criminal history was a conviction for possession of cocaine. Each tester used a script to recite or write if they were questioned about or had to give an explanation of their criminal record. The Black male tester wrote or stated the following:
I was stopped by the police for a traffic violation. I ran a red light. I was patted down after the traffic stop and the officer found a small amount of cocaine in my pocket. I went to court and pled guilty. The Judge told me that I had too good of a record and education to be doing something so foolish. He informed me that he was giving me six months in the House of Correction to teach me a lesson.
The White male tester received the following script if asked or required to give an explanation of his criminal history:
I was at a party at a friend’s apartment. The party got loud and the police was called. I was patted down by an officer and a small amount of cocaine was found in my pocket. I was arrested and went to court where I pled guilty. The judge informed me that he was going to teach me a lesson to keep me from making a similar mistake in the future. He sentenced me to 6 months at the House of Correction.
The Audit Process
The audit consisted of the testers reporting to one of the randomly selected employers on their assigned list. If the job site is a CR job site, the testers indicated on the application, if required, an arrest for possession of cocaine. If required, the testers included in the application the script regarding the circumstances of the arrest and the disposition. The testers did the same for any interview. If the audit site is designated an NCR job site, the testers completed the application and indicated, if required, no arrest or conviction history.
Each tester had a separate voice mail box to use on the employment application. A call back to the voice mail box by an employer was counted as a positive response. Also, if the tester was interviewed or offered a job on-site this was considered a positive response.
Approach of the Study
The purpose of the study was to investigate the effects of a criminal history and race on the willingness to hire ex-offenders. Pager (2003) suggested the use of the survey as a measuring tool of employment discrimination may not yield an accurate reflection of employers’ hiring process. Pager argued that the employers surveyed may answer with the “political correct” response about their hiring process, which may conflict with actual practices. The current study will compare the employers expressing a willingness to hire ex-offenders and their actual hiring of ex-offenders.
The following research questions guided the study:
The current study focused on the efforts of Black and White ex-offenders to obtain employment in the city of Milwaukee. The study used an experimental model to assess the effects of a criminal record on employment. In addition, it examined the use of a survey as a measurement tool for discrimination.
The research consisted of three phases (an experimental audit, a diary, and a telephone survey). The first phase involved an experimental audit that included one Black and one White male tester who applied for real entry-level jobs. The testers were assigned to randomly selected employers assigned a Criminal Record and No Criminal Record. Moreover, in the second phase, the testers maintained a diary of their experiences during the application process that was analyzed using the constant comparative method (Creswell, 1998).
The third phase was a telephone survey administered to the same employers that were audited. The survey provided employers an opportunity to reveal their hiring processes. A comparison was made of the employers’ hiring practices (experimental audit) and their expression of a willingness to hire ex-offenders (survey).
Veenman (2010) examined research methods that studied labor market discrimination that used statistical analyses, behavioral research, ethnographic observations, and attitude research. Veenman suggested that no one method was superior to the other, and found strength and limitations of each method. Based on these findings, Veenman argued that examinations of labor market discrimination should employ multiple methods to support the reliability of the results. For example, Veenman suggested using a combination of statistical analyses of observational data and paired testing to study the prevalence of discrimination and its impact on the labor market.
Experimental audits of employers hiring practices simulate that part of the process in the real world. The audits allowed for an examination of practices as they occur in the labor market, as testers pose as applicants for real positions. A test for discriminatory or illegal practices in housing discrimination was conducted by the United States Department of Housing and Urban Development (HUD; Turner & Ross, 2003). Turner and Ross maintain testers were matched based on similar characteristics such as race, age, physical appearance, and self-presentation. They were assigned similar characteristics of education and work experience to apply for rental units.
Both visited a real estate or rental agent, made the same requests, and provided the same personal information. Each tester systematically and carefully recorded the information and assistance he or she received from the agent. If the minority and White testers were treated differently in important ways, the test provides direct and powerful evidence of differences in the kinds of treatment that can be expected when they search for housing. The current research used a similar model to examine employment hiring practices in Milwaukee.
Research Rationale—Experimental Audit
Bertrand and Mullainathan (2003) concurred with Pager (2003; Pager & Quillian, 2005) about surveys. They suggested that surveys do not contain all the characteristics that employers observe when hiring, promoting, or setting wages. Bertrand and Mullainathan maintained that audit studies provided some of the “cleanest” non-laboratory evidence of labor market discrimination.
According to Riach and Rich (2002), this use of testing has been used for many years, and it is a valuable investigative technique. Testing has been described as a process of presenting individuals with equal qualifications and similar personal traits to the same employer (Bussey & Travina, 2003). The significant difference in the individuals was often race or gender.
Research Rationale—Diary
In the current experimental audit, each tester maintained a diary of his interaction with the employer. The testers recorded their interactions with the employer or representative immediately after leaving the premises. They recorded the day, date, time, and location in their diary. They also recorded their conversations with the employer or representative at each site, as well as a physical description of each. Furthermore, they recorded the approximate age, build, hair color, and other characteristics to assist in identifying the individuals.
Constant comparative analysis was used to obtain data relevant to the testers’ interaction with the employers. Each tester diary entry described the overall interaction with comments made by the employer or representative. The diary entries were read four times and the top three prominent similarities or emergent themes were recorded.
Descriptive Data About Site: Telephone Survey
The third data sample was collected through the use of a telephone survey administered to the same employers that were audited. Data analysis of the telephone survey resulted in descriptive statistics. The results were compared to the information obtained from the other two phases, thereby increasing the validity of the telephone survey.
The current telephone survey is an adjusted version of the one used by Devah Pager (2003). Pager’s (2003) survey was reduced to those variables important to the present research questions.
The telephone survey comprised of 28 multiple-choice questions. It was designed to solicit responses regarding the attitudes of employers about different kinds of applicants for entry-level positions. The survey included questions regarding the employer, the hiring procedures, and the employer’s attitudes about various kinds of applicants. Examples of the questions asked were as follows:
Next, I am going to ask about several types of applicants. Please tell me if you would accept each type for an entry-level position. 8. An applicant who is on welfare? Would you say you definitely will accept, probably will accept, probably will not accept, or absolutely will not accept? Don’t know–no opinion, Refused/no answer. 10. An applicant who had a criminal record? Would you say you definitely will accept, probably will accept, probably will not accept, or absolutely will not accept? Don’t know–no opinion, Refused/no answer.
The telephone survey was administered by a business communication specialist who has many years of experience conducting telephone interviews. The calls to the employers yielded a response rate of 57%.
Data Collection/Analysis—Experimental Audit
This study used an experimental audit to produce data relevant to the research questions. The experimental audit was conducted by Black and White male testers who applied for real entry-level jobs in the city of Milwaukee. The definition for entry-level job opening included those that require no previous experience and no education greater than high school. Also, any position legally exempting an ex-offender was not included. The testers were assigned job sites that had been randomly selected as a criminal record or no criminal record employer to examine the responses.
The variable measured was the number of call backs from the employer after receiving the application. The appropriateness of the methodology for the research was in its ability to compare the experiences of testers and real ex-offenders seeking employment. It also allowed for the examination of the effect of race on employment opportunities. Yinger (1986) described fair housing audits as a means of catching individuals in the act of discrimination. Yinger maintained the use of testers was an opportunity to measure discrimination while at the same time observing it in a natural setting.
Andersson, Jakobsson, and Kotsadam (2012) used a corresponding test for ethnic and gender discrimination in housing in Norway. Andersson et al.’s design used faked letters in response to apartments listed for rent in Norway. The correspondence letters signaled to the reader the ethnicity, gender, and socioeconomic class. Andersson et al.argued the use of tests allowed for the examination and measurement of discrimination parameters that would be impossible to evaluate.
Others have used audits or correspondence testing to examine discrimination. Johnson and Lahey (2011) used matched pairs of resumes to examine hiring of older women in entry-level positions. Johnson and Lahey compared the use of audit studies to having a natural field experiment. Furthermore, they compared it to humans in the real-world where you are given the opportunity to examine the responses to characteristics of race, gender, or age.
Paluck (2010) expressed a similar description of the real-world richness of audit studies. Paluck agreed with Veenman (2010) that the combination of the qualitative method and field experiments presents the opportunity to have measurable data and participant information in a controlled environment.
Neumark (2010) suggested the value of using audit studies in discrimination research. Neumark described audit or correspondence studies as a means of establishing identical characteristics in an application process except for race, gender, or ethnicity. A review of the literature shows how others use audit or correspondence studies to examine discrimination in the labor market, health care, housing, and education in the United States and internationally (Andersson et al., 2012; Kaas & Manger, 2012; McGinnity & Lunn, 2011; Nunley, Owens, & Howard, 2011; Paluck, 2010; Stepanikova, 2012; Veenman, 2010).
For the current experimental sample, separate voice mail telephone accounts were established for each tester to use on the employment application. This was used for the employer to call back the tester regarding the employment opportunity. The call backs are the dependent variables. Analysis of the data from the call backs was based on the number of responses by criminal record and non-criminal record. In addition, an analysis was done on the responses based on the race of the tester. The data were analyzed using descriptive statistics. This consisted of averages and percentages.
Pager (2003) used inferential statistics to analyze the call backs received from the testers based on the race and criminal history of the tester. The current research analyzed the call backs similar to Pager considering whether there was a hiring preference based on race or criminal history. Also, the sample of 30 employers and two testers are too small to have confidence in the statistical significance of the comparison. The study relied on descriptive ability of the results as opposed to inferential power.
Statistics
The statistically significant difference is based on a sample size of 30 employers and two testers. The sample size is decreased even more when the 30 employers are divided into 15 CR and 15 NCR job sites. Therefore, the test for statistical significance is only being used to support the descriptive statistics.
We calculate for the null hypothesis and the alternate hypothesis:
Test statistics:
where
p1: proportion of White Male Tester
p2: proportion of Black Male Tester
n1 = 15 and n2 = 15.
r1 = Proportion of White Male Tester × n1
r2 = Proportion of Black Male Tester × n2
These values are used to determine the Z. The Z calculations lead to the calculation of the P value.

The alternative hypothesis is two-tailed, P value = 2 × P (z < 0.30) and the level of significance is specified as α = 0.05.
Again, the test of statistical significance is used for descriptive purposes. The sample size of 30 employers divided evenly between two testers is a limitation in the current research.
Research Results
The three most common job titles were Waitstaff (23%), customer service representative (20%), and delivery driver (20%). These job titles represented 63% of the sample. Auto parts person, custodian, and lot attendant–auto made 21% of the other job titles. This is followed by cashier, clerk/shipping, laborer, auto lube, and warehouse accounting for 15% of the job titles.
Findings Related to Research Questions 1 and 2: Experimental Audit
The experimental audit findings addressed the research questions about the effects of a criminal record and race on employment opportunities in the city of Milwaukee for each of the Testers.
The Effect of Race on Call Backs for the Testers
The current research (Figure 1) revealed the White male tester received 47% of his call backs when he applied for employment with NCR compared with 40% when applying for employment with a CR. The results show there was little difference in the effect of a CR on the White tester for receiving call backs. The CR did not reduce the likelihood of a call back for the White male tester. There was a statistically significant difference (p < .05; significance level was set at the .05 level) between the call backs for the Black and White testers.
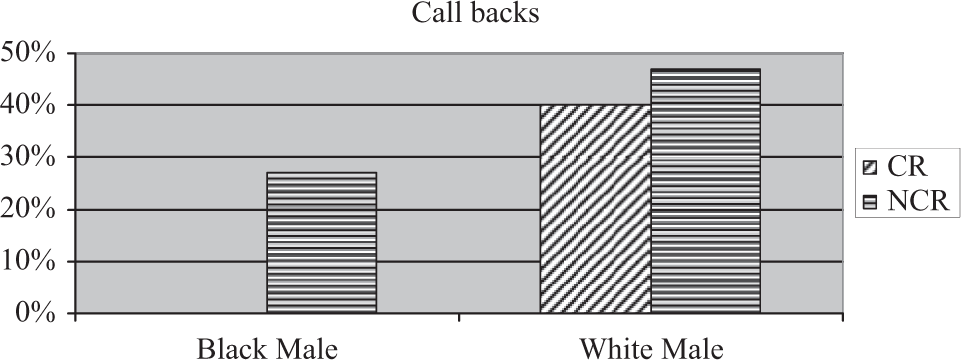
Percent of call backs from the CR and NCR job sites.
The race of the testers is examined to determine if differences occurred for Black tester when compared with the White tester. The effect of race can be observed in Figure 2. It can be observed the Black tester with NCR received 27% of the call backs compared with 47% for the White testers. It can also be observed the White tester with a CR received 40% of the call backs while the Black tester with a CR record received no call backs. The results suggest that a Black male without a criminal record is less likely to receive a call back compared with a White male with a criminal record. Also, a Black male with a CR will receive fewer call backs than a White male with a CR.

Percent of call backs for Black and White male testers.
A statistically significant difference (p < .05) exists between employment opportunities based on CR in the White and Black tester. But, there is no statistically significant difference between a non-criminal record on employment opportunities in the White and Black testers.
After testing for the effect of a CR for the White tester, it is concluded that there is no significant effect (p > .05) of a CR for the White tester. But a test of significant effect of CR for Black tester indicated there is a significant effect for the Black tester. Moreover, the comparisons were made from a sample of 30 employers.
There are limitations regarding the statistically significance difference in all the findings attributed to the sample size. Therefore, the test for statistical significance is only being used to support the descriptive statistics.
Personal Contact: Interviews
The design of the current audit study allowed for direct comparisons of personal contact by race. This is permissible because the Black and White tester visited the same employers with the same characteristics except race. Figure 3 represents the percent of call backs associated with personal contact. Personal contact is described as the employer interviewing the tester or offering a job on the spot. Furthermore, it could be extra dialogue with the tester and a subsequent call back to the tester. It could also be dialogue or action that favored one tester over the other. The only personal contacts recorded in Figure 3 are those involving an interview.
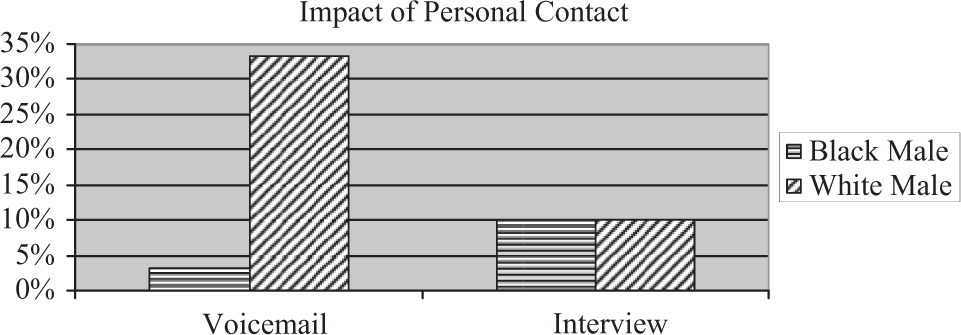
Personal contact by voicemail box and interview.
Figure 3 reflects the frequency of the impact of personal contact (interview). Personal interviews resulted in 20% of the call backs for both the Black and White tester. Both testers received 10% of their responses from interviews. It is important to note the Black tester received the majority of his responses during personal contact (10%) compared with 3.3% call backs from voicemail. Voice mail box communications accounted for 36.6% of the call backs for both the Black and White tester.
Findings Related to Research Question: Telephone Survey
The final research question addressed employer expressed willingness to hire and their actual hiring practices. Data analysis of the telephone survey resulted in descriptive statistics. The first series of questions addressed background on the company regarding its product or service and number of employees. The next group of questions in Figure 4 addressed the employer’s application process. A component of Pager’s (2001) survey contained a vignette of hypothetical applicants followed by a series of questions designed to examine the employers’ willingness to hire specific workers. It is important to note that the analysis of the responses from the telephone survey was based on a sample size of 57%.
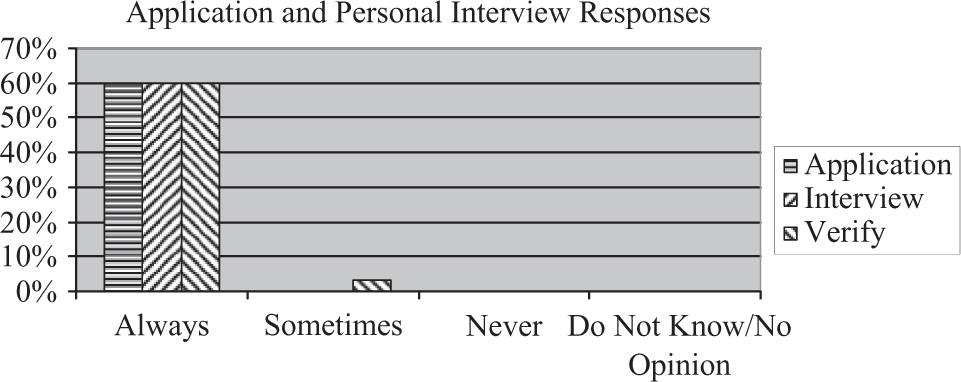
Use written applications, conduct personal interviews, and verify references.
Figure 4 indicates that 60% of the employers during the telephone survey responded they always use a written application. It also shows the same percentage of employers (60%) who use a written application also conduct a personal interview and verify references.
The next series of questions address the employers’ attitudes toward disadvantaged or stigmatized applicants. Disadvantaged or stigmatized worker is defined as welfare recipients, applicants with a GED but no high school diploma, applicants with spotty work history, applicants who have been unemployed for a year or more, and ex-offenders (Holzer, 2003).
Figure 5 represents the responses to the telephone survey questions regarding attitude toward hiring disadvantaged workers. Figure 5 indicates that no employer responded with an unwillingness to hire a disadvantaged worker. Every respondent showed they “probably will” or “definitely will” hire a disadvantage worker. The degree of commitment to hire a disadvantage worker varied among the respondents.
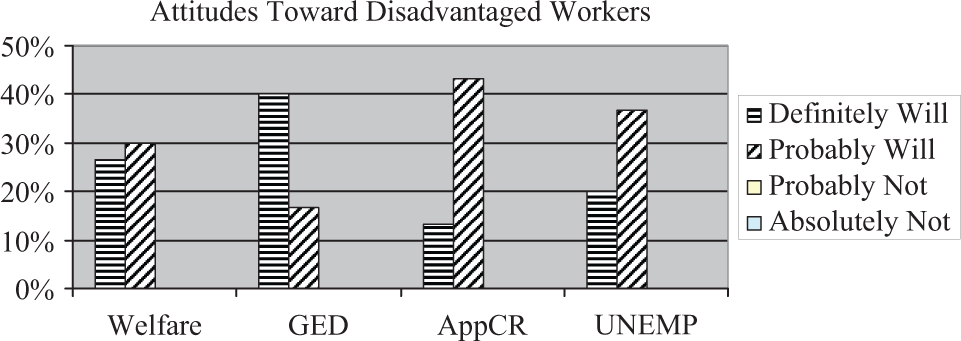
Responses to hiring disadvantaged workers.
More respondents (43.3%) indicated they “probably will” hire applicant with a criminal record (AppCR) than “definitely will.” The highest responses for having a positive attitude toward a disadvantaged worker is GED (40%) followed by Welfare (26.6%) and an applicant unemployed (UNEMP; 20%) for a year or more. Even though AppCR is the lowest response for “definitely will,” it is the highest response of 43.3% for “probably will.”
The next series of questions asked about the employers’ application process when hiring employees into entry-level positions that do not require a college degree. The employers were asked during the telephone survey, “Over the past year, how often have you required new hires for entry-level positions to take a drug test?” The majority of the respondents (53.3%) indicated that they required a drug test. Another 3.3% indicated the drug test were required sometimes.
The next series of questions inquired into the employers’ application process when hiring into entry-level positions and whether the applicant has a criminal history. The employer is asked, “Over the past year, to your knowledge, did the application form you used include a question about the applicant’s criminal background (that is, did you ask them about any prior convictions they may have had)?” The results showed that 46.7% of the respondents indicated that their application solicited information about the criminal history of the applicants. Only 10% of the employers indicated that they did not solicit information regarding the applicants’ criminal history.
The telephone survey asked, “When do you usually do the criminal background check?” The results illustrated that 50% of the employers indicated they conduct a background check “after applicant is interviewed, before hire.” No employer indicated they do the background check before the applicant is interviewed.
The next question solicited the employers’ frequency of hiring an individual with a criminal record within the past year. The employer is asked, “Approximately, how many men with criminal records has your business hired in the past year?” The employers’ response indicated that 30% of the employers hired 1 to 5 applicants with a CR within the past year. Another 3.3% of the employers indicated that they hired 11 to 15 applicants with a CR within the past year.
The next series of questions were from hypothetical applicants for an entry-level position. The employer was read the below directions and description of a hypothetical applicant. The last group of questions was based on a profile that is constructed to emphasize specific work and crime-related characteristics. In one reading, the applicant is described as a Black male named Chad. In the other reading, he was described as a White male called Chad.
The following statement and series of questions were read to the employer (Pager, 2001):
Now I’m going to describe some hypothetical applicants for an entry-level opening you are trying to fill. Please indicate the likelihood that you would hire the applicant in each case. Chad is a 23-year-old Black male. He finished high school and has had steady work experience in entry-level jobs. He has good references and interacts well with people. About a year ago, Chad was convicted of a drug felony and served 12 months in prison. Chad was released last month and now is looking for a job.
The telephone survey participants were read the above vignette and then asked, “How likely would you be to hire Chad for an entry-level opening in your company?” The same vignette was read with Chad being a White male. The only thing that changed in the vignette was race of Chad.
The frequency distribution for hiring an applicant with a drug felony is illustrated in Table 1. BMDF represent the vignette with Chad being a Black male with a drug felony. WMDF represent the vignette with Chad being a White male with a drug felony. BMDF is 6.7% “very likely” to hire and this is the same for WMDF (6.7%). Only 6.7% of the respondents indicated they were “very likely” to hire a Black male or White male with a drug felony. The respondents indicated (“somewhat likely) a preference to hiring a WMDF (10%) over a BMDF (6.7%).
Findings Related to Telephone Survey Regarding Employers Willingness to Hire Applicants With a Criminal History.

Note. BMDF = Black Male Drug Felony; WMDF = White Male Drug Felony; BMPC = Black Male Property Crime; WMPC = White Male Property Crime; BMVC = Black Male Violent Crime; WMVC = White Male Violent Crime; BMDT = Black Male Drug Treatment; WMDT = White Male Drug Treatment. Criminal History includes applicants from a drug treatment program were unlikely to hire a Black Chad (BMDF) with a drug felony.
The respondents indicated that a total of 13.3% of “somewhat unlikely” and “very unlikely” were unlikely to hire the White Chad (WMDF) with a drug felony. This is compared with a combined total of 23.3% of “somewhat unlikely” and “very unlikely” who indicated they were unlikely to hire a Black Chad (BMDF) with a drug felony.
The frequency of the responses to whether the employer will hire an applicant who committed a property crime is in Table 1. The respondents were asked, “Instead of a drug crime, what if Chad had been in prison for a property crime such as burglary?” The frequencies indicate the employers responded very similar to hiring both the Black Chad and White Chad with a record of a property crime. BMPC represents the vignette with Chad as a Black male who committed the property crime instead of the drug crime. WMPC represents the vignette with Chad as a White male who committed the property crime instead of the drug crime. The frequency indicates a combined total of “very likely” to “somewhat likely” of 13.3% for BMPC and 16.3% for WMPC to hire for a property crime. Only 3% separate BMPC and WMPC. Yet, 20% of the employers reported they were “somewhat unlikely” to “very unlikely” to hire either the Black male or White male who committed a property crime.
Table 1 reflects the employers’ responses to hiring the hypothetical Chad who is convicted of a violent crime. The employers indicated that Chad the Black male convicted of a violent crime (BMVC) is not “very likely” to be hired in an entry-level position. No respondent indicates they were likely to hire Chad who is a BMVC. However, 10% of the employers stated they were likely to hire the Chad who is a White male convicted of a violent crime (WMVC).
Table 1 indicates that 10% of the respondent were “somewhat likely” to hire BMVC. Plus, more employers (16.7%) were “very unlikely” to hire WMVC compared with 13.3% for BMVC. But, if you compared the two negative responses of “very unlikely” to “somewhat unlikely,” the result is about the same (16.7%).
Table 1 illustrates the employers responded similarly to hiring hypothetical Chad whether he is a White male who received drug treatment (WMDT) or a Black male who received drug treatment (BMDT). The employers indicated they were “somewhat likely” (26.7%) to hire either Chad who had completed drug treatment.
The same vignette is read to the employers with Chad as a White male and Chad as a Black male who instead of being released from prison last month, Chad had gotten out of prison 6 months ago and had been working at a car wash since his release. Table 2 illustrates the frequency of the employers’ responses. Twenty percent of the employers indicated they were “very likely” to hire White Chad (WMEXP) and 16.7% of the respondents indicated they were likely to hire Black Chad (BMEXP). It should be noted that 30% of the respondents indicated they “somewhat likely” hire WMEXP compared to 33.3% of the respondents indicating they “somewhat likely” hire BMEXP. There is no statistically significant difference (p > .05) between proportions of WMEXP and BMEXP for combined effect of “somewhat likely” to hire with work experience.
Hire Applicant With Job Experience.

Note. BMEXP = Black Male Experience; WMEXP = White Male Experience.
The use of the vignette during the telephone survey gave the employers an opportunity to state their willingness or unwillingness to hire a Black or White male under different hypothetical circumstances. What can be concluded from the responses is a willingness of the employers to treat both applicants the same. Their responses indicated that there is an unwillingness to hire either the Black or White male for criminal behavior. The level of unwillingness increases based on the seriousness of the offense. But, there is little difference in their willingness on the basis of race.
Again, there are limitations associated with the statistically significance difference in the findings. There were 30 employers involved in the study. The telephone survey did not include all of the employers because some did not want to participate in the survey. Therefore, the sample size is too small for any meaningful test of significance.
Comparison of the Results From the Audit, Diaries, and Telephone Survey
The current study examined the relationship between findings from the audit study, diary entries, and telephone survey. The data came from the same employers who participated in the audit and the telephone survey.
The audit revealed that the criminal record for the White male tester had little effect on his call backs. The White male tester received 40% of his call backs when applying for employment with a criminal record. The audit also revealed that the White tester received 47% of his call backs when he applied for employment with no criminal record. However, the effect of a criminal record is substantially different for the Black male tester. The audit revealed that the Black male tester received no call backs when applying for employment with a criminal record. He received 27% of the call backs when he applied for employment with no criminal record.
These findings were supported by the specific entries into the diaries of the testers (Wells, 2013). This data reflected that the employers and their representatives favored the White male tester who received more interviews from personal contact. For instance, it became apparent that the gatekeepers were favoring the White tester. The Black tester was denied applications while data supported that the White tester received an application from the same person. There was also evidence in behavior notations to support that this was intentional on the part of the employee (Wells, 2013).
A telephone survey was used to identify those who indicated a willingness to hire ex-offenders with a drug conviction during the telephone survey and compared their verbal responses to their actual behavior in the audit. The results revealed 73% of the criminal record job site employers participated in the telephone survey. The analysis revealed 36% of the criminal record job site employers participating in the survey indicated a willingness to hire an applicant with a criminal record and a drug conviction regardless of race. Also, 55% of the same respondents reported an unwillingness to hire an applicant of either race if they were convicted of a drug offense. The results indicated that the willingness to hire or not was influenced by race.
Discussion
Devah Pager (2003) and Pager and Quillian (2005) reported that a White male with a criminal record received more call backs than a Black male with no criminal record. The current study supported the findings of Pager. This study examined the effects of a criminal record and race on employment opportunities in the city of Milwaukee. Another aspect was the investigation of employers’ willingness to hire disadvantaged applicants. The related research questions were as follows:
The following will be a discussion of each of the above research questions.
Effects of a Criminal Record and Race
Questions regarding a criminal record and race were examined by conducting an experimental audit. Two testers, one Black male and one White male, went to the same job site seeking employment. They presented themselves with the same qualifications at each job site. Job sites were divided through randomization evenly as a Criminal Record or No Criminal Record job site. The only major difference in the two testers is race.
The effect of race in these findings is strikingly large. The Black tester without a criminal record received only 27% call backs relative to 47% of White tester. In fact, the White tester with a criminal record received more favorable treatment (40%) than the Black tester without a criminal record (27%). It is obvious that the results indicate race favor the White male tester. Race continues to play a dominant role in shaping employment opportunities, it is equal to or greater than the impact of a criminal record. The major finding is there is little difference in the effects of a criminal record on the White tester for receiving call backs.
The results indicate that when compared with their White counterparts, Blacks are considered for employment little less than half as much. Also, Black males without a criminal record will do considerably worse than White males with prior criminal convictions. The compelling effects of race thus continue to direct employment decisions in ways that contribute to persisting racial inequality. When the effects of race and criminal record are combined, the problem grows more intense. Not only are Black male more likely to be incarcerated than Whites; according to these findings, they may also be more strongly affected by the impact of a criminal record. The results were blatant and shocking that when all else is held equal but race, the employers preferred the White tester.
Emotional Effect
An unexpected consequence of the audit study was the negative emotional effect of the process on the Black male tester. Both testers recorded their experiences with the application process. The Black male tester recorded instances of being screened prior to receiving an application, treated rude, and told positions were filled when they were not (Wells, 2013). This emotional effect was documented in the Black tester diaries and debriefings.
The effect is consistent with the description of race-related stress described by Pieterse and Carter (2007). They argued that Black Men have a higher incidence of discrimination than Black Women. Pieterse and Carter suggest that race related-stress is a by-product of discrimination and should be included in mental and physical health-related examinations and inquiries.
The debriefings and diary entries of the Black male tester revealed how these experiences had a negative emotional effect on him. The effect was attributed to the constant rejection and negative behavior of the gatekeepers toward the Black tester. The diaries exposed a dark side of the employment application process. It showed employees at the lowest level of the business screening out applicants (Wells, 2013).
Expressed Willingness to Hire Ex-Offenders and Their Actual Hiring of Ex-Offender
A telephone survey was used to examine the employers’ willingness to hire disadvantaged workers. The survey was conducted from the same employers visited by the testers under the experimental audit. The responses indicated all employers were willing to hire a disadvantaged worker. This included applicants with a drug felony.
It is clear from the current research that employers will respond to a survey favorably toward hiring ex-offenders. This is contrary to their actual practice. When faced with hiring an African American with a drug offense on his record, no one called back the Black tester. The current research is consistent with others who question the legitimacy of responses to the sensitive nature of race in a survey (Bertrand & Mullainathan, 2003; Bussey & Travina, 2003; Pager & Quillian, 2005; Yinger, 1986).
The responses in the telephone survey were compared to the findings in the audit. The respondents in the survey indicated a willingness to hire a Black male with a drug felony at a higher frequency than the actual experience. In the audit, the Black male tester received no call backs from the Criminal Record Job sites. Also, the respondents indicated in the survey they were willing to hire both Black and White applicants at the same frequency (6.7%).Yet, in the audit, the White male tester received 40% of his call backs, while the Black male tester received none.
Findings Compared to Related Literature
There is a good body of literature regarding the effects of criminal history, race, and willingness to hire ex-offenders in the labor market. The current research supported the research that argued there was a negative effect on employment opportunities in the labor market for ex-offenders and minorities. Also, the study supports the research that suggested that the survey should not be the only device measuring employment discrimination. The literature will attest to the enormity of the problem of a criminal record, race, and employment.
Measuring Employment Discrimination
Veenman (2010) argued that examinations of labor market discrimination should employ multiple methods to support the reliability of the results. The existing study used an experimental audit, diaries and debriefings, and a telephone survey to investigate the effect of a criminal history and race on employment in the Milwaukee labor market.
The findings reinforced the themes that unemployment among ex-offenders impact the measurement of racial discrimination in employment. Furthermore, multiple means of inquiry are important to discern labor market discrimination. The results are consistent with other researchers who suggest that the use of a survey as a measuring tool of employment discrimination may not yield an accurate reflection of employers’ hiring practices (Pager & Quillian, 2005; Yinger, 1986). It is necessary to use multiple techniques that include experimental audits if we are going to uncover hidden processes and information impacting labor market discrimination. It was evident in the current research that the audit of employers yielded information that is not easily obtained with a survey. The audit results is strong support for the perspective that information obtained from testing is a direct measure of discrimination. Also, the audit allowed for a unique opportunity to examine discrimination first-hand in a real-word setting. This could not be done with a survey. The personal contact between the testers and the employer or representative was captured in a meaningful way through the use of diary recordings (Wells, 2013).
It is important to recognize that employment discrimination remain a problem in the workplace for ex-offenders. The failure to adequately monitor and measure discrimination by employers is a major concern. It was observed in the current research that the actions of the employer representative could lead to legitimate allegations of discrimination. Allowing unqualified employees to question potential applicants regarding their criminal history can lead to a violation of the anti-employment discrimination law (Wells, 2013). The level of these practices extends to human resource managers and owners. It is disturbing that a human resource manager interviewed an applicant on the basis of a recommendation from the receptionist and another because she thought she had a friend who went to school with the applicant’s brother. If these practices are allowed to continue, it will result in fewer African Americans and other minorities in the workplace, the responsibility rests with the employers, management, and regulatory agencies.
Limitations
The research revealed the impact of a criminal record and race on employment and wages of ex-offenders. If a White male with a criminal record has a greater chance of gaining employment than a Black male without a criminal record, this suggests that discrimination in hiring should be a major concern for policy makers. Yet, there are some limitations to the current study. The limitations pertain to the parameters under which a study is conducted as well as the areas the research did not intend to address (Leedy & Ormrod, 2005).
One limitation of the study is the experimental audit model, which has not been frequently used to examine employment discrimination. This model is more commonly used in examining discrimination in housing, insurance redlining, and mortgage brokerage.
Another limitation of the study is the sample. The sample size of 30 employers divided into two equal groups is too small for substantive inferential statistics. This is not reflective of the diverse job market in the study area.
The current research used only two testers, thus limiting the comparison to only two subjects. Also, the research was restricted to Black and White male testers. The current study did not consider the effect a criminal history would have on women and other minority groups.
The testers received training in seeking employment. Yet, once the testers entered into the job site, their actual practices were not observed, thus presenting another limitation. For example, the entries in their diaries represent only one side of the interaction.
The research was restricted to only employers who accepted applications in-person. Many employers require applicants to apply online. Also, many employers use employment agencies or job-services to screen applicants. This eliminated a number of employers from the study. Both processes make it difficult to make generalization regarding employers’ hiring practice.
The limitations in the current research should be adequately examined in future research. The main focus of the current research was on African American males because it was reported that one in three Black men was under some form of criminal justice control in 1995 (Mauer, 1995).
Implications
The current research extends our knowledge of the effect of a criminal history and race in the labor market. It also addresses research that relies on the trustworthiness of survey responses. The findings have implications for practice, research, leadership, learning, and service.
Government Enforcement
Government oversight is grossly missing in the area of employment discrimination based on race and criminal history in the Milwaukee area. The government needs to establish testing procedures for unlawful employment practices similar to those in this study and housing discrimination. If employers do not police themselves, then they must be policed. Testing is a legitimate means of policing employers.
Probation and Parole Agencies
It is a common practice for probation and parole agents to require their clients (ex-offenders) to seek employment. Yet, no system is in place to monitor whether the employer is unlawfully rejecting the client. The agents can sanction the clients for not seeking employment but do not report employers who unlawfully reject their clients. Documentation can result in identifying those employers engaging in a pattern of discrimination. An effort should be made to gather information on those employers not hiring ex-offenders and why. A cooperative effort must be established between the Wisconsin Division of Community Corrections and the state agency responsible for investigating discrimination in employment.
Implications for Research
The current study has implications for further research related to replication and generalization. Both are important for the credibility of research findings. A larger sample is needed to examine the impact of discrimination in urban cities. Furthermore, the larger sample can include an examination of diverse groups of employers. The majority of the employers in the current study are small business owners.
Further research should also include employers who are using online computer applications. This process virtually eliminates “real-life” experiences and personal contact. How are they screening their applicants for elimination? Research should be expanded to include women, Asian, and Latino testers. Replications including these groups can be used to determine if there are similar effects of discrimination based on gender, race, and criminal history.
Generalization
There is a need for the current research to be expanded to other cities. It is important to determine if the responses are unique for Milwaukee. The study can be replicated to further examine “real-life” experiences of applicants. The diary method (Wells, 2013) is an effective model when data are regularly analyzed using the constant comparative method. Testers can be manipulated based on race and gender, and other purposeful factors. Similar findings in other cities shall signal a national problem in discrimination. Moreover, other cities with a different ethnic, racial, and economic make-up may yield different results.
Conclusion
The findings revealed during the experimental audit that a CR and NCR had no effect on the call backs for the White male tester. The Black male tester received no call backs with a CR. The Black male tester with NCR received fewer call backs than the White male with NCR. The telephone survey revealed over 43% of the employers indicated they “probably will” hire an applicant with a CR, but, only 13% indicated they “definitely will” hire an applicant with a CR. The results of the telephone survey pointed out that no employer indicated they were unlikely not to hire a disadvantaged worker. Again, the employers expressed willingness to hire or not to hire was not consistent with their actual practices.
There were events during the audit that could not be captured using merely survey methods. For example, in some cases the Black male tester was denied applications, was subjected to a pre-application screening, and was told positions were filled. Yet, at one job site the Black male tester was praised by an African American manager as being one of the most qualified applicants he had seen in 2 years but still did not get a call back. In another case, an African American employer offered to make sure the application of the Black male tester got to the manager. He also told him how to follow-up on the process. The Black male tester received a call back from the employer (Wells, 2013).
Footnotes
Author’s note
This article is based on the dissertation of Lenard Wells while attending Cardinal Stritch University, Milwaukee, Wisconsin.
Declaration of Conflicting Interests
The author(s) declared no potential conflicts of interest with respect to the research, authorship, and/or publication of this article.
Funding
The author(s) received no financial support for the research and/or authorship of this article.