
Abstract
Academic accountability is of great concern, therefore grade retention is being considered for both students with and without disabilities who are not meeting end-of-the-year achievement benchmarks. The purpose of this study was to investigate teacher attitudes toward grade retention and whether practices differ when recommending retention of students with or without disabilities. This mixed-methods study utilized a paper-and-pencil questionnaire using a Likert-type scale, as well as two open-ended questions and a checklist. Teacher interviews were also conducted. The findings of this study indicate that teachers are considering a multitude of factors when considering grade retention for their struggling students. Academic performance was the factor that teachers (77%) indicated the most frequently. Although teachers felt pressure and accountability from high stakes testing, they felt test results should be one of many factors considered in the retention decision.
Introduction
With the passage of the No Child Left Behind Act (NCLB) 2002 and school accountability for students’ performance increasing, more and more students are being “left behind” in their grade because they are not meeting the prescribed state and local achievement standards. Research shows that by ninth grade, 30% to 50% of students have repeated at least one grade during their school career (Goldberg, 2004; Jimerson & Kaufman, 2003; Johnson, 2001). Students are required to show their competence on a test to prove they have met the standards for their grade. In some instances, when students are not passing the exit test for their grade, retention in that grade is often the next step (Brown, 2007).
Historically, studies have shown that grade retention has a negative effect on students, as opposed to promotion to the next grade (Jimerson & Kaufman, 2003). Retention can increase the student’s chance of dropping out of high school and decrease his or her self-esteem (Jimerson, Anderson, & Whipple, 2002). Therefore, teachers are left in a quandary. If students are not meeting the standards to pass to the next grade, what options are in place to meet the needs of these students? Many teachers are still choosing to retain students, because it is their only alternative (Witmer, Hoffman, & Nottis, 2004).
Students with disabilities are required to participate in the state and district tests. Accommodations can be provided if they are included in the Individualized Education Program (IEP) or the 504 Accommodation Plan, and some students who are unable to take the test are provided with an alternate assessment. These tests are sometimes considered high stakes for students with disabilities, because the results may be used to make decisions about grade-level retention or promotion and graduation from high school (Thurlow & Johnson, 2000).
Problem Statement
“Increased political pressure on schools to demonstrate student achievement has pushed more and more educators to retain failing students in order to implement stricter promotion standards” (Ownings & Kaplan, 2001, p. 9). Research has shown that retention and social promotion are ineffective solutions for struggling learners (Bowman, 2005; Byrd & Weitzman, 1994; Jimerson, 2001). Social promotion is the practice of keeping students who fail with their age group, because of the social-emotional impact of retention. Research suggests many alternatives to retention such as, early intervention programs as well as summer and afterschool programs (Lincove & Painter, 2006). Professional development and effective early reading instruction are also alternatives suggested in the literature to prevent retention (Bowman, 2005; Lincove & Painter, 2006). However, these alternatives require funding and are not always possible in school systems where budgets are being reduced. School systems that have declining budgets are still forced to retain some struggling learners due to lack of alternatives. From a budgetary standpoint, retention might be short sighted. Retaining a student increases the educational cost for that student by 8% (Bali, Anagnostopoulos, & Roberts, 2005).
Students with disabilities are often being retained as a result of their performance on state testing (Katsiyannis, Zhang, Ryan, & Jones, 2007). The school department’s expectation is that with an extra year of education, the students with disabilities will improve their performance on the high stakes tests. This is a concern for educators because students with disabilities who perform poorly on the state tests may make the school look less effective when the test scores are published. Therefore, this can have a negative effect on teacher attitudes toward students with disabilities (Katsiyannis et al., 2007). It has been found that dropping out of school has increased for students who are retained, and it also has been proven that students with disabilities in special education programs are dropping out of high school at a higher rate than their peers who do not have IEPs (Thurlow & Johnson, 2000). Nationally, 41% of students with disabilities are dropping out of high school (Reschly & Christenson, 2006).
Teacher attitudes about retention do not necessarily reflect the research. In a study of teacher attitudes about retention, it was concluded that most teachers believe that grade retention between kindergarten and fourth grade is beneficial for the child (Witmer et al., 2004). Both students with disabilities as well as students without disabilities are sometimes held back a grade to improve their scores on a high stakes test (Thurlow & Johnson, 2000). Teachers are either not informed of the research regarding grade retention or choosing to go by their own professional opinions. The hypothesis for this study is that teachers are retaining students with disabilities due to the pressures associated with passing the high stakes testing in the upcoming years.
Background of the Study
History of Grade Retention
In 1983, A Nation at Risk was published, and it presented a dismal picture of American education. It was a call to action that education reform was needed in the United States. A Nation at Risk called for expanding graduation requirements, minimum competency tests, and establishing higher academic standards (Hayes, 2004; Vinovskis, 2009).
A Nation at Risk recommended that our schools needed more rigorous and measurable standards. This implied schools needed to become more accountable in the areas of student achievement. The preferred method of determining the level of accountability has become “high stakes testing.” High stakes testing has been introduced to ensure that curriculum standards are being effectively and efficiently taught. High stakes tests can determine whether a student passes to the next grade or receives a high school diploma. The introduction of new examinations at every level is one of the most controversial and lasting reforms from this report (Hayes, 2004).
High Stakes Testing
Accountability for schools was an essential part of this reform movement and therefore, high stakes testing was developed. Reform leaders wanted to make schools accountable for implementing curriculum standards. The most efficient and obvious measure of student learning was to develop tests. Every state needed to ensure that the curriculum aligned with its state achievement standards was being taught effectively and efficiently. In order for these tests to be taken seriously, leaders felt they needed the results to be meaningful to both students and school personnel (Hayes, 2004).
Consequently, to ensure that the tests would be taken earnestly, the results of tests were not only available to the school district; they were going to be disseminated to the public. Therefore, these tests needed to affect issues that were important to both students and school personnel such as grades, being promoted to the next level, and high school graduation. With the onset of these tests, many states increased their high school graduation requirement. Students would not be able to graduate from high school without passing the required test (Hayes, 2004).
NCLB 2001 requires accountability of schools and school districts for student performance. Students in Grades 3 through 8 and once in high school must be tested annually in reading and math. Schools are expected to demonstrate that they are making “adequate yearly progress” (Hayes, 2004). Some feel that NCLB requires that students who are not reading by third grade be retained. This retention would be for students who are not meeting end-of-the-year grade-level expectations (Lazarus & Ortega, 2007). Although no such requirement is in the law, since the passage of NCLB, the number of students being retained has increased due to the emphasis on accountability (Jimerson et al., 2006). Schnurr, Kundert, and Nickerson (2009) suggested, With the implementation of the No Child Left Behind Legislation (2001), grade retention is again at the forefront of education and political debate. It continues to be a widely accepted intervention for struggling students, retention has been revealed to be not only an ineffective and costly intervention with detrimental long-term consequences, but it has limited the discussion of effective alternatives for students at risk. (p. 417)
With the enactment of these mandates that hold educators accountable for student performance, there has been an increase in high stakes testing. Although the accountability requirement was intended for schools and educators, these high stakes tests impact the students more than the educators. High stakes testing can affect a student’s course and grade assignment, and whether or not the student is promoted to the next grade. Testing results may also determine whether or not the student receives a high school diploma (Vinovskis, 2009).
Grade Retention and Social Promotion
Grade retention is the practice of keeping students in their present grade because they have not mastered the skills necessary to progress to the next grade. Social promotion is the practice of keeping students who fail with their age group, because of the social-emotional impact of retention. President William Jefferson Clinton called for an end to social promotion in his last three State of the Union addresses. President Clinton stated that a child should not move onto the next grade “until they are ready” (Ownings & Kaplan, 2001). “Because there are often short-term gains, many educational professionals view retention as a success because they do not see the later difficulties that the large majority of retainees experience” (Schnurr et al., 2009, p. 416).
As our nation has pushed for higher academic standards in our schools, school districts have established minimum promotion and graduation standards. Therefore, grade retention has emerged as a vehicle for enforcing the standard driven academic system (Randolph, Fraser, & Orthner, 2004). High stakes testing has decreased the frequency of social promotion and increased the frequency of grade retention (Roderick & Nagaoka, 2005). The idea of grade retention is that it will offer students more time for learning. However, typically the instructional methods do not change and the year of retention is just a repeat of what occurred in the previous year (Bonvin, Bless, & Schuepbach, 2008). Jimerson (1999) found low-achieving students who were promoted displayed higher academic achievement in 11th grade. These promoted students were also less likely to drop out and more likely to receive a diploma or General Education Development (GED). This study suggests that grade retention and social promotion are not beneficial in either situation. Educators need to seek alternative intervention strategies that will enhance educational outcomes and provide effective research-based interventions addressing both academic and emotional needs (Jimerson, 1999).
Who Is Being Retained?
Demographics often are predictors of retention. It has been shown that African American children, poor children, and boys are more likely to be retained (Frey, 2005). Research has also revealed that minority students who have teachers of the same race are less likely to be retained (Bali et al., 2005). Predictors for early grade retention were looked at by Byrd and Weitzman (1994). This study concluded that several factors can influence early school failure such as being raised in poverty, low maternal education, or where one or more biological parents were absent. Finances, of course, come into play because retention is costly. School districts with substantial revenue and larger districts are more likely to retain students, because costs may not be as evident. Larger districts have a smaller per student expenditure; therefore, the cost of retention is less (Bali et al., 2005). Consequently, a child’s race, socioeconomic status, and family, and where the child lives can affect whether or not a child is retained.
Retention and Teacher Attitudes
Teacher attitudes toward retention were examined in a study conducted by Witmer et al. (2004), and it was found that teachers were not necessarily familiar with the research on retention. Most teachers felt that, if a child were retained in the years between kindergarten and fourth grade, it would be beneficial. Teachers’ felt that retention would improve a child’s school success and self-esteem. This study concluded that there is a need to educate the people who are making decisions about retention, about the research, and implications for students. “Overall, teachers described their knowledge of retention research as limited. The majority attributed their knowledge to personal experiences with retained students” (Witmer et al., 2004, p. 186).
Retention and Drop-Out Rates
The research studying grade retention and dropping out of high school is not quite clear. A review of the literature has shown that grade retention is the strongest predictor of high school drop-out status. Jimerson et al. (2002) indicated that the research also shows students who have been retained in two grades are 90% more likely to drop out of high school. Jimerson et al. suggested, An emphasis on accountability and standards has let to political pressures upon schools nationwide in evaluating their effectiveness and overall success by test scores. Of grave concern is that this unprecedented pressure has led to increased retention rates in order for schools to demonstrate a commitment to standards, rather than consideration of the long-term beneficial outcomes for students, particularly given that retention is strongly associated with high school dropout. (p. 454)
However, when Chicago instituted an eighth-grade promotional standard requirement, drop-out rates did not increase. Therefore, this study concluded that retention as a result of poor performance on high stakes testing does not have the same effects on retention as teacher initiated retention (Allensworth, 2005).
In a study of students with mild disabilities, grade retention was found to be a “powerful predictor” of dropping out of high school. For students with disabilities, not being retained was associated with a 73% reduction in the odds of dropping out of school. Students with a disability who dropout are less likely to earn a General Education Development (GED) diploma or go to a post secondary school than their peers without a disability. Therefore, it is imperative that students with disabilities continue in school and be supported so they can graduate. (Reschly & Christenson, 2006, p. 277)
Retention and Test Scores
In 1996, Chicago Public schools called for an end to social promotion and had promotion testing requirements for third, sixth, and eighth grade. This study examined whether retention leads to higher achievement for retained students, than if they had been promoted to the next grade. The results showed that retained students had a very limited improvement in their academic performance the year after the grade retention and no substantial effects were noted 2 years later. It concluded that students did not succeed in their 2nd year, because they were taught with the same approach. This study also found that retaining students increased the likelihood of placement in special education. Another implication of this study is that teaching techniques need to be examined before a child is retained. Sometimes a student is struggling due to the teaching approach not due to his or her ability to learn (Roderick & Nagaoka, 2005).
Jimerson conducted a meta-analysis of grade retention research in 2001. As a result of this review, it was concluded that neither grade retention nor social promotion in itself will provide the support a child needs for success. Educators need to implement research-proven remedial strategies. Jimerson suggests that school psychologists are in a role to help school systems explore new programs to help these at-risk students be successful in school (Jimerson, 2001).
NCLB
With the implementation of NCLB, many educators feared it would increase grade retention. However, the only grades that saw an increase in grade retention were kindergarten and first grade. It was actually discovered that students’ retention was more equitable. The link between low socioeconomic level and the likelihood of being retained decreased. One possible reason for this decline is that educators are basing retention decisions on more objective measures such as test scores rather than teacher judgment (Viadero, 2007). Due to the requirements of the NCLB and the Individuals With Disabilities Education Act 2004 (IDEA), an increasing number of students with disabilities are being included in high stakes tests. All students are being held accountable to proficiency standards and all assessment scores are being reported (Albrecht & Joles, 2003). Students with disabilities are given accommodations according to their IEP, and a small percentage of students are given an alternate assessment. However, these accommodations are often inadequate because the tests are not always appropriate for students with disabilities (Meek, 2006). Quite often if students do not pass the test, they are not permitted to go to the next grade (Meek, 2006; Schulte, Villwock, Whichard, & Stallings, 2001). Therefore, students with disabilities might be retained due to an inappropriate test.
“As schools face increased pressure to raise test scores, students who are on the verge of passing the test may receive the greatest attention and support, whereas other students with greater needs want for help” (Larsen & Akmal, 2007, p. 47). Therefore, some students are being retained because school districts are putting their time and money into students who can pass the high stakes test. In 2003, retention rates for low-income students increased. Frederick and Hauser (2008) attributed this rise to NCLB which was passed in 2002. Some policy makers believe that by having stricter promotion requirements, the number of students meeting these higher grade-level standards will increase. Their belief is that these higher standards and fear of retention will motivate students to work harder (David, 2008).
Many educators are concerned that the pressure from the high stakes tests are increasing grade retention and changing the curriculum. Students are being forced to learn the content of the tests and the curriculum is being narrowed to what is going to be on the test. Paper-and-pencil tests are not the only measure of a student’s knowledge. Many students are able to express themselves creatively and these high stakes test do not allow it. It seems that standardized tests should only be one measure in a portfolio to decide if a child is able to be promoted to the next grade (Neill, 2006).
Accountability and high stakes testing has raised the standards for all students, including those with disabilities. IDEA and NCLB have led to increased provision of accommodations so that students can demonstrate their knowledge on these large-scale assessments. Parents of students with disabilities are more aware of their rights and are asking for their students to be included in this more rigorous curriculum. Students are given greater access to the general education curriculum through enhanced awareness of appropriate accommodations to access the curriculum. Therefore, with higher expectations for all, more students are reaching higher academic goals (Ysseldyke et al., 2004).
End of Year Testing
In 1996, Chicago Public schools called for an end to social promotion and had promotion testing requirements for third, sixth and eighth grade. Students were retained if they did not pass the end-of-the-year test. The results shows that retained students had a very limited boost in their academic performance the year after the grade retention, and no substantial effects were noted 2 years later. It concluded that students did not succeed in their 2nd year, because they were taught with the same approach. Teachers need support to diagnose the problem that the student is having and then design effective strategies to support these struggling learners.
This study also found that retaining students increased the likelihood of placement in special education. During the retention year, students were often diagnosed with a learning disability. The researchers suggest that some students may be mislabeled as learning disabled because the special education status will help them to progress to the next grade without meeting all of the requirements. Therefore, special education is being used as a vehicle to circumvent the end-of-year testing policy (Roderick & Nagaoka, 2005).
Similarly, the reading scores of retained students were compared with a group of randomly selected students who had not retained. The retained students’ scores were compared for growth rates between the initial year and the repeated year. Then their scores were compared with a match group of promoted students. This analysis showed that the retained students did not show a significant increase or decrease in reading scores in the 2nd year of that grade. The promoted students showed significantly more growth overall than the retained students. This study concludes that as retention is a costly venture and the benefits do not outweigh the positive intent, other types of interventions should be examined (Silberglitt, Jimerson, Appleton, & Burns, 2006).
In 2003, Texas required third graders to receive a minimum score on its state-mandated reading test to be promoted to fourth grade. In addition, in 2005, fifth graders had to meet a minimum score on both a reading and math test to be promoted to sixth grade. Lorence and Dworkin (2006) followed students who failed third grade in May 1994 in Texas and repeated third grade until these students were in tenth grade. This study concluded that after repeating third grade, the reading scores of the students who had been retained remained consistent with the scores of socially promoted students. However, as the years progressed, the students who were retained in third grade surpassed their peers who had been socially promoted. Many of the students who were socially promoted took an extra year to pass the state reading test whereas the students who were retained passed on time.
In a study of how standards-based reform affected teacher quality, it was found that administrators were reducing class size and putting more experienced teachers in the grades that were being tested (Viadero, 2007). In Florida, third-grade students were being retained because they failed the state high stakes assessment (Florida Comprehensive Assessment Test [FCAT]). In some schools, second graders were being retained because school personnel believed that these students would not be able to pass the test in third grade (Lazarus & Ortega, 2007). In 2003, 6,000 students were required to repeat third grade after failing to meet the state’s end-of-grade standard. Therefore, it was decided that school personnel could override the test scores after reviewing student work and other factors (Goldberg, 2004). The decision of grade retention is an important one and should be made by examining multiple assessments and several sources of evidence (Thompson & Cunningham, 2000).
Due to the requirements of NCLB and IDEA, an increasing number of students with disabilities are being included in high stakes tests. Students are provided testing accommodations and a small percentage of students participate in an alternate assessment. However, these accommodations are often inadequate because the tests are not always appropriate for students with disabilities (Meek, 2006). Therefore, if students do not pass the test, they are not permitted to go to the next grade although the test was not a proper measure of their ability (Meek, 2006; Schulte et al., 2001).
Alternatives to Retention
The review of the literature consistently agrees that there should be an end to social promotion and grade retention. Educators need to focus on implementing teaching practices that will prevent academic failure. However, the literature offers suggestions of alternatives and concedes that deciding which is right for a school system will be a difficult endeavor.
Included among the suggestions for alternatives to grade retention are several studies suggesting that one way to prevent early school failure is to develop preschool intervention programs. These programs would target at-risk children and assist them in developing the social and cognitive skills necessary for early success in school. Head Start programs have been doing this successfully for several decades (Barnett & Hustedt, 2005). It has been proven that targeting these skills at an early age can prevent retention (Lincove & Painter, 2006).
Effective early reading programs are also indicated in the literature as an effective way to prevent retention. Reading is an essential skill for success in school; therefore, all children need to learn to read in the early grades. Reading instruction needs to be structured and teachers need to be trained in the most effective programs for their population (Lincove & Painter, 2006).
Summer school and afterschool programs will provide many students with additional opportunities for instructional support. The literature is clear that programs that focus on effective teaching and offer remedial intervention programs improve student achievement. Hence, students with this additional support either after school or during the summer are less likely to drop out of school due to repeating a grade (Lincove & Painter, 2006).
Professional development for teachers is critical if grade retention is going to be eliminated. Teachers need to be trained in teaching strategies which will improve learning for all students. Training in assessment techniques that drive instruction, as well as monitoring student’s progress while they are being taught, will help teachers to teach effectively. Districts need to set clear policies on retention and promotion as well giving teachers the training that is necessary to provide effective instruction (Bowman, 2005).
Conclusion
Research has shown that retention and social promotion are not viable solutions for struggling students. Research has identified students who are more likely to be retained and those who need more support in their academic career. Nonetheless, with increased political pressure to establish achievement standards for students and school accountability for students’ performance, school systems are under scrutiny. Schools are expected to improve student achievement and test scores and provide appropriate supports and services for struggling learners. Teachers and administrators are often making these retention decisions without knowledge of the research and quite often there are not many supports available for their struggling students due to budget constraints.
The literature provides many suggestions for alternatives to retention. However, these alternatives can be costly, which may limit the options considered by districts. Several factors may influence the decision: the population to be served, the resources available to support such programs, state and local testing requirements, and the training for teachers. The challenge is that student populations vary in each and every classroom; yet the teacher needs to be effective for all the children in the class. Districts need to determine how training and support can be provided effectively and efficiently through this difficult process.
Although the research is clear on the ineffectiveness of retention and the need for alternatives, teachers continue to retain both students with and without disabilities. Therefore, there is a need to examine why teachers are making these retention decisions and what factors need to change in order for the struggling students to receive support without adding another year of education.
Research Questions
The research questions guiding this study were as follows:
Research Question 1: Are there differences in elementary teachers’ decision-making process regarding retention for students with and without disabilities?
Research Question 2: What factors influence elementary teachers’ decision-making process about retaining students with and without disabilities?
Research Question 3: How does student performance on state testing affect elementary teachers’ decision-making process about retaining students with and without disabilities?
Research Design
This study used a concurrent triangulation, mixed method in which elementary teachers responded to a questionnaire and then selected teachers were interviewed. This two-phase study began with collecting quantitative data from the questionnaire at three different elementary schools in an urban school district (Creswell & Clark, 2007). The survey of N = 74 teachers was cross-sectional because all the data were collected at one time (Creswell, 2003). Following the gathering of data from the questionnaire, n = 9 teacher interviews were scheduled and conducted.
Sample
The sample for this study consists of N = 74 teachers from n = 3 elementary schools in an urban school district in Southeastern Massachusetts. This district has n = 9 elementary schools. The researcher attended faculty meetings for these n = 3 schools to distribute and collect the questionnaires at the meetings. Teachers who completed the questionnaire were asked to volunteer to be interviewed at a future date and time. The researcher selected teachers from different grade levels at each school as well as two special education teachers. The researcher interviewed n = 9 teachers from the three elementary schools during the teacher’s preparation period.
Instrumentation
The paper-and-pencil instrument designed by the researcher contained 24 items requiring responses using a Likert-type scale (Appendix A). The response scale ranged from 1 (strongly disagree) to 5 (strongly agree), and it included two open-ended questions and a checklist. For each question, teachers were asked to respond how they perceived each question for both regular education students as well as students with disabilities. For the purpose of this study, students with disabilities were defined as any student with an IEP or a 504 Accommodation Plan. The principals allowed time at the meeting for the researcher to explain the survey and for the teachers to complete it. The instrument was constructed from a review of the literature and the judgmental review by n = 3 elementary teachers to increase content validity (Beck & Gable, 2001). A consent form was attached to the questionnaire and with its completion, the teachers consented to participate.
The instrument was piloted with a group of n=3 elementary teachers who were not involved in the study. The qualitative data were compiled by the researcher from the interviews with the elementary school teachers. The interview questions were determined from the review of the literature and the open-ended questions in the questionnaire (Appendix B). The interviewer asked questions that were designed to evoke vivid descriptions and anecdotes. Follow-up questions were designed to provide nuanced answers that provided more precise descriptions and refine the understandings. Richness of ideas and themes was encouraged by asking the interviewee to elaborate on their answers.
The researcher utilized Rubin and Rubin’s (2005) responsive interviewing technique to obtain a deeper understanding of the perceptions of the teachers being interviewed. The interviewer used a predetermined set of questions but allowed the interviewee to digress into topics relevant to the study. The interviews were structured, so that the data were detailed, vivid, and rich with thematic material (Rubin & Rubin, 2005). Throughout the interview process, the researcher made an audit trail to ensure a chain of evidence linking the research questions and the data (Gall, Gall, & Borg, 2007). The interviews were audiotaped with the participants’ permission. Participants also consented to the interviews being transcribed as well for any future use for presentations.
Data Collection
The researcher was able to attend faculty meetings at the three schools. This gave the researcher time to explain the survey instrument and interview process. The teachers were given time to complete the surveys at the meeting and the researcher was able to collect the survey and interview volunteer information. When the survey instrument was administered, there was a separate sheet for teachers to use if they were interested in being interviewed at a later date. Teachers who volunteered to be interviewed placed the sheet in a separate collection box; therefore, there was not a process to connect the individual teacher with his or her survey instrument.
After the survey data had been collected, the responses to the open-ended questions were reviewed to see if supplementary questions needed to be added to the interview protocol. The interviews were conducted in a face-to-face manner and enabled the participants to give historical information about children whom they had retained and how their decisions had been made as to whether or not to retain a child as well as what factors they consider when retaining a child.
An interview protocol was used to guide the interviewer. The interviewer took notes and also audiotaped the interview with the permission of the participants (Creswell, 2003). The interview questions for teachers included questions about the benefits of retention and what factors influenced their decisions to retain a student. Teachers were first asked to sign a consent form giving the researcher permission to use the information provided in the interview. The interviewer asked open-ended questions and audiotaped the interviews with the participant’s permission. Finally, the researcher gathered the data and analyzed them for themes. Subsequently, the researcher transcribed the interviews and sent the transcript to the participants. Member checking was utilized by the researcher sending the transcript to the interviewees by email for their review to determine the accuracy of the findings (Creswell, 2003).
Data Analysis
For the first research question, quantitative data were extracted from the questionnaire by using descriptive statistics (frequencies, percentages, means, and standard deviations) where appropriate. A paired t test was used to compare the differences between the means of responses of teachers when considering retention for students with and without disabilities. Qualitative data from the open-ended questions on the survey as well as an interview question were also utilized in this analysis. The second research question data were gathered from survey questions, a checklist on the survey, and some of the interview questions. The last research question used qualitative data from an open-ended question on the survey and interview questions. However, there were four quantitative questions on the survey regarding this topic.
The purpose of the concurrent triangulation strategy was to confirm or corroborate the finding with this mixed-methods study (Creswell, 2003). Therefore, once the quantitative and qualitative data were analyzed, the researcher merged the two sets of data. Both data sets were looked at equally and the findings were compared and synthesized (Creswell & Clark, 2007). The reports of the findings were sent to all of the principals involved in this study as well as the superintendent of the district.
Findings
Research Question 1: Are there differences in elementary teachers’ decision-making process regarding retention for students with and without disabilities?
Academic Performance
There were two items on the survey with the largest effect sizes for the t statistic (Appendix C). The first item was “I am more likely to retain a student than send him or her to the next grade without the necessary skills.” This item was more significant for special education students. Lorence and Dworkin (2006) indicated in their study that special education students were more likely to be socially promoted because they were not required to meet the grade-level benchmarks. The teachers in this study expressed just the opposite view. Based on their survey responses, the teachers were more likely to retain a student with a disability than a regular education student who does not have the necessary skills to go to the next grade. The literature also cites academic performance as the most important factor teachers consider when making decisions regarding grade retention and this study found similar findings (Witmer et al., 2004).
Two other items that showed a statistical trend were “I retain students because I am worried they will fail the next grade” and “I retain students who are failing two major subjects” (Appendix C). These items were found to be more significant for regular education students. These two items reflect concerns about academic performance which has been reported in the literature as the most important factor when teachers are making a decision regarding grade retention (Bonvin et al., 2008; Witmer et al., 2004). Therefore, teachers in this study considered academic performance a concern for both students with and without disabilities.
Retention More Effective in Grades K-2
The second item was “I believe retention is more effective in the earlier grades (K-2),” which had an effect size of .41 (Appendix C). This item was more significant for regular education students. The belief that grade retention is better for students in earlier grades is evident in the literature on grade retention (Witmer et al., 2004). This belief is also evident in the results of this survey in particular for regular education students.
Positive Retention in the Past
One item that showed a statistical trend was “I have retained students who have been very successful in future years of school” and was found to be more significant for regular education students (Appendix C). Larsen and Akmal (2007) found that although teachers knew the research on grade retention stated it was generally not effective, most teachers could remember a specific case where it seemed to be beneficial. Therefore, they continue to hold on the feeling that for some children, the retention might work. Jimerson (1999) indicated that teachers feel grade retention is successful because they see success in 1 or 2 years following the retention. However, teachers typically do not follow the student through high school. A similar finding in this study emerged during an interview, when a fourth-grade teacher commented on a former student whom she had retained, and had a positive experience: A couple of years ago I retained a student in fourth grade. The child was immature. Teachers had been passing him on because he was nice. I fought to hold him back because I thought it would be beneficial. It was successful. The second year he received B’s and C’s. In fifth grade, he was a B student. His mom said it was the best thing that ever happened. She thanked me and said she was asking for him to be retained since kindergarten.
Remedial Support
The last item that showed a trend in the teachers’ ratings was “I am more likely to retain a student who does not receive any remedial support” (Appendix C). This item was also found to be more noteworthy for regular education students. It seems obvious that this would be more significant for regular education students because students with disabilities are already receiving remedial support. A third-grade teacher commented during her interview, “I am more apt to send a child on if I know they are going to get support in the following grade.” A first-grade teacher commented, “We need more services and support as opposed to grade retention.” Lincove and Painter (2006) indicated the need for appropriate instruction to meet individual student’s need as an alternative to grade retention. Jimerson (2001) indicated in his meta-analysis that the need for additional remediation strategies and support to facilitate educational success for all students was a common theme in the literature on grade retention.
Research Question 2: What factors influence elementary teachers’ decision-making process about retaining students with and without disabilities?
Academic Performance
According to the totals, 77% of respondents indicated on the checklist that academic performance influenced their decision-making process regarding grade retention, making this factor the most frequently cited (Appendix D). This concurs with Witmer et al. (2004) in their study of teacher’s beliefs and knowledge about grade retention, which found that academic performance was considered twice as important as the second most important factor (ability). Witmer et al. also found effort and maturity to be significant factors. The least cited factors in this study were summer birthdays and self-esteem with only 10% of respondents indicating that they considered these factors in their decision making. During the interviews, 89% of the teachers cited academic performance as a factor they consider when retaining a student.
Maturity
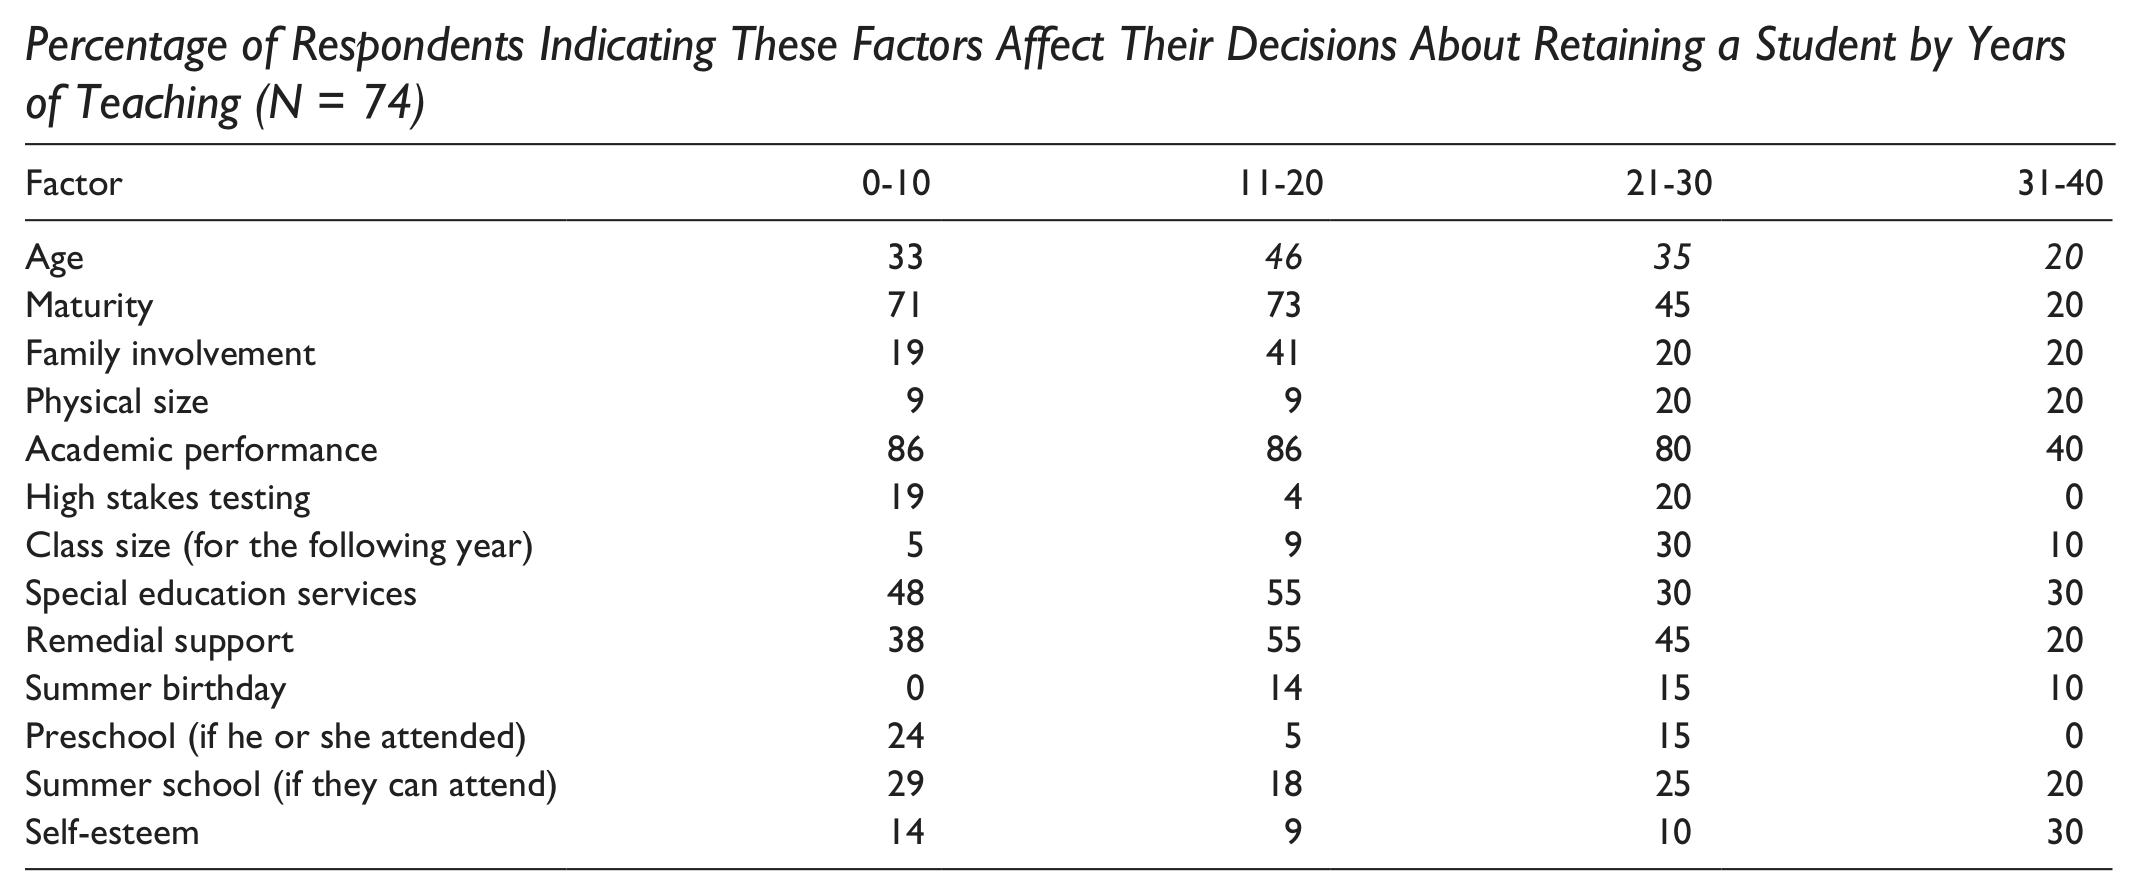
The participant’s choices by the number of years they have been teaching indicate that respondents who have been teaching for fewer years (0-20 years) considered a child’s maturity more than teachers those who have been teaching for a longer period of time (21-40 years; Appendix E). During the interview, a teacher who had been teaching for 12 years commented, “The biggest factor is maturity. Can the child maintain focus? Can the child do work that is well thought out and well done?” A teacher who has been teaching for 27 years commented, “Maturity plays a part in my decision but not a big one.” When responses were organized by grade-level taught, teachers who taught kindergarten through second grade (72%) indicated that they considered maturity when making a decision regarding grade retention more than teachers who taught Grades 3 to 5 (60%) and coaches (38%). Maturity is cited in the research as an area that teachers look at in kindergarten and first grade to determine whether a child should repeat a grade, be placed in a transition room, or delay entry into school (Byrd & Weitzman, 1994; Gay, 2002; Graue & DiPerna, 2000).
High Stakes Testing
High stakes testing was indicated most by Grades 3 to 5 teachers (23%) while only 9% of K-2 teachers indicated it was a factor and none of the coaches (Appendix F). As the Massachusetts Comprehensive Assessment System (MCAS) begins in Grade 3, it would be logical that Grades 3 to 5 teachers would be feeling the most pressure in elementary schools. Vinovskis (2009) discussed the pressure that educators feel as a result from high stakes testing and how it affects their decision making in regard to grade retention.
Parental Support
Most of the teachers interviewed felt parental support was very important. Several teachers responded that they were less apt to retain if parents were willing to get involved and support academics at home or get tutoring. A second-grade teacher commented, “If parents support retention, then it is easier to retain. Some parent’s will help you and write a letter in support of retention. If parents fight you then I don’t push for retention.” Parental support is cited in the research as an important component to student success (Jimerson et al., 2006).
Social and Emotional Concerns
Social and emotional concerns were also noted. The majority of teachers felt retention was better if it was done in the earlier grades where it did not have a big social stigma. A first-grade teacher expressed concern that, “When a child is retained, he or she sees it as a punishment.” This concurs with Byrnes and Yamamoto’s (2001) finding that nonpromotion is considered a punishment for one’s inability to succeed. The teachers expressed concern that as students get older, the other students in the class can be mean. A special needs teacher who expressed concern that repeating in an upper grade can be negative commented, “It is also negative to sit in a class that is too difficult. Then the child might become a behavior problem.”
Special Education Teachers Consider a Multitude of Factors
When examining the responses by the role that teacher has in the school, the results illustrate that special education teachers were likely to indicate more factors for retention as compared with regular education teachers and coaches (Appendix D). The n = 5 teachers who were interviewed and had a special education background considered a multitude of factors when retaining a student. These data suggest that special educators are examining more factors than regular education teachers and coaches when making a decision about retention. During an interview, a fifth-grade special education teacher commented, “You need to look at the whole child, both academic and social. There may be a student who struggles with academics but should not repeat because it is socially detrimental.” The opinions of these teachers are consistent with the research that decisions about students placements should be from a variety of indicators of which high stakes testing is one (Neill, 2006).
Research Question 3: How does student performance on state testing affect elementary teachers’ decision-making process about retaining students with and without disabilities?
High Stakes Testing—One Factor of Many That Are Considered
Teachers clearly expressed concern about the pressure and accountability they felt from the MCAS as well as the concern that students need to pass the high school test to graduate. Some teachers indicated that the MCAS data are released too late to make retention decisions and that MCAS has changed their teaching, not their grade retention decisions. When asked about MCAS, one regular education teacher responded, “I worry more about the student not having the skills. They will need to pass MCAS—so I now consider retention, when before I did not worry much.” The literature on grade retention indicates that the focus on accountability and test scores has put more of a focus on grade retention (Larsen & Akmal, 2007).
The first interview question was “What do you perceive the relationship between grade retention and high stakes testing to be”? The teachers interviewed felt that grade retention should be looked at on a case by case manner and it should be a team decision. It was felt that high stakes testing should be one item among many that are considered when making this decision which is consistent with the literature (Neill, 2006). Some of the kindergarten, first-, and second-grade teachers expressed concern regarding pressure from the upper grade teachers to retain some struggling students. The teachers said the upper grade teachers complain to the lower grade teachers that certain students are not ready to take the test. A first-grade teacher responded, “Some people feel if a student is kept back a year then they will be more mature for the MCAS in third, fourth, or fifth grade. They think they will be able to sit longer for the test.” This teacher went on to say that she did not feel retention will always improve test scores and that we need to look at the underlying reason why the child is struggling. Jimerson (2001) reiterated that remedial strategies are more effective than grade retention and social promotion.
Discussion and Conclusion
The practices of grade retention and social promotion have been debated for decades. The research indicates that the benefits of grade retention are limited and most students profit from being promoted to the next grade with academic support (Jimerson, 2001). However, with the onset of high stakes testing and greater accountability for schools, grade retention has become an issue again. Teachers are feeling the pressure to meet the end-of-the year requirements for both students with and without disabilities (Larsen & Akmal, 2007).
When comparing their perceptions regarding regular education students and special education students, teachers considered academic performance as a factor for both students with and without disabilities. For regular education students, teachers felt it was better to retain them in the earlier grades and remembered retaining a student in the past that had been a positive experience.
When considering what factors teacher’s use in regard to grade retention, academic performance was the most prominent. This is consistent with the literature (Witmer et al., 2004). Maturity continues to be an important factor especially among teachers of the lower grades and special educators. Special education teachers as a whole tended to consider more factors when considering retention decisions. Teachers were also concerned about the amount of remedial support their students would be receiving in the next grade.
The hypothesis for this study was that teachers are retaining students with disabilities due to the pressures associated with passing the high stakes testing in the upcoming years. Teachers were clear that they felt pressure to raise the test scores. They indicated that they were being held accountable for the student’s progress and MCAS had changed the way they were teaching. However, they did not feel high stakes testing alone was increasing the prevalence of grade retention in their district. The teachers felt test scores should be one piece of a larger picture that is examined by a team when making a decision regarding grade retention. Teachers reported that when they would like to retain a child they needed to gather all test scores as well as work samples and send it to central administration before retaining a student. It was noted that this was a new policy that was developed in the past 2 years.
Recommendations
After a review of the findings in this study and the literature, recommendations can be made for both district administrators and teachers.
For District Administrators
Continue to provide professional development for teachers regarding how to support struggling learners. Teachers indicated on the survey that they were interested in more training.
Continue to make grade retention a team decision. Test scores should be one factor of many when considering this decision.
Evaluate more ways to support struggling students. Look at school personnel to consider who can help provide interventions for at-risk students.
For Teachers
Continue to provide students with research-based teaching that supports all students.
Consider a multitude of factors when making a decision regarding grade retention. Familiarize and educate yourself on the research regarding grade retention.
Work with building administrators to develop a plan to provide interventions for struggling students to prevent grade retention.
For Further Study
This study explored teacher perceptions regarding grade retention for students with and without disabilities. After reviewing the findings, area of future research are recommended:
What specific interventions can be provided to struggling students to prevent grade retention for students with and without disabilities?
How can students be supported when they are struggling but do not qualify for special education services?
How can students with disabilities be supported to pass the high stakes test?
What are the effects of high stakes testing on grade retention for students with disabilities?
What is the relationship of teacher perceptions of grade retention in regard to the setting in which they are teaching—urban versus suburban?
Summary
This mixed-methods study examined teacher perceptions regarding grade retention for students with and without disabilities. The results of this study indicate that teachers consider a multitude of factors when considering grade retention for their struggling students. Academic performance and maturity were the factors that were indicated the most. Teachers reported they felt pressure and accountability in regard to high stakes testing but did not believe it was or should be the sole reason a child is retained. Teachers felt grade retention needed to be a team decision and a variety of factors need to be considered.
Special education teachers considered more factors than regular education teachers when making a decision about grade retention. Teachers felt retention was more effective for regular education students if it was done in an earlier grade and teachers could recall a past experience where they had retained a student and it was a positive experience. Overall, the results of this study were consistent with the research on teacher perceptions about grade retention.
Footnotes
Appendix A
Appendix B
Appendix C
Means, Standard Deviations, and t tests on Teacher Perceptions of Retention for Students With and Without Disabilities Questionnaire (N = 74)
| Reg. Ed. |
Spec. Ed. |
||||||
|---|---|---|---|---|---|---|---|
| Survey question | M | SD | M | SD | t | p | d |
| Timing | |||||||
| 1. I believe retention is more effective in the earlier grades (K-2). | 4.39 | 0.75 | 4.03 | 1.01 | 3.78 |
|
|
| 2. I am more likely to retain a student who has a summer birthday. | 2.30 | 1.04 | 2.20 | 0.99 | 1.98 | .052 | |
| 3. I am more likely to recommend a child complete an extra year of preschool than repeat kindergarten. | 2.90 | 1.26 | 2.91 | 1.25 | −0.28 | .784 | |
| Teacher perceptions | |||||||
| 4. I am more likely to retain a student who has support with academic work at home. | 2.52 | 0.92 | 2.52 | 0.92 | 0.001 | 1.00 | |
| 5. I am more likely to retain a student whose parents are in favor of retention. | 3.35 | 1.03 | 3.21 | 1.11 | 1.93 | .058 | |
| 6. I am more likely to retain a student who has social skills a year behind his or her peers. | 3.00 | 1.03 | 3.00 | 1.08 | 0.001 | 1.00 | |
| 7. I have retained students who have been very successful in future years of school. | 3.66 | 1.12 | 3.4 | 1.08 | 2.96 |
|
|
| 8. I am more likely to retain a student than send him or her to the next grade without the necessary skills. | 3.42 | 1.08 | 3.83 | 0.91 | 3.74 |
|
|
| 9. I worry that students who I have retained will drop out of school. | 2.76 | 1.11 | 2.8 | 1.09 | −0.54 | .594 | |
| 10. I retain students to improve their self-esteem and confidence. | 2.62 | 1.06 | 2.66 | 1.07 | 1.00 | .321 | |
| 11. I retain students because I am worried they will fail the next grade. | 3.72 | 0.93 | 3.49 | 0.99 | 3.22 |
|
|
| 12. I retain students because I think they will not get the support they need in the next grade. | 2.59 | 1.09 | 2.58 | 1.13 | 0.276 | .784 | |
| 13. I retain students who are failing one major subject | 2.44 | 1.06 | 2.37 | 1.03 | 2.31 | .024 |
|
| 14. I retain students who are failing two major subjects. | 3.69 | 0.96 | 3.46 | 1.08 | 3.06 |
|
|
| High stakes testing | |||||||
| 15. All of my students are concerned about their performance on the Massachusetts Comprehensive Assessment System (MCAS). | 2.82 | 1.18 | 2.66 | 1.15 | 2.50 | .015 | |
| 16. I feel pressure to retain students due to the MCAS. | 2.56 | 1.10 | 2.44 | 1.03 | 1.73 | .088 | |
| 17. I am more likely to retain a student because of the pressure to pass the MCAS. | 2.46 | 1.12 | 2.37 | 1.09 | 1.76 | .083 | |
| 18. I believe retaining a student will help his or her performance on the MCAS. | 2.78 | 1.05 | 2.68 | 1.07 | 1.84 | .070 | |
| Alternatives to retention | |||||||
| 19. I am more likely to have a student attend summer school than be retained. | 3.41 | 1.08 | 3.41 | 1.11 | 0.01 | 1.00 | |
| 20. I am more likely to retain a student who did not go to preschool. | 2.29 | 0.94 | 2.20 | 00.89 | 2.18 | .033 | |
| 21. I am more likely to retain a student who will be going into a large class the following year (more than 25 students). | 2.54 | 1.02 | 2.43 | 1.02 | 1.63 | .109 |
|
| 22. I am more likely to retain a student who will be going into a class the following year without a teaching assistant. | 2.39 | 0.91 | 2.43 | 1.04 | −0.77 | .443 | |
| 23. I am more likely to retain a student who does not receive any remedial support. | 3.04 | 1.10 | 2.86 | 1.09 | 3.17 |
|
|
| 24. I would like more training to work with struggling students, so I do not have to retain them. | 3.84 | 1.15 | 3.77 | 1.15 | 1.92 | .058 | |
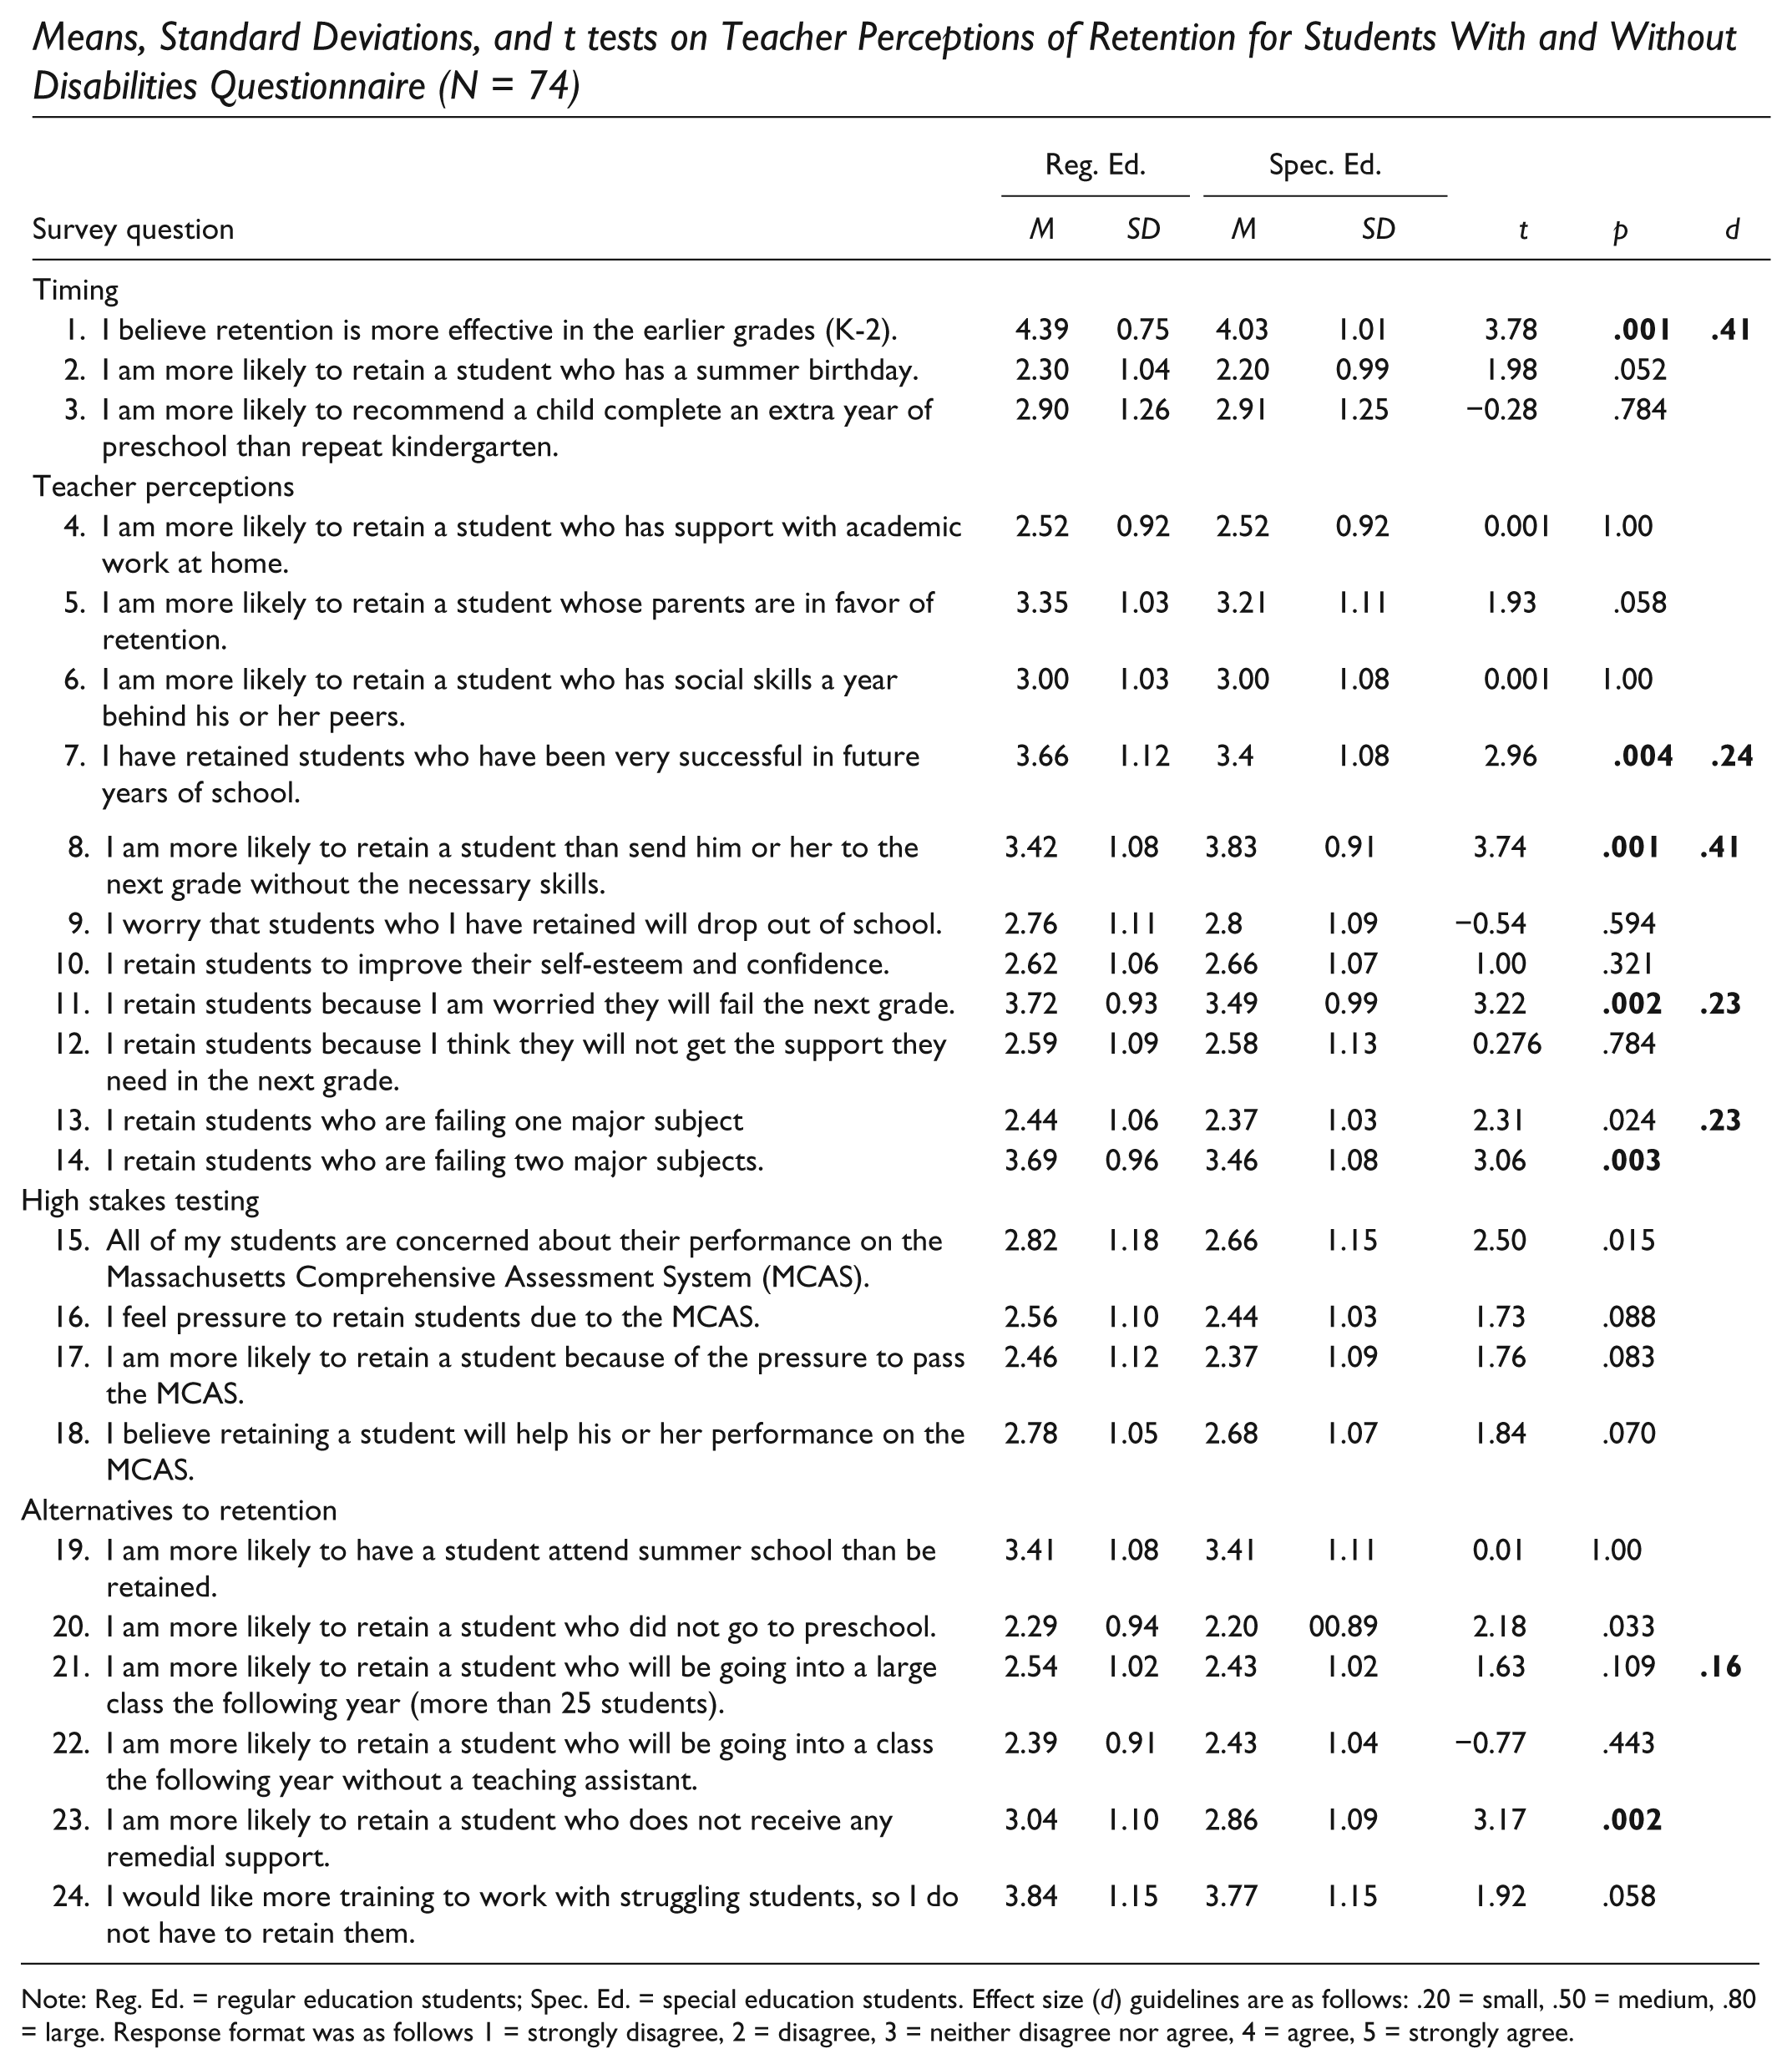
Note: Reg. Ed. = regular education students; Spec. Ed. = special education students. Effect size (d) guidelines are as follows: .20 = small, .50 = medium, .80 = large. Response format was as follows 1 = strongly disagree, 2 = disagree, 3 = neither disagree nor agree, 4 = agree, 5 = strongly agree.
Appendix D
Percentage of Respondents (By Role) Indicating These Factors Affect Their Decisions about Retaining a Student (N = 74)
| Factor | Reg. Ed. | Spec. Ed. | Coach | Total |
|---|---|---|---|---|
| Age | 33 | 53 | 11 | 35 |
| Maturity | 54 | 84 | 22 | 56 |
| Family involvement | 21 | 42 | 22 | 26 |
| Physical size | 9 | 26 | 11 | 14 |
| Academic performance | 81 | 84 | 56 |
|
| High stakes testing | 14 | 16 | 0 | 12 |
| Class size (for the following year) | 9 | 21 | 22 | 14 |
| Special education services | 35 | 74 | 22 | 42 |
| Remedial support | 42 | 58 | 22 | 42 |
| Summer birthday | 5 | 21 | 11 |
|
| Preschool (if he or she attended) | 7 | 32 | 0 | 12 |
| Summer school (if they can attend) | 19 | 37 | 22 | 12 |
| Self-esteem | 7 | 21 | 0 |
|

Note: Reg. Ed. = regular education teacher; Spec. Ed. = special education teacher. Coach refers to literacy or math coach.
Appendix E
Percentage of Respondents Indicating These Factors Affect Their Decisions About Retaining a Student by Years of Teaching (N = 74)
| Factor | 0-10 | 11-20 | 21-30 | 31-40 |
|---|---|---|---|---|
| Age | 33 | 46 | 35 | 20 |
| Maturity | 71 | 73 | 45 | 20 |
| Family involvement | 19 | 41 | 20 | 20 |
| Physical size | 9 | 9 | 20 | 20 |
| Academic performance | 86 | 86 | 80 | 40 |
| High stakes testing | 19 | 4 | 20 | 0 |
| Class size (for the following year) | 5 | 9 | 30 | 10 |
| Special education services | 48 | 55 | 30 | 30 |
| Remedial support | 38 | 55 | 45 | 20 |
| Summer birthday | 0 | 14 | 15 | 10 |
| Preschool (if he or she attended) | 24 | 5 | 15 | 0 |
| Summer school (if they can attend) | 29 | 18 | 25 | 20 |
| Self-esteem | 14 | 9 | 10 | 30 |
Appendix F
Percentage of Respondents (By Grade-Level Taught) Indicating These Factors Affect Their Decisions About Retaining a Student (N = 74)
| Factor | K-2 | 3-5 | K-5 |
|---|---|---|---|
| Age | 36 | 47 | 19 |
| Maturity | 72 | 60 | 38 |
| Family involvement | 32 | 20 | 29 |
| Physical size | 9 | 20 | 10 |
| Academic performance | 86 | 87 | 57 |
| High stakes testing | 9 | 23 | 0 |
| Class size (for the following year) | 23 | 10 | 10 |
| Special education services | 50 | 47 | 29 |
| Remedial support | 55 | 43 | 29 |
| Summer birthday | 14 | 10 | 5 |
| Preschool (if he or she attended) | 14 | 20 | 0 |
| Summer school (if they can attend) | 18 | 27 | 24 |
| Self-esteem | 9 | 13 | 5 |

Note: K-2 = kindergarten through second grade; 3-5 = third through fifth grade; K-5 = kindergarten through fifth grade.
Declaration of Conflicting Interests
The author(s) declared no potential conflicts of interest with respect to the research, authorship, and/or publication of this article.
Funding
The author(s) received no financial support for the research and/or authorship of this article.
Author Biography