
Abstract
School counselors play a vital role in promoting students’ development in academic, career, and social/emotional domains. Professional organizations and educational partners have advocated for equitable access to school counselors and school counseling services by all students from pre-K through 12th grade. However, recent controversies have questioned effects of the student-to-school-counselor ratio and student outcomes. Using multiple databases retrieved from the New York State Education Department, we performed two separate two-way multivariate analyses of variance of the interaction effects of student-to-school-counselor ratio and schools’ race/ethnicity composition on student achievement on math and English language arts standardized tests, chronic absenteeism, and high school graduation and postsecondary 4-year college enrollment rates. Our analyses yielded significant interaction effects on students’ graduation and 4-year college enrollment rates and math test results. We discuss the contextualization of student-to-school-counselor ratio and implications for advocacy.
Introduction
School counselors are in a unique position to facilitate students’ development in academic, career, and social/emotional domains (American School Counselor Association [ASCA], 2019). In their comprehensive review of school counseling research, Carey and Martin (2015) asserted that school counselors have “great potential to contribute to the public good by improving educational outcomes for students” (p. 3). In a time of crisis such as COVID-19, school counselors have been called upon to be leaders in the U.S. education system (Alexander et al., 2022; ASCA, 2019; Hilts & Liu, 2023). They are often credited for the delivery of holistic services to all students, and the effectiveness of comprehensive school counseling programs has been well established at various grade levels across schools and states (e.g., Carey & Dimmitt, 2012; Whiston et al., 2011). Given the comprehensive nature of school counseling programs, accountability of the programs has been linked to students’ achievement and holistic development measured through benchmarks such as academic performance, college and career success, school absence, and discipline (ASCA, 2019).
Student Achievement
In an effort to streamline and advocate for school counselor roles, scholars have suggested a unified educator–counselor identity capturing school counselors’ role as both an educator and a counselor following a nonhierarchical order (Levy et al., 2024; Levy & Lemberger-Truelove, 2021). A core part of an educator’s role is to enhance students’ achievement and contribute to a learning environment that serves to maximize student learning. School counselors’ educator role seems to be closely linked to educational legislation and policies. For example, the National Defense Act of 1958 positions school counselors to identify and support students’ postsecondary educational and career interests. The Every Student Succeeds Act (ESSA, 2015) holds school counselors accountable for promoting students’ achievement and career outcomes; in this vein, ESSA charges school counselors with demonstrating data disaggregation and analysis based on subgroups of students. These acts notwithstanding, policymakers have called continuously for empirical research on school counselors’ roles in relation to student achievement outcomes (Carey & Martin, 2015).
Student-to-School-Counselor Ratios
Despite widely endorsed school counselor activities to enhance student outcomes, the extant literature has documented consistent evidence that organizational barriers keep school counselors from performing appropriate school counseling duties and activities (Hilts et al., 2019; Savitz-Romer et al., 2023; Savitz-Romer & Nicola, 2022). One commonly acknowledged organizational barrier concerns the student-to-school-counselor ratio, also referred as school counselor caseload. Student-to-school-counselor ratio is not a novel concept in school counseling and broader educational research. Almost four decades ago, researchers performed a comparative analysis of ratios based on large samples involving students from Grades 3–8, which yielded favorable responses from both students and parents toward lower ratios (Boser et al., 1988). In Boser et al.’s (1988) study, 600 students per school counselor was operationalized as the low student-to-school-counselor ratio and 1000 or more students per school counselor was analyzed as the high-ratio group. Ratio thresholds have drastically changed since then, due to evolving student and school needs. Since the 2000s, ASCA and state organizations have engaged in ongoing advocacy for more manageable school counselor caseloads, with a recommended ratio of 250 students per school counselor (ASCA, 2019). Between Boser et al.’s (1988) research and ASCA’s recommended ratio of 250:1, there exists a salient gap for conceptualization of student-to-school-counselor ratios and student outcomes. Most recently, Nicola (2023) deconstructed theories underpinning the recommended ratio of 250:1, noting widespread state-level initiatives, such as the regulations of the New York State Education Department (NYSED, 2017), that aimed be compliant with ASCA’s recommended ratio.
In spite of advocacy initiatives, variations exist concerning student-to-school-counselor ratios across U.S. states. For instance, as of 2022, 18 states did not mandate school counselor access for students of all grade levels (DeAngelis et al., 2022). Few states strictly follow ASCA’s recommended ratio (e.g., Maine), whereas several other states present much higher ratios (e.g., 800:1 in South Carolina; DeAngelis et al., 2022). Similarly, Savitz-Romer and colleagues (2023) examined educational policies from 33 states and interviewed 30 state education agency leaders. The authors reported that all 33 states required access to school counselors for high school students; however, fewer states instituted policies for school counselor caseloads. Ratio variations may also exist at district and school levels. Based on the national, longitudinal School Health Policies and Practices Study dataset, as of 2016, around 90% of school districts had school counseling coverage; however, less than 20% of school districts specified ratios for all elementary, middle, and high schools (Brener & Demissie, 2018). These discrepancies indicated varied degrees of ratio operationalization and implementation, which may have resulted in inequity among students for access to school counselors (Savitz-Romer & Nicola, 2022). Little is known about potential effects of varied ratios on student outcomes. To this end, national and state datasets may enable robust comparative analyses for ratio effects (or lack thereof).
Ratios and Achievement and Career Outcomes
Student-to-school-counselor ratios have been found to be significantly associated with a range of student outcomes such as college application rates, attendance, discipline, suspension, and American College Testing (ACT) scores (Carey & Dimmitt, 2012; Carey et al., 2012; Carey & Martin, 2015; Carrell & Carrell, 2006; Lapan et al., 2012; Shi & Brown, 2020). The literature offers general support for the relationship between relatively low student-to-school-counselor ratios and positive student outcomes (e.g., Carey & Dimmitt, 2012; Carrell & Carrell, 2006; Lapan et al., 2012; Shi & Brown, 2020). Such positive association has also been detected between lower ratios and postsecondary college enrollment outcomes. For example, based on data from the National Center for Education Statistics’s (NCES) Schools and Staffing Survey, Hurwitz and Howell (2013) analyzed college-going rates in 12 states; their results suggested that adding one school counselor to a school was associated with a 10% increase in students’ college-going rates. Most of the existing studies adopted a dichotomous measure, based on the benchmark of a student-to-school-counselor ratio of 250:1 (ASCA, 2019).
More recent studies on the relationship between the ratio and student outcomes have generated more nuanced understanding, adding complexity to the statistical significance of the ratio’s effect on student achievement. For instance, Goodman-Scott and colleagues (2018) investigated differences in students’ grade point averages (GPAs) in situations with student-to-school-counselor ratios below 250:1 and those with ratios of above 450:1. After controlling for individual student and school differences, Goodman-Scott and colleagues found that lower ratios were associated with higher GPAs in students, but higher ratios were correlated with higher graduation rates. Amid the mixed findings on effects of student-to-school-counselor ratios, educational partners may seek a deeper understanding of the mechanisms at play within ratios ranging from 250:1 to 450:1, because “250 is likely not the magical threshold that yields measurable benefits to students and schools if crossed” (Nicola, 2023, p. 10). Further, Kearney and colleagues (2021) conducted a meta-analysis of 16 studies and detected significant effects for student-to-school-counselor ratios on students’ graduation rate, discipline, and attendance; however, the ratios were suggested to “matter less for academic outcomes other than for nonacademic outcomes” (p. 423). These nuanced findings propelled further investigation of student outcomes with more inclusive coverage of low, medium, and high ratios, considering critical sociocultural characteristics of schools.
Ratios and Race/Ethnicity Composition
Other than nuances of the ratio effects in different student outcome categories, subtleties may exist concerning the ratios in interaction with schools’ race/ethnicity composition. For instance, scholars have asserted that benefits of low student-to-school-counselor ratios are particularly pronounced for underrepresented and minoritized students (DeAngelis et al., 2022; Savitz-Romer & Nicola, 2022). Although ASCA directs regular attention to variations in student-to-school-counselor ratios across states, less empirical research has explored student access to school counselors and potential differences in student outcomes as related to ratios (DeAngelis et al., 2022). In line with state-by-state variation, the notion of school counselor access inequity has been discussed in recent scholarly discourse, referring to inequity among student groups in terms of access to their school counselors and school counseling services (e.g., DeAngelis et al., 2022; Donohue et al., 2022; Savitz-Romer & Nicola, 2022). For example, Donohue et al. (2022) found greater access to school counselors among White students compared with their English learner and Asian student counterparts. Ratios are often highest in schools with students from predominately lower socioeconomic statuses, which often are linked to their minoritized race and ethnicity statuses (Bridgeland & Bruce, 2011). In DeAngelis’s (2022) report based on school districts nationwide, districts with larger non-White student populations were correlated with higher mean student-to-school-counselor ratios. Similarly, schools with higher percentages of historically marginalized and low-income families reported higher student-to-school-counselor ratios (Gagnon & Mattingly, 2016). Similarly, in illustrating sociocultural predictors of student-to-school-counselor ratios, Hilts and colleagues (2023) found that White school counselors reported 1.8 times higher odds of meeting ASCA’s recommended ratio than school counselors of color. Nevertheless, we have identified no research that directly investigated the potential interaction role of student-to-school-counselor ratio and schools’ race/ethnicity composition in affecting student outcomes.
The Current Study
The literature demonstrates that student-to-school-counselor ratios have been investigated in relation to student outcomes. Most studies opted to use ASCA’s recommended ratio of 250:1 to gauge whether or not a district or state provided students with adequate school counselor access (e.g., DeAngelis et al., 2022; Goodman-Scott et al., 2018; Lapan et al., 2012). A preponderance of evidence in support of lower student-to-school-counselor ratios has been derived from the high school level. Further, to the best of our knowledge, no research has been conducted to examine the potential interaction effects between the ratios and schools’ race/ethnicity composition on student outcomes.
The current study was designed to explore differences in graduation, postsecondary enrollment, and achievement outcomes based on student-to-school-counselor ratios and student race/ethnicity composition of schools, using statewide databases supplied by the NYSED. To address the lack of elementary and middle school representation in prior research, we conducted analyses of standardized test scores for all grade levels with available math and English language arts (ELA) scores (i.e., starting in Grade 3), in addition to high school graduation and postsecondary college enrollment rates. To offer a more nuanced understanding of the ratios, we operationalized three ratio groups: low ratio (<200:1), medium ratio (200–300:1), and high ratio (>300:1). Our research questions (RQs) were: 1. Do differences exist in postsecondary enrollment rate and graduation rate based on student-to-school-counselor ratios and schools’ race/ethnicity composition in New York at the high school level? 2. Do differences exist in students’ achievement assessed by ELA and math standardized tests, and by chronic absenteeism, based on student-to-school-counselor ratios and schools’ race/ethnicity composition in New York?
RQ1 focused on outcomes of high schools because graduation rate and postsecondary enrollment data were only available for this level; for RQ2, we included elementary, middle, and high schools, excluding schools with a highest grade level of 2, because standardized test data are only applicable beginning with Grade 3.
Method
To address our research questions, we incorporated NYSED databases capturing student-to-school-counselor ratios and student outcomes from all public schools. To minimize school- and policy-level confounding variables, we excluded charter schools from our analyses to maintain a relatively homogeneous sample. Although the literature shows overall comparable achievement outcomes between charter and traditional public schools, significant differences have been reported in curriculum flexibility, discipline, and parental involvement between charter and traditional public schools (e.g., Cohodes & Parham, 2021; Hamlin & Cheng, 2020). These differences may confound student outcomes, considering our aim to focus on the multivariate effect of ratios and race/ethnicity. We performed two separate two-way multivariate analyses of variance (MANOVA) to investigate the interaction effects of ratio and schools’ race/ethnicity composition on student outcomes, including graduation rate, 4-year college enrollment rate, and math and ELA test results. MANOVA is recommended to detect multivariate effects of independent variables on moderately correlated dependent variables (Tabachnick & Fidell, 2019). MANOVA works best when dependent variables form “a variable system” driven by conceptual evidence (Keselman et al., 1998, p. 363). We sought to detect possible multivariate effect of ratios and race/ethnicity on the interrelated outcomes of graduation and postsecondary enrollment, and achievement and absenteeism, respectively. We grouped graduation rate and postsecondary enrollments (RQ1) because both are overlapped career constructs applicable to high schools (N = 631). We grouped achievement and chronic absenteeism (RQ2) because the literature provides consistent support for their strong association; likewise, both dependent variables were applicable to the same school sample (N = 1507) covering elementary, middle, and high schools.
Databases
We used 2021–2022 school year datasets, which were the most up-to-date at the time of the study, retrieved through the NYSED. Specifically, we accessed multiple publicly available datasets via the NYSED Data Website (NYSED, n.d.), including the enrollment database, high school graduation rate database, and report card database. We also requested the school counselor coverage data from NYSED and were provided with the New York State School Counselor Count (2021–2022) file. The enrollment database provided information about total number of students in each school. The report card database included students’ chronic absenteeism data, statewide standardized exam results, and 4-year college enrollment within 16 months of high school graduation. The graduation rate database offered graduation rates of high schools. The school counselor count dataset captured numbers of full-time school counselors for each school and district. Using ENTITY_CD, a 12-digit code unique for each school, we merged the above referred databases.
Variables and Measures
Student-to-School-Counselor Ratio
We calculated the school-level student-to-school-counselor ratio based on the New York State School Counselor Count (2021–2022) dataset. In grouping the ratios, we considered recent discourse around ASCA’s recommended ratio of 250:1 (Nicola, 2023), the well-established benchmark of 250:1 student-to-school-counselor ratio in the school counseling literature, and feasibility for robust categorical comparison based on the New York State archival data. For example, one statistical prerequisite is to ensure proportional sizes for groups of comparison (Keselman et al., 1998). We thus operationalized the ratios into three groups: (a) low ratio group: <200 students per school counselor, (b) medium ratio group: 200–300 students per school counselor, and (c) high ratio group: >300 students per school counselor.
School Race/Ethnicity Composition
Based on students’ race and ethnicity records achieved in the NYSED system, we categorized schools’ race/ethnicity composition into three groups: high percentage of White students (>75% White students), medium percentage of White students (25%–75% White students), and low percentage of White students (<25% White students). In educational inquiries, racial categorization using 25% increment has been commonly used in demonstrating racial disparities in schools (NCES, 2024; Pew Research Center, n.d.). Schools with >75% White students are often referred as White-predominant schools. We used White student percentage as a criterion group because it appeared to be most consistently measured (versus variation of categorization of students of color) across schools from our databases. In an effort to present the most accurate results and to illustrate nuanced outcome disparities between and among schools, we opted to use >75%, 25%–75%, and <25% White student percentage benchmarks.
High School Graduation and 4-Year College Enrollment Rates
We calculated high school graduation rate as the percent of students in the graduation cohort who earned either a Regents or local diploma in the 2021–2022 school year. Students earn Regents diplomas by obtaining passing scores in their state Regents examinations; they earn local diplomas through appeals with specified exam scores (see NYSED, 2019). We measured 4-year college enrollment using percentage of high school graduates who enrolled at a 4-year postsecondary institution within 16 months of high school graduation. To minimize confounding effects of postsecondary options, we did not analyze data related to attending a 2-year college.
Chronic Absenteeism Rate
We measured chronic absenteeism rate as the percentage of students who were enrolled for 10 or more instructional days, were present for at least one of those days, and were absent for 10% or more of their enrolled days during the 2021–2022 school year.
Achievement
Student achievement was measured using math and ELA standardized tests results available for all schools serving Grades 3–12 in New York State. We used these tests’ scaled scores (spanning approximately 300–600) to determine the student’s performance level, which followed a 4-point scale: Level 1 (below standard), Level 2 (partially proficient), Level 3 (proficient), and Level 4 (exceeds proficiency). Using the performance level of students, NYSED derived the Core Math/ELA Performance Index for each school as an indicator of math/ELA achievement for accountability purpose. It was calculated following the formula:

Denominator in the formula referred to the greater of (a) continuously enrolled students who have valid test scores, or (b) 95% of continuously enrolled students with or without valid test scores. We used the Core Math Performance Index to assess students’ math achievement and the Core ELA Performance Index for students’ ELA achievement at school level.
Data Analysis
Following the approach outlined by Cramer and Bock (1966), we conducted a two-way MANOVA initially on the mean differences to mitigate the risk of inflating the Type I error rate in subsequent ANOVAs and post-hoc comparisons for each research question. For RQ1, our dependent variables were high school graduation and 4-year college enrollment rates, and independent variables were student-to-school-counselor ratio and students’ race/ethnicity. For RQ2, our dependent variables were student chronic absenteeism rate and achievement from schools serving Grades 3–12, based on the same independent variables.
Pearson Correlations, Means, and Standard Deviations for Dependent Variables.
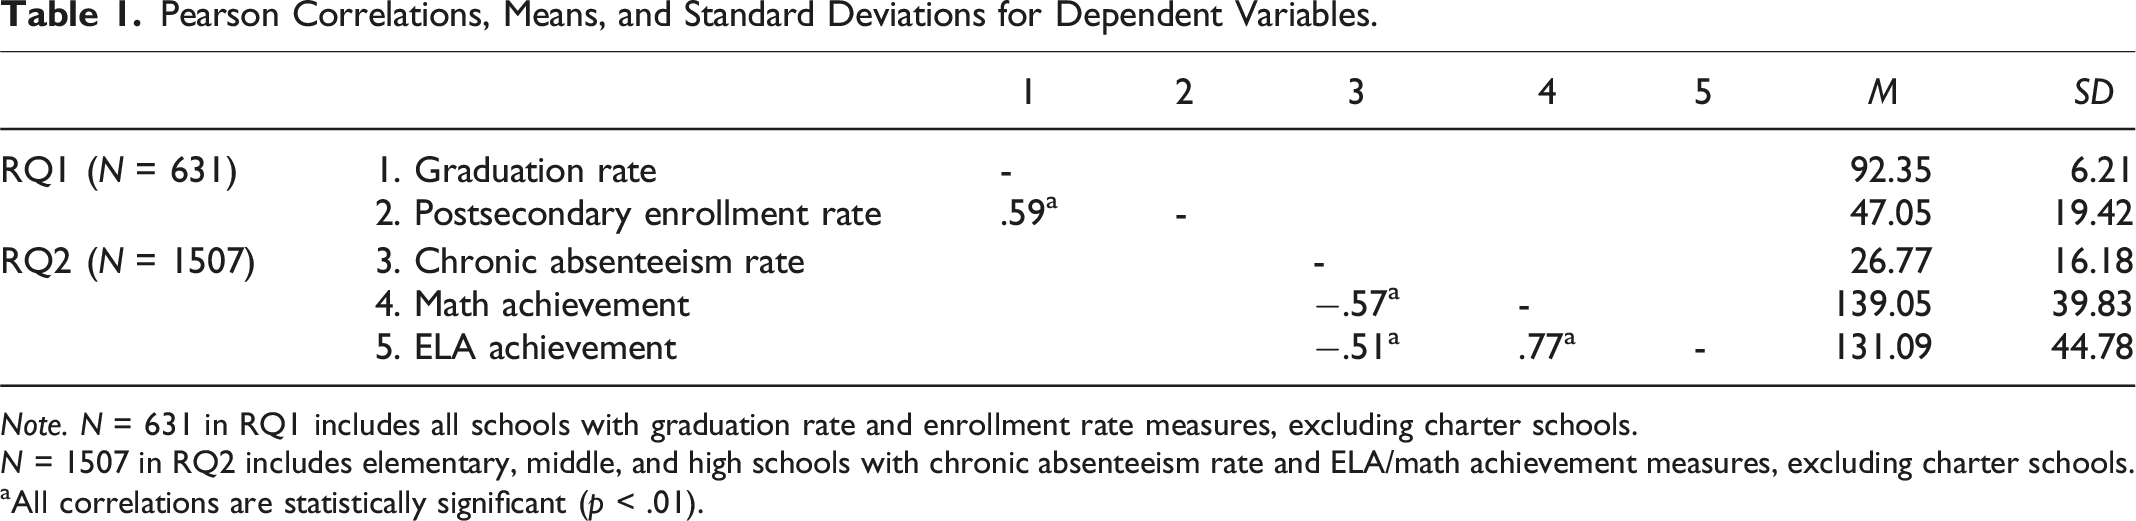
Note. N = 631 in RQ1 includes all schools with graduation rate and enrollment rate measures, excluding charter schools.
N = 1507 in RQ2 includes elementary, middle, and high schools with chronic absenteeism rate and ELA/math achievement measures, excluding charter schools.
aAll correlations are statistically significant (p < .01).
Results
High School Graduation and Postsecondary Enrollment
To answer RQ1, we first performed a two-way MANOVA to test an interaction effect between student-to-school-counselor ratio and race/ethnicity on high school graduation and postsecondary 4-year college enrollment rates. The analysis showed a statistically significant multivariate effect, Pillais’ Trace = .034, F(8, 1244) = 2.65, p < .01. The multivariate effect size was estimated at .017, implying that 1.7% of the variance in a high school’s combined graduation and postsecondary enrollment rates was attributed to the interaction of the ratio and school race/ethnicity composition. We also found that both student-to-school-counselor ratio, F(4, 1244) = 2.88, p < .05, Pillais’ Trace = .018, and race/ethnicity, F(4, 1244) = 27.18, p < .001, Pillais’ Trace = .161, had statistically significant effects on postsecondary enrollment rate and graduation rate, respectively.
Descriptive Statistics for Graduation Rate and Postsecondary Enrollment Rate by Student-To-School-Counselor Ratio and Students’ Race/Ethnicity.
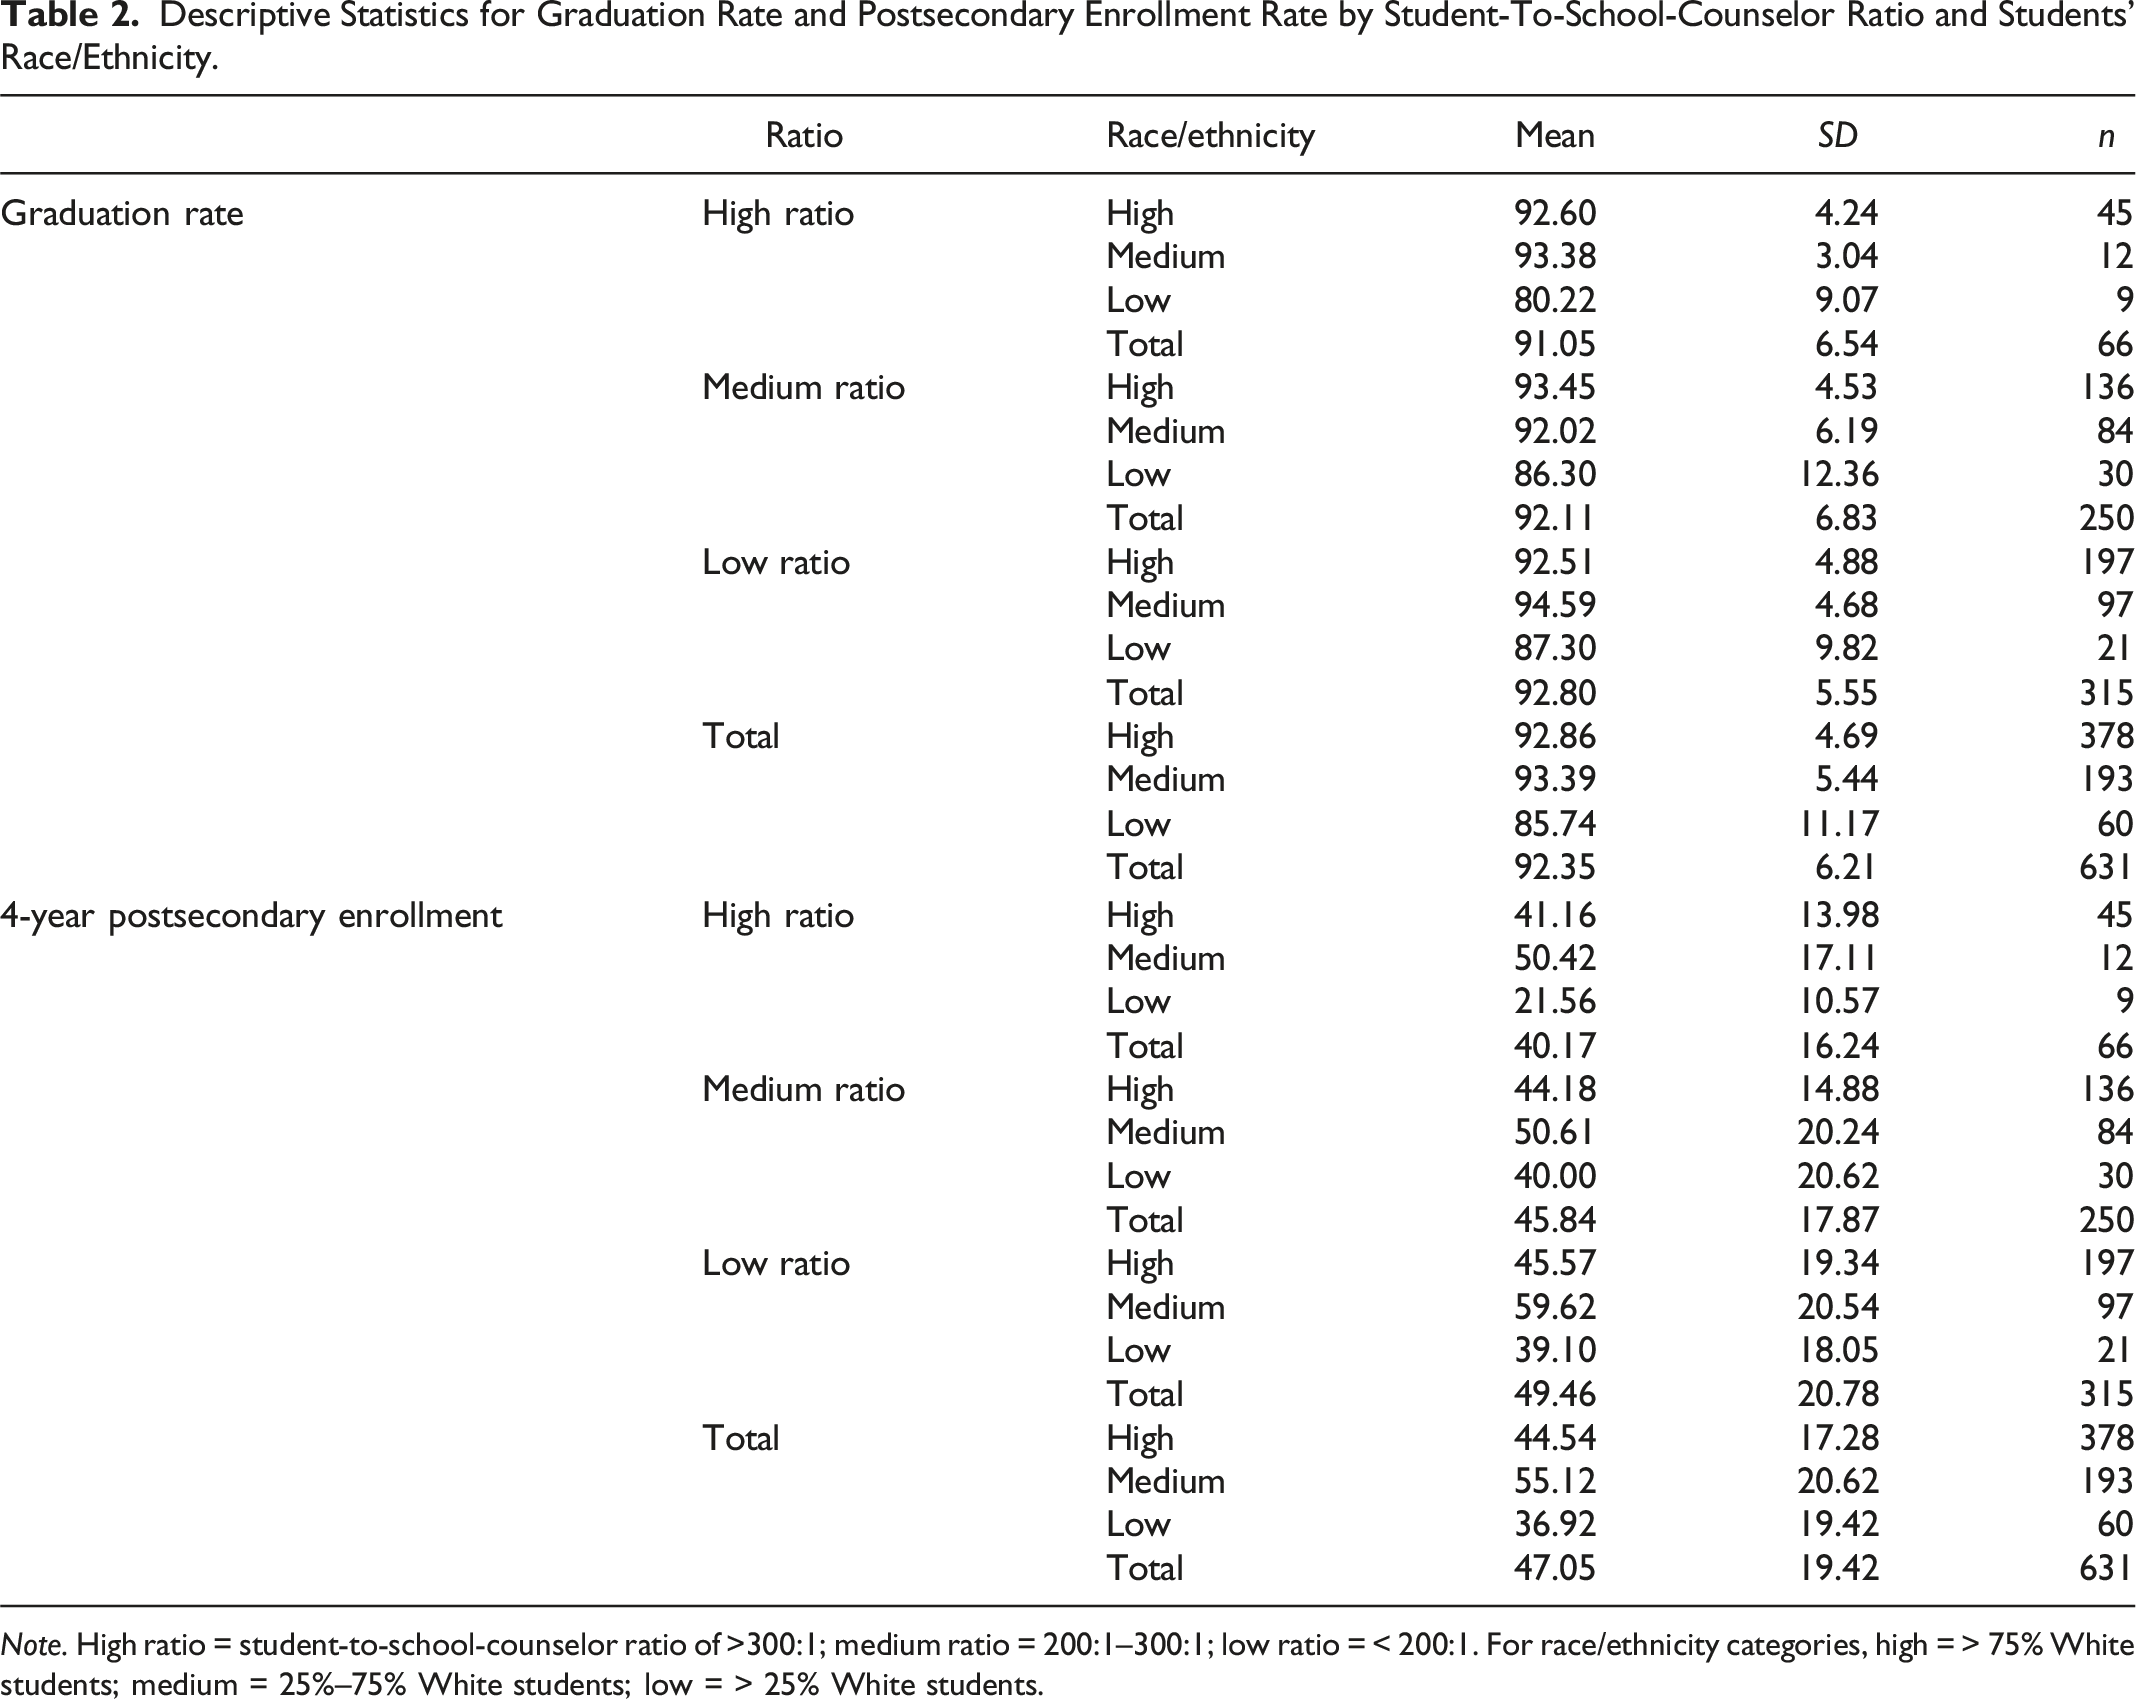
Note. High ratio = student-to-school-counselor ratio of >300:1; medium ratio = 200:1–300:1; low ratio = < 200:1. For race/ethnicity categories, high = > 75% White students; medium = 25%–75% White students; low = > 25% White students.
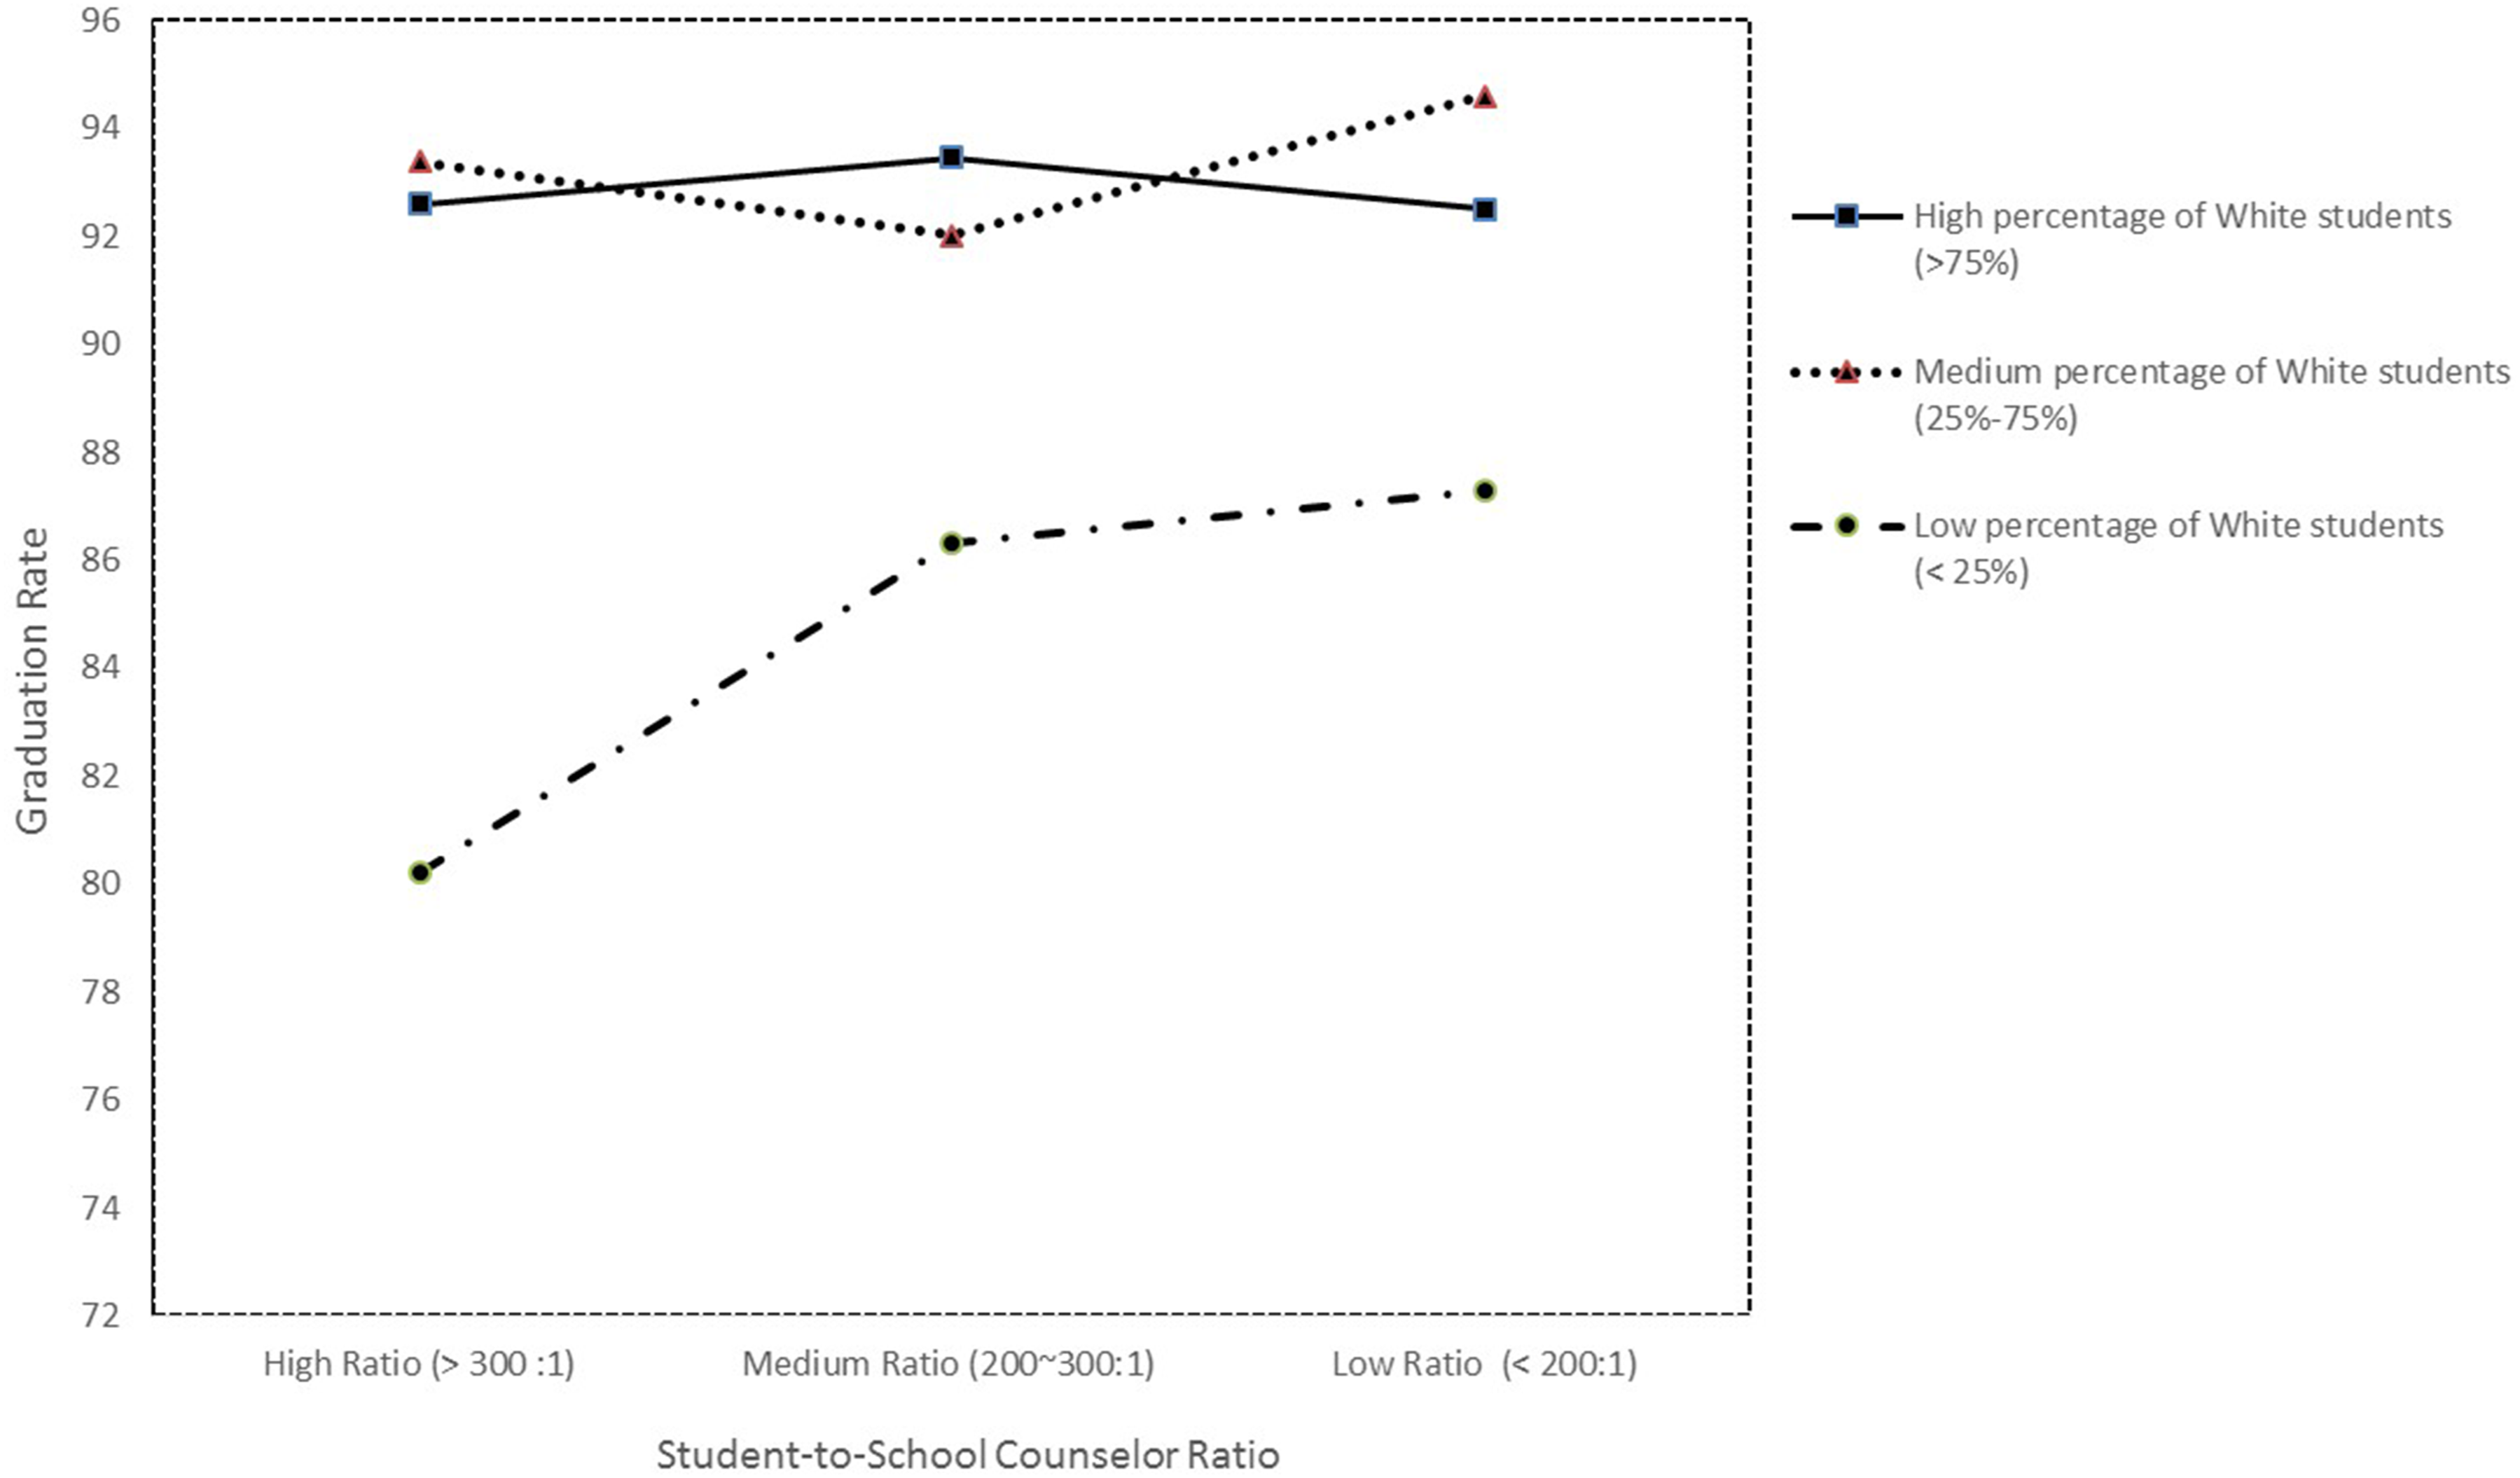
Estimated marginal means for graduation rate by student-to-school-counselor ratio and students’ race/ethnicity.
As shown in Figure 2, postsecondary enrollment rate remained relatively stable across the three ratio groups for schools with a high percentage of White students. However, for schools with a medium percentage of White students, postsecondary enrollment rate of low ratio schools was significantly higher than that of high ratio and medium ratio schools. In contrast, for schools with low percentage of White students, the postsecondary enrollment rate of high ratio schools was significantly lower than that of low ratio and medium ratio schools. Estimated marginal means for 4-year postsecondary enrollment rate by student-to-school-counselor ratio and students’ race/ethnicity.
Achievement and Chronic Absenteeism
To answer RQ2, we conducted a second two-way MANOVA to test an interaction effect between student-to-school-counselor ratio and race/ethnicity composition on chronic absenteeism rates and ELA and math achievement results. This analysis revealed a statistically significant, small multivariate effect, Pillais’ Trace = .015, F(12, 4494) = 1.94, p < .05. The multivariate effect size was estimated at .005, indicating that 0.5% of the variance in the three dependent variables was attributed to the interaction of student-to-school-counselor ratio and students’ race/ethnicity. We also found that both the ratio, F(6, 2994) = 11.73, p < .001, Pillais’ Trace = .046, and students’ race/ethnicity, F(6, 2994) = 45.03, p < .001, Pillais’ Trace = .166, had a statistically significant effect on at least one of the three dependent variables.
Descriptive Statistics for Absence Rate, ELA Achievement, and Math Achievement by Student-To-School Counselor Ratio and Race/Ethnicity.
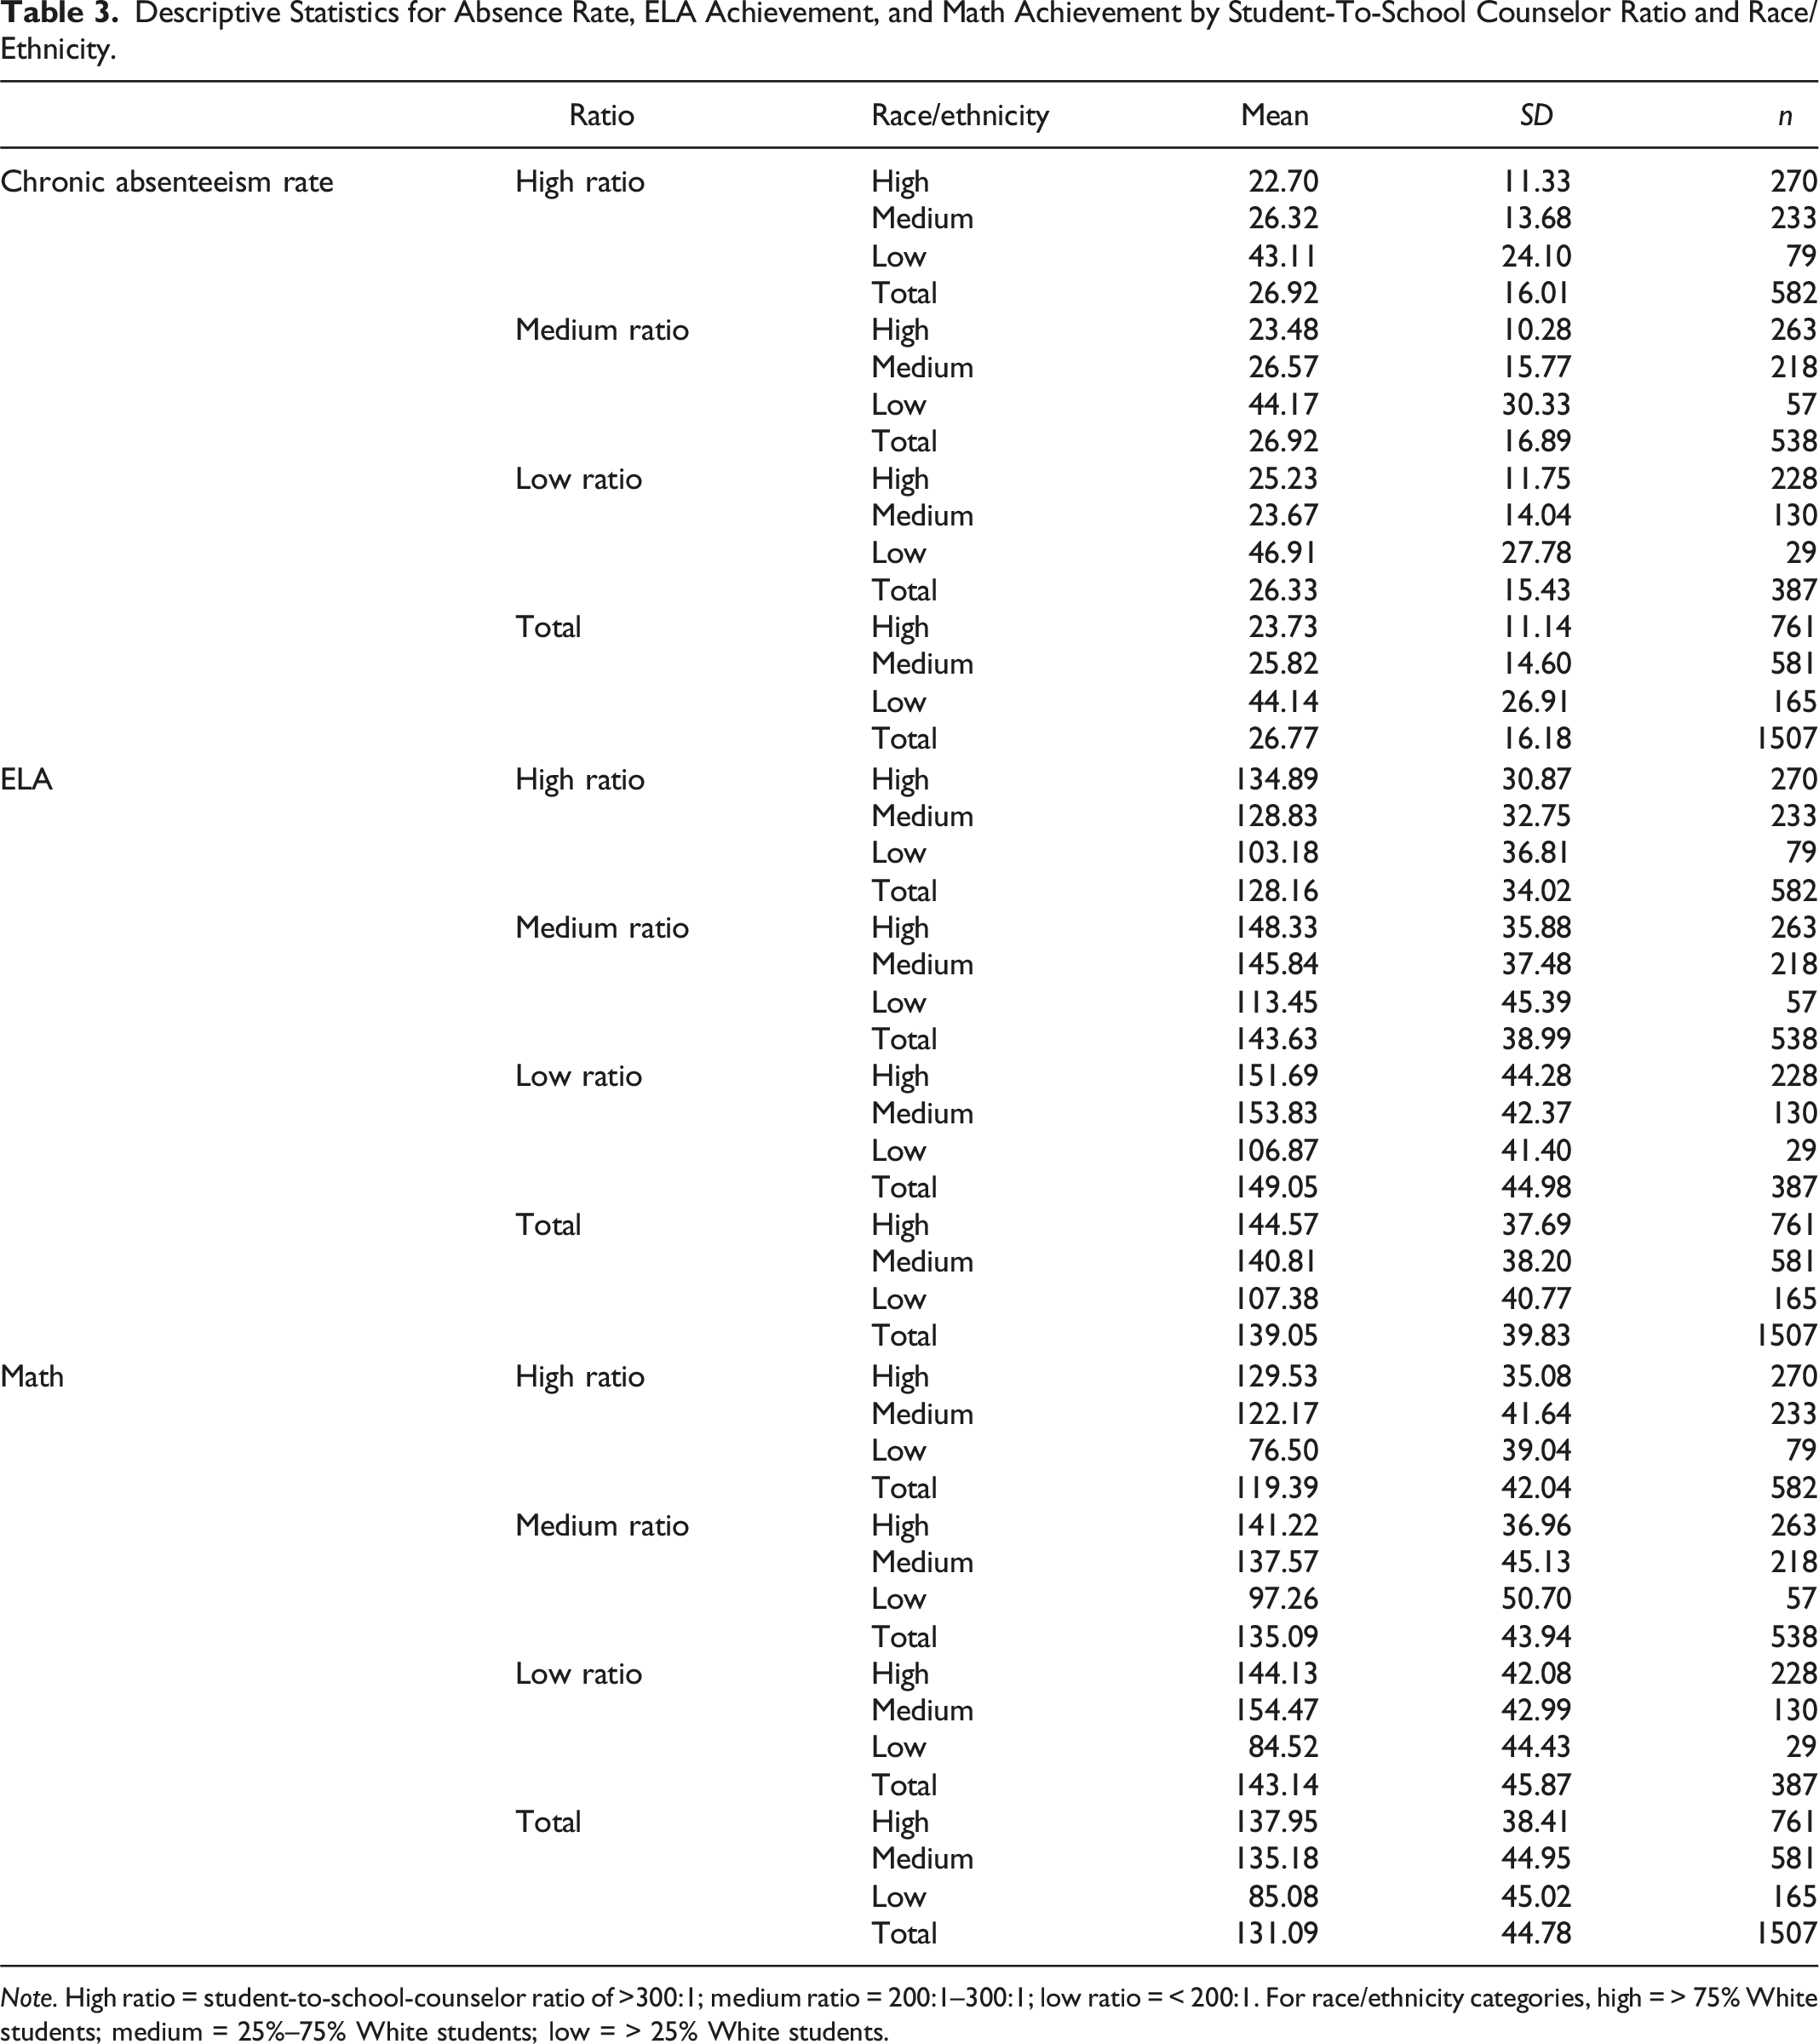
Note. High ratio = student-to-school-counselor ratio of >300:1; medium ratio = 200:1–300:1; low ratio = < 200:1. For race/ethnicity categories, high = > 75% White students; medium = 25%–75% White students; low = > 25% White students.
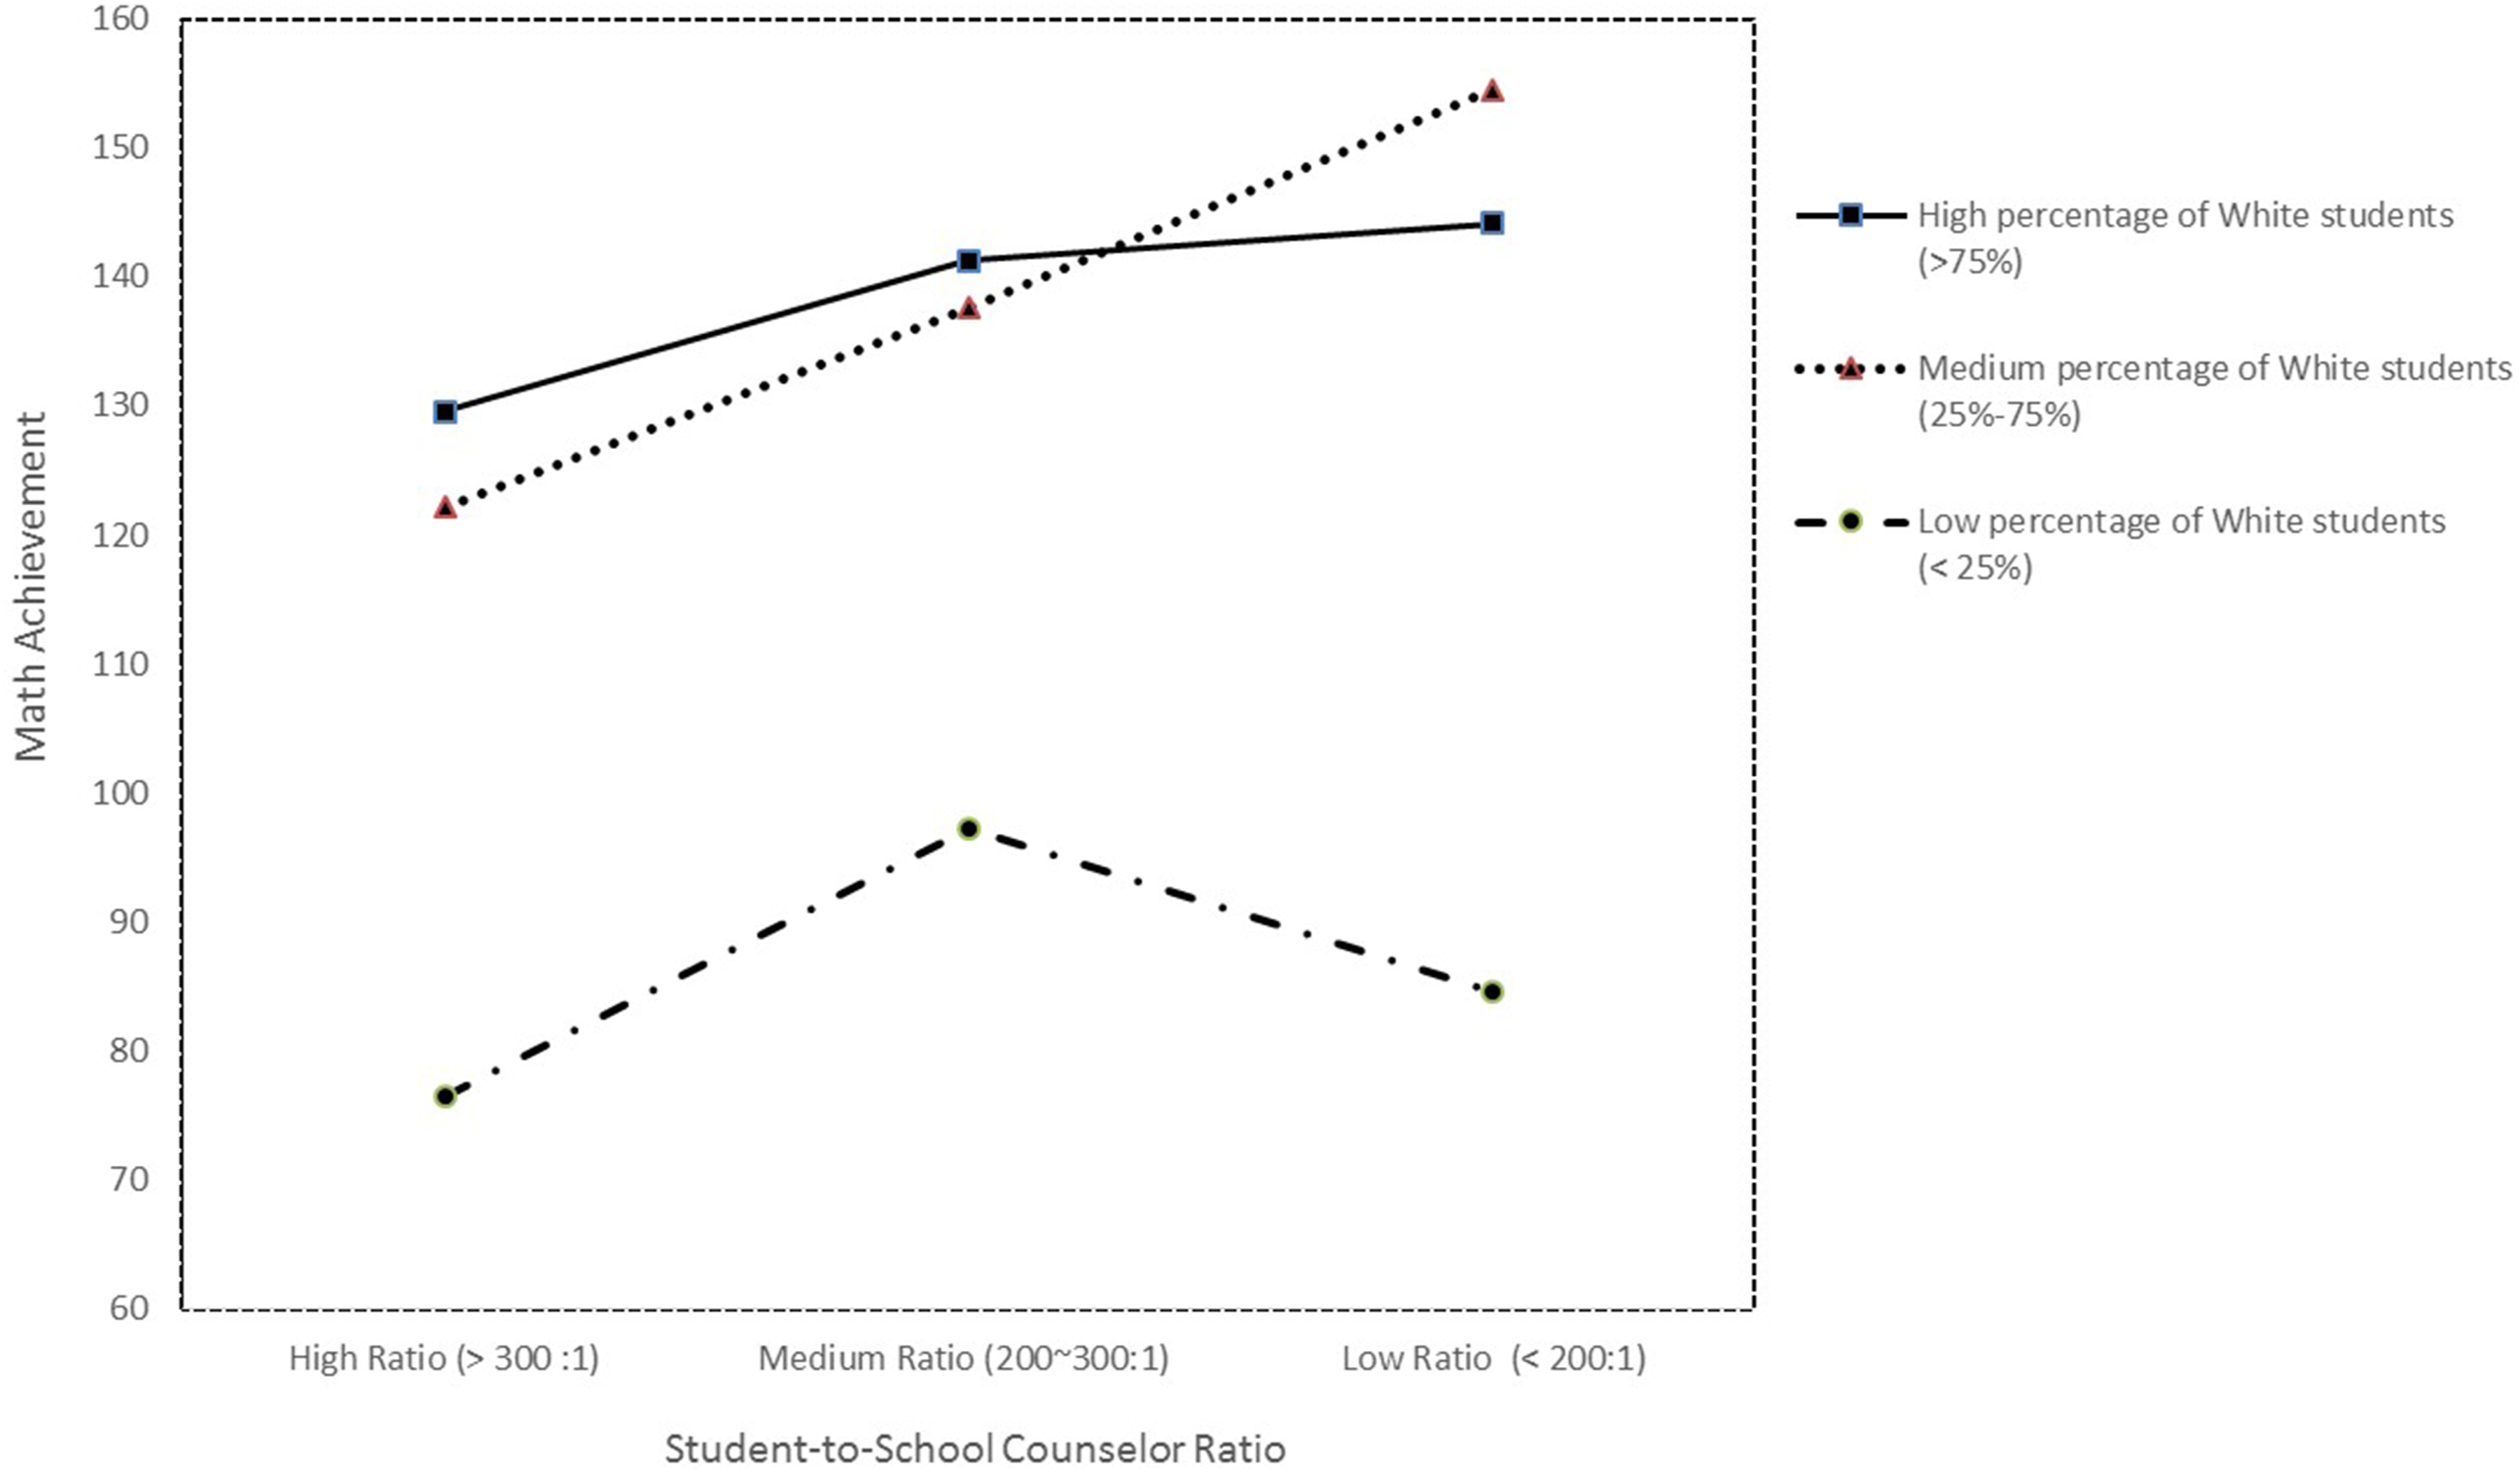
Estimated marginal means for math achievement by student-to-school-counselor ratio and students’ race/ethnicity.
Discussion
Through this study, we tested interaction effects of student-to-school-counselor ratios and schools’ race/ethnicity composition on students’ achievement, graduation and postsecondary enrollment, and absenteeism outcomes. Our MANOVA results indicated statistically significant ratio–race/ethnicity interaction effects on high school graduation and postsecondary enrollment rates (RQ1). The results also showed that the ratio–race/ethnicity interaction effect was significant for the combined variate of chronic absenteeism rate and math and ELA achievement (RQ2). We further engaged with post hoc ANOVA follow-up tests and detected a specific interaction effect on math test outcomes.
Ratios, Race, and Graduation and Postsecondary Enrollment Rates
The existing literature tends to favor low student-to-school-counselor ratios, with evidence supporting positive relationships between lower ratios and superlative career outcomes such as college-going rates (e.g., Hurwitz & Howell, 2013; Kearney et al., 2021). However, Goodman-Scott et al.’s (2018) findings offered an opposite directionality, indicating that higher ratios were correlated with higher graduation rates. Our study expanded the literature and introduced the schools’ race/ethnicity compositions in examining the role of ratios. Overall, our results offered support for an interaction effect between ratios and race/ethnicity compositions on high school graduation and postsecondary enrollment rates. For instance, for schools with a more diverse student body (i.e., <25% White students), lower student-to-school-counselor ratios (<200:1) were associated with higher graduation rate, whereas higher ratio schools (>300:1) exhibited significantly lower means of graduation rate. Similarly, for schools with lower percentage of White students, postsecondary enrollment rate in schools with high ratios was significantly lower than in those with low and medium ratios. Some scholars have claimed that benefits of low ratios may be more pronounced for underrepresented students (e.g., DeAngelis et al., 2022; Savitz-Romer & Nicola, 2022); our results provided empirical support aligning with that claim, with differentiation across outcome variables. Namely, our results suggested that for schools comprising more students of color, increasing school counselor capital may facilitate graduation and career-related outcomes, but such linear trend may not be manifested in achievement. That said, the results should be interpreted with caution, considering how we operationalized ratio groups. Specifically, our high ratio group captured schools with ratios of >300:1, whereas Goodman-Scott et al. (2018) used 450:1 for the high-ratio criterion.
Ratios, Race, and Student Achievement and Absenteeism
Results of this study revealed intricacies concerning effects of student-to-school-counselor ratios on student achievement and chronic absenteeism. Overall, our MANOVA result yielded a significant multivariate effect of ratios and race/ethnicity on students’ math and ELA achievement and chronic absenteeism collectively. This multivariate effect should be interpreted as an effect on the three dependent variables as a combined system. Despite the small effect size, our results provided evidence supporting an interaction effect of ratios and race/ethnicity on students’ achievement and absenteeism collectively.
Our post hoc ANOVA tests advanced the existing understanding of student-to-school-counselor ratios with mixed patterns of effects across different outcome categories and schools of varied racial/ethnic compositions. For instance, our results revealed a significant interaction effect between student-to-school-counselor ratio and race/ethnicity composition on math achievement. This result demonstrated an interesting pattern: For the group with a low percentage of White students, medium ratio (200:1–300:1) schools exhibited significantly higher means in math achievement compared with the other two ratio groups. Similarly, linear trends of mean differences were not manifested across student outcome categories for all race/ethnicity groups. These findings did not completely fit with mainstream studies that showed a significant relationship between lower ratios and more optimal achievement outcomes (e.g., Donohue et al., 2022; Goodman-Scott et al., 2018; Shi & Brown, 2020), nor did they support the recent meta-analytical result for less significant role of the ratios on academic outcomes (Kearney et al., 2021). Instead, our findings seemed to present a middle ground that ratio effects should not be evaluated alone, but jointly with sociocultural characteristics of schools. For schools with low White student percentage, maintaining a medium student-to-school-counselor ratio of 200:1–300:1 may facilitate a positive effect on students’ math achievement. In contrast, in schools with more balanced racial groups (i.e., with 25%–75% White student population), ratios and math achievement may demonstrate a proportional linear trend, with lower ratios being linked to better achievement. These nuanced results deserve further empirical investigation. Again, despite deliberate grouping, our ratio groups were delineated to be somehow proximate to the recommended ratio of 250:1. Further investigation may allow more group categories capturing extremely low and high ends. Future research probing into school counselor roles, activities, and time distribution would be highly valuable, given that ratio is not equivalent to actual amount and quality of school counseling services.
Although we detected a significant multivariate effect of ratios and race/ethnicity on student achievement and chronic absenteeism collectively, our post hoc ANOVA test revealed a nonsignificant difference in absenteeism. Our results did not align with prior findings supporting the association between increasing full-time equivalent (FTE) school counselor positions (thus decreasing ratios) and declined absenteeism in elementary and middle schools in North Carolina (Domina et al., 2022) and between higher student-to-school-counselor ratios and more chronic absenteeism in Arizona, Missouri, and Rhode Island (Donohue et al., 2022). These findings in tandem with our nonsignificant result might indicate that absenteeism is less sensitive to the ratio effect; they may also be attributed to different practices of ratio calculation. For example, Domina and colleagues used 1000 students as the benchmark to track corresponding FTE school counselors, whereas Donohue et al. (2022) relied on public ratios posted for the target states and proceeded with state-based comparison. Given the inconclusive findings, further studies may be conducted around the potential effect of ratios on absenteeism, with consideration of critical sociocultural factors.
Limitations
Our study was not exempt from limitations. First, our small but significant interaction effects deserve some comments. Within the context of the U.S. educational system, a multitude of factors influence student learning outcomes. These factors may include but are not limited to instructional quality, learning environment, individual differences within students, and cultural and social factors. Other aspects, such as parental involvement, technology integration, and extracurricular activities, further contribute to this complex landscape. These factors individually and interactively may contribute to the variance in student learning outcomes. Therefore, we were not surprised to observe small effect sizes. However, we argue that despite small effect sizes, the significant interaction between student-to-school-counselor ratio and schools’ racial/ethnic compositions can hold practical significance and advance theoretical understanding of student learning outcomes.
Second, as noted by previous scholars, using school counselor head counts may not accurately reflect actual student-to-school-counselor ratios (Domina et al., 2022); relatedly, as state departments of education tend to derive the ratios from budget or human resource coding systems, it is possible that noncounseling staff may have been counted as school counselors (Savitz-Romer et al., 2023). As such, ratios documented in the state’s record might have confounded accuracy of our results. Although we were able to locate specific numbers of school counselors hired for the schools as supplied by the NYSED, we were unable to verify specific counselor allocation; namely, our data could not tell whether or not one counselor was allocated for two or more school buildings. Despite efforts to provide more nuanced understanding of ratio effects, our grouping method may have been limiting in understanding mechanisms associated with extremely low or high ratios. Future empirical examination using categories that capture very low and high ends of practical ratios would be valuable.
Implications for School Counseling Advocacy
The literature has consistently emphasized that school counselors often navigate inappropriate role assignments and an ambiguous professional identity (e.g., Belasco, 2013; Carey & Martin, 2015; Hilts et al., 2019). Recent scholarship with more nuanced results, including results of our study, suggests that student-to-school-counselor ratios may only reflect one facet of school counseling resources. How school counselor roles are operationalized in practice may remain unclear or inconsistent and should be discussed in tandem with ratios in future advocacy initiatives. Theoretical premise has been established to recognize school counselors’ unified educator–counselor identity, which comprises interfacing education and counseling responsibilities (e.g., Levy et al., 2024; Levy & Lemberger-Truelove, 2021). However, little guidance has been provided at national, state, and organizational levels as to how school counselors may balance demands falling under their educator and counselor responsibilities. To further illustrate this dilemma, educational partners continuously stress accountability data for school counselor to determine their impact on students’ achievement (e.g., Brigman et al., 2017; Carey & Martin, 2015); nevertheless, in the time of COVID-19, schools nationwide have urged for increased delivery of mental health services (Alexander et al., 2022; NCES, 2022). Such dilemmas may have contributed to our different outcome patterns associated with same-ratio delineation. For example, if schools recommend school counselors to focus on social/emotional initiatives, less time and effort would be available for students’ academic and career endeavors, although the student-to-school-counselor ratios may remain the same.
Relatedly, our study shed light on contextualization of student-to-school-counselor ratios in practice and from an advocacy lens. Although our results generally were consistent with previous findings, they call for further attention to different school contexts, such as race/ethnicity composition of schools and various domains of student outcomes. We reinforce ASCA’s consistent efforts to call for data-informed practice when it comes to implementing recommended or low student-to-school-counselor ratios. Howver, incorporating school needs assessments and analysis in guiding school/district policies is important while navigating funding resources, rather than tokenizing a ratio. As Burkard and colleagues (2012) commented, comprehensive school counseling programs were implemented in an uneven manner across states, with unclear evaluation methods of programs and individual services. In a similar vein, Carey and Dimmitt (2012) noted that not all school counseling activities equally impact student and school-wide outcomes. Such implementation inconsistency and variations may confound ratio effects on student outcomes. Follow-up implementation checks may bring forth ratio analyses and accountability, while being undertaken as part of accountability efforts.
Existing policies feature an emphasis on ensuring school counselor coverage for schools/districts; however, little is known about students’ actual access to school counselors. To this end, if no such access was established, the ratio may not have an effect on all students’ outcomes. Thus, we echo previous calls that how and whether students utilize school counseling services would be an imperative area of exploration (Belasco, 2013; Brasfield et al., 2021; Carey & Dimmitt, 2012). As an example, in Belasco’s (2013) study, students’ use of college-related services was significantly associated with the percentage of 4-year college enrollment. Equitable access to school counselors may be incorporated in tandem with implementing existing school counseling programs, given that ratio is not equivalent to students’ access to school counselors (Donohue et al., 2022). Access inequity has been especially conspicuous for racially and socioeconomically disadvantaged communities (Savitz-Romer & Nicola, 2022). School/district leaders may make ratio allocation decisions at their discretion considering benefits in different outcome categories linked to the ratios.
Conclusion
The present study sought to examine interaction effects of student-to-school-counselor ratio and schools’ racial/ethnic composition. Two-way MANOVA results suggested statistically significant interaction effects on students’ graduation and 4-year college enrollment rates, and on math achievement. The results provided implications for contextualization of the student-to-school-counselor ratio and continued advocacy for equity of access to school counselors and school counseling programs by all students.
Footnotes
Acknowledgement
We acknowledge the support to this study from the American School Counselor Association through a 2023 research grant.
Authors’ Note
The study was based on datasets retrieved from or provided by the New York State Education Department.
Declaration of Conflicting Interests
The author(s) declared no potential conflicts of interest with respect to the research, authorship, and/or publication of this article.
Funding
The author(s) received no financial support for the research, authorship, and/or publication of this article.