
Abstract
Although previous studies have examined the influence of school counselor ratios on student outcomes for various states, no prior studies of counselor ratios focused on schools in Texas. Utilizing data from the National Center for Education Statistics, the Stanford Education Data Archive, the U.S. Census Bureau, and the Texas Education Agency, we found that lower ratios were significantly associated with student achievement and dropout and graduation rates in Texas.
Introduction
School counselors play a critical role in supporting students’ academic progress and mental health. However, budget constraints often force schools to assign large caseloads to counselors, and student-to-school-counselor ratios are often well over 250:1, the ratio recommended by the American School Counselor Association (ASCA, 2019). Policymakers and educational leaders do not have sufficient evidence related to how larger or smaller student-to-school-counselor ratios shape the nature of school counselors’ work or their impact on student outcomes (Goodman-Scott et al., 2018). Although previous studies have examined the influence of school counselor ratios on student outcomes for various states (e.g., Donohue et al., 2022), research that examines both academic achievement and attainment over an extended period is lacking. And no prior studies of school counselor ratios have focused on schools in Texas. Utilizing data from the Texas Education Agency, the National Center for Education Statistics, the Stanford Education Data Archive, and the U.S. Census Bureau, we found that lower school counselor ratios are significantly associated with student achievement and with dropout and graduation rates, but low-income students and students of color have inequitable access to schools with low counselor ratios. These findings have important implications for school leaders and researchers, and we discuss these in the final section of this article.
Brief History
In 1955, Hoyt, who also worked as a school counselor, developed a conceptual framework for school systems to consider when determining their student-to-school-counselor ratio. His theory rests on three basic assumptions: (a) a school counselor has a master’s degree in school counseling, (b) teachers and administrators actively support the school counseling program, and (c) the school counseling program is an organized part of a typical functioning school system (Hoyt, 1955). Hoyt stipulated that school counselors should spend a minimum of 50% of their time in direct contact with students. This framework allowed researchers to begin studying student-to-school-counselor ratios (Brown & Hathaway, 1969; Hollis & Isaacson, 1962). Such research assisted in institutionalizing the role of the school counselor (Armor, 1969); however, the research made clear that school counselor availability to each student determined the value of counseling services (Boser et al., 1988). Based on the importance of school counselor availability and the counseling services they provide, and seeing a growing gap in student-to-school-counselor ratios (Fox & Swickert, 1998, as cited in Hobson et al., 2000), organizations made efforts to increase the number of highly qualified school counselors (Hobson et al., 2000) and researchers investigated how to optimize counselors’ activities and time (Biggers, 1971; Fairchild & Zins, 1986; Hays, 1972; Hutchinson et al., 1986; Rash, 1970; Sweeney, 1964).
Considering the research, professionals focused their efforts on programming that emphasized developmentally appropriate school counseling activities or tasks (ASCA, 1974; Gysbers & Henderson, 1988) leading to changes in school counseling preparation and practitioner models (Hayes, et al., 1996). Organizations developed practitioner models such as the ASCA National Model (ASCA, 2005, 2019) and state models such as the Texas School Counselor Association (TSCA) model (Texas Education Agency [TEA] 2004, 2018) that evolved over time to assist practicing school counselors in optimizing and clarifying school counselors’ role, activities, and time. These models provided prescriptions for school counselors that, if followed, would lead to better student outcomes for the population served. An example of the guidelines promoted for the Texas model is that school counselors work with a student-to-school-counselor ratio of 350:1 (TEA, 2018).
Previous Research
By the late 2000s, researchers had identified up to 44 U.S. states with written and varied school counseling program models (Martin et al., 2009). Despite the variation in models, researchers have conducted studies across various states and found that lower student-to-school-counselor ratios are correlated with positive student outcomes (Goodman-Scott et al., 2018), with limited exceptions (Reback, 2010). From 2012 to 2022, using regression analysis to analyze primary and secondary data, researchers have examined the impact of student-to-school-counselor ratios on student outcomes, finding positive results (Bryan et al., 2022; Carey, Harrington, Martin, & Hoffman, 2012; Carey, Harrington, Martin, & Stevenson, 2012; Goodman-Scott et al., 2018; Hurwitz & Howell, 2014; Lapan, Gysbers, et al., 2012a; Lapan, Whitcomb, & Aleman, 2012; Mulhern, 2020). For example, in 2020, Mulhern investigated the impact of school counselors on student outcomes in K-12 schools in Massachusetts. Using several regression analyses, Mulhern measured the relationship of school counselors’ caseloads or ratios in relation to academic and college-going outcomes. The study found not only that smaller ratios (e.g., 250:1) are beneficial for students, but that “hiring an additional counselor in the average Massachusetts high school will increase high school graduation and four-year college attendance” (p. 30). Bryan et al. (2022), using regression analysis in a national study, examined school counseling college-going culture and secondary education students’ college decisions. The researchers found that when school counselor ratios were 250 or less, school counselors were able to make more points of contact with students that resulted in increased and enhanced college application rates and financial aid assistance.
These studies demonstrate the diversity of the impacts of student-to-school-counselor ratios on student outcomes in various states using regression analysis. Although these previous studies have largely substantiated the positive impact on student outcomes when ratios are low for certain states, the national average caseload of students for school counselors greatly exceeds both national (i.e., 250:1; ASCA, 2019) and state (e.g., 350:1; TEA, 2018) recommendations (ASCA, 2021). Indeed, several states, including Texas, have effectively ignored these recommendations (Hurwitz & Howell, 2014). The limited research includes some positive findings, but researchers have emphasized that further research is needed in more states, particularly to examine the effects of student-to-school-counselor ratios on specific student outcomes such as academic and college preparedness (Cumpton & Giani, 2014; Greater Texas Foundation, 2016; Reback, 2010). The COVID-19 pandemic has added additional needs related to student academic achievement and mental health (U.S. Department of Education, 2022) and expanded the need for a greater research base on optimal school counselor staffing levels. The present study is a significant step toward addressing this research need.
Theoretical Framework
Student-to-School Counselor Ratios
Our theory of action posits that lower student-to-school-counselor ratios will help all counselors to be more effective, which will contribute to desirable student outcomes such as improved test scores and high school graduation rates. While recognizing the counselor staffing recommendations of professional associations such as TSCA, our study draws from the Bronfenbrenner (1977) ecology of human development theories that emphasize, for instance, the environment of factors in which a student exists as key to impacting the student’s effective engaging in a school and community context. This framework was also used in previous student-to-school-counselor ratio studies (e.g., Goodman-Scott et al., 2018). In the current study, we explore various student environmental factors such as socioeconomic status, culture, classroom ratio, and challenges associated with changes in district; we also consider the size of districts. Bronfenbrenner described these areas as key aspects nested in major systems influencing student development. Last, our study relies on Hoyt’s (1955) conceptual framework that emphasizes the basic assumptions met by schools with a school counseling program to ascertain an optimal caseload for school counselors. These assumptions are that school counselors have, at minimum, a master’s degree; the school counseling program is supported by teachers and administrators; the school counseling program is a structured, normal part of a functional school system; and the school counselor spends at least half of their working time in direct contact with students.
These assumptions align with state agency regulations in Texas. According to the Texas licensing agency, school counselors must successfully complete a school counselor preparation program and hold at least a 48 hour master’s degree (TEA, 2017). According to Chapter 33 of the Texas Education Code, a certified school counselor and their school counseling program is a central part of a support system for students, in conjunction with teachers and administration (Texas Education Code, 2021). Last, as explained in Texas Senate Bill 179 (2021), certified school counselors in Texas are expected to spend 80% of their time focused on students as part of their comprehensive school counseling program.
Rationale and Purpose
The purpose of this study was to examine the relationship between student-to-school-counselor ratios and students’ academic and graduation outcomes in Texas. Although previous studies have examined the influence of school counselors on student outcomes for some states, the state of Texas has yet to examine these factors, despite the recommendations of ASCA and the TSCA model to maintain relatively low student-to-school-counselor ratios (e.g., 350:1; TEA, 2018). Moreover, as a result of Texas budgetary issues, school districts reduced school counselor positions in 2011–2012, resulting in continual increases in ratios that exceed the 350:1 recommendation of the TSCA Model promoted by the TEA (Cumpton & Giani, 2014). Recognizing the important role of secondary education school counselors since 2016, the Greater Texas Foundation issued a call for research and policy inquiries to examine the effects of the alarming increases in student-to-school-counselor ratios on student outcomes in Texas. Student outcomes of interest include student standardized exam scores, high school dropout rates, and graduation rates. We focused on these specific outcomes based on research showing the varied roles of counselors, including supporting academic success and monitoring students’ coursework and graduation requirements (Kearney et al., 2021; Savitz-Romer et al., 2021). We explored outcomes for student subgroups given the emphasis of school counselor roles to target higher need students (Blake, 2020). The following research question guided our study: To what extent are student-to-school-counselor ratios associated with student standardized exam scores and high school dropout and graduation rates?
Although our study focused on Texas, the results have implications for school counseling programs nationally. Our empirical approach, described below, links changes in district-level student-to-school-counselor ratios to changes in student outcomes in the same district, over time, for all districts in Texas. To provide a sense of how the context in Texas differs from that of other states, Figure 1 shows the student-to-school-counselor ratios for each state and that state’s child poverty rate, averaged over the most recent 5 years. Texas has slightly higher child poverty rates and larger student-to-school-counselor ratios than many other states; however, the state is not a significant outlier on either metric. Because Texas is a racially and economically diverse state with a wide array of rural, suburban, and urban settings, our findings generalize to many other state contexts. Student-to-School Counselor Ratios by State as a Function of Child Poverty Rate, 5 Year Average from 2014–2015 to 2018–2019. Source. National Center for Education Statistics and U.S. Census Bureau Small Area Income and Poverty Estimates.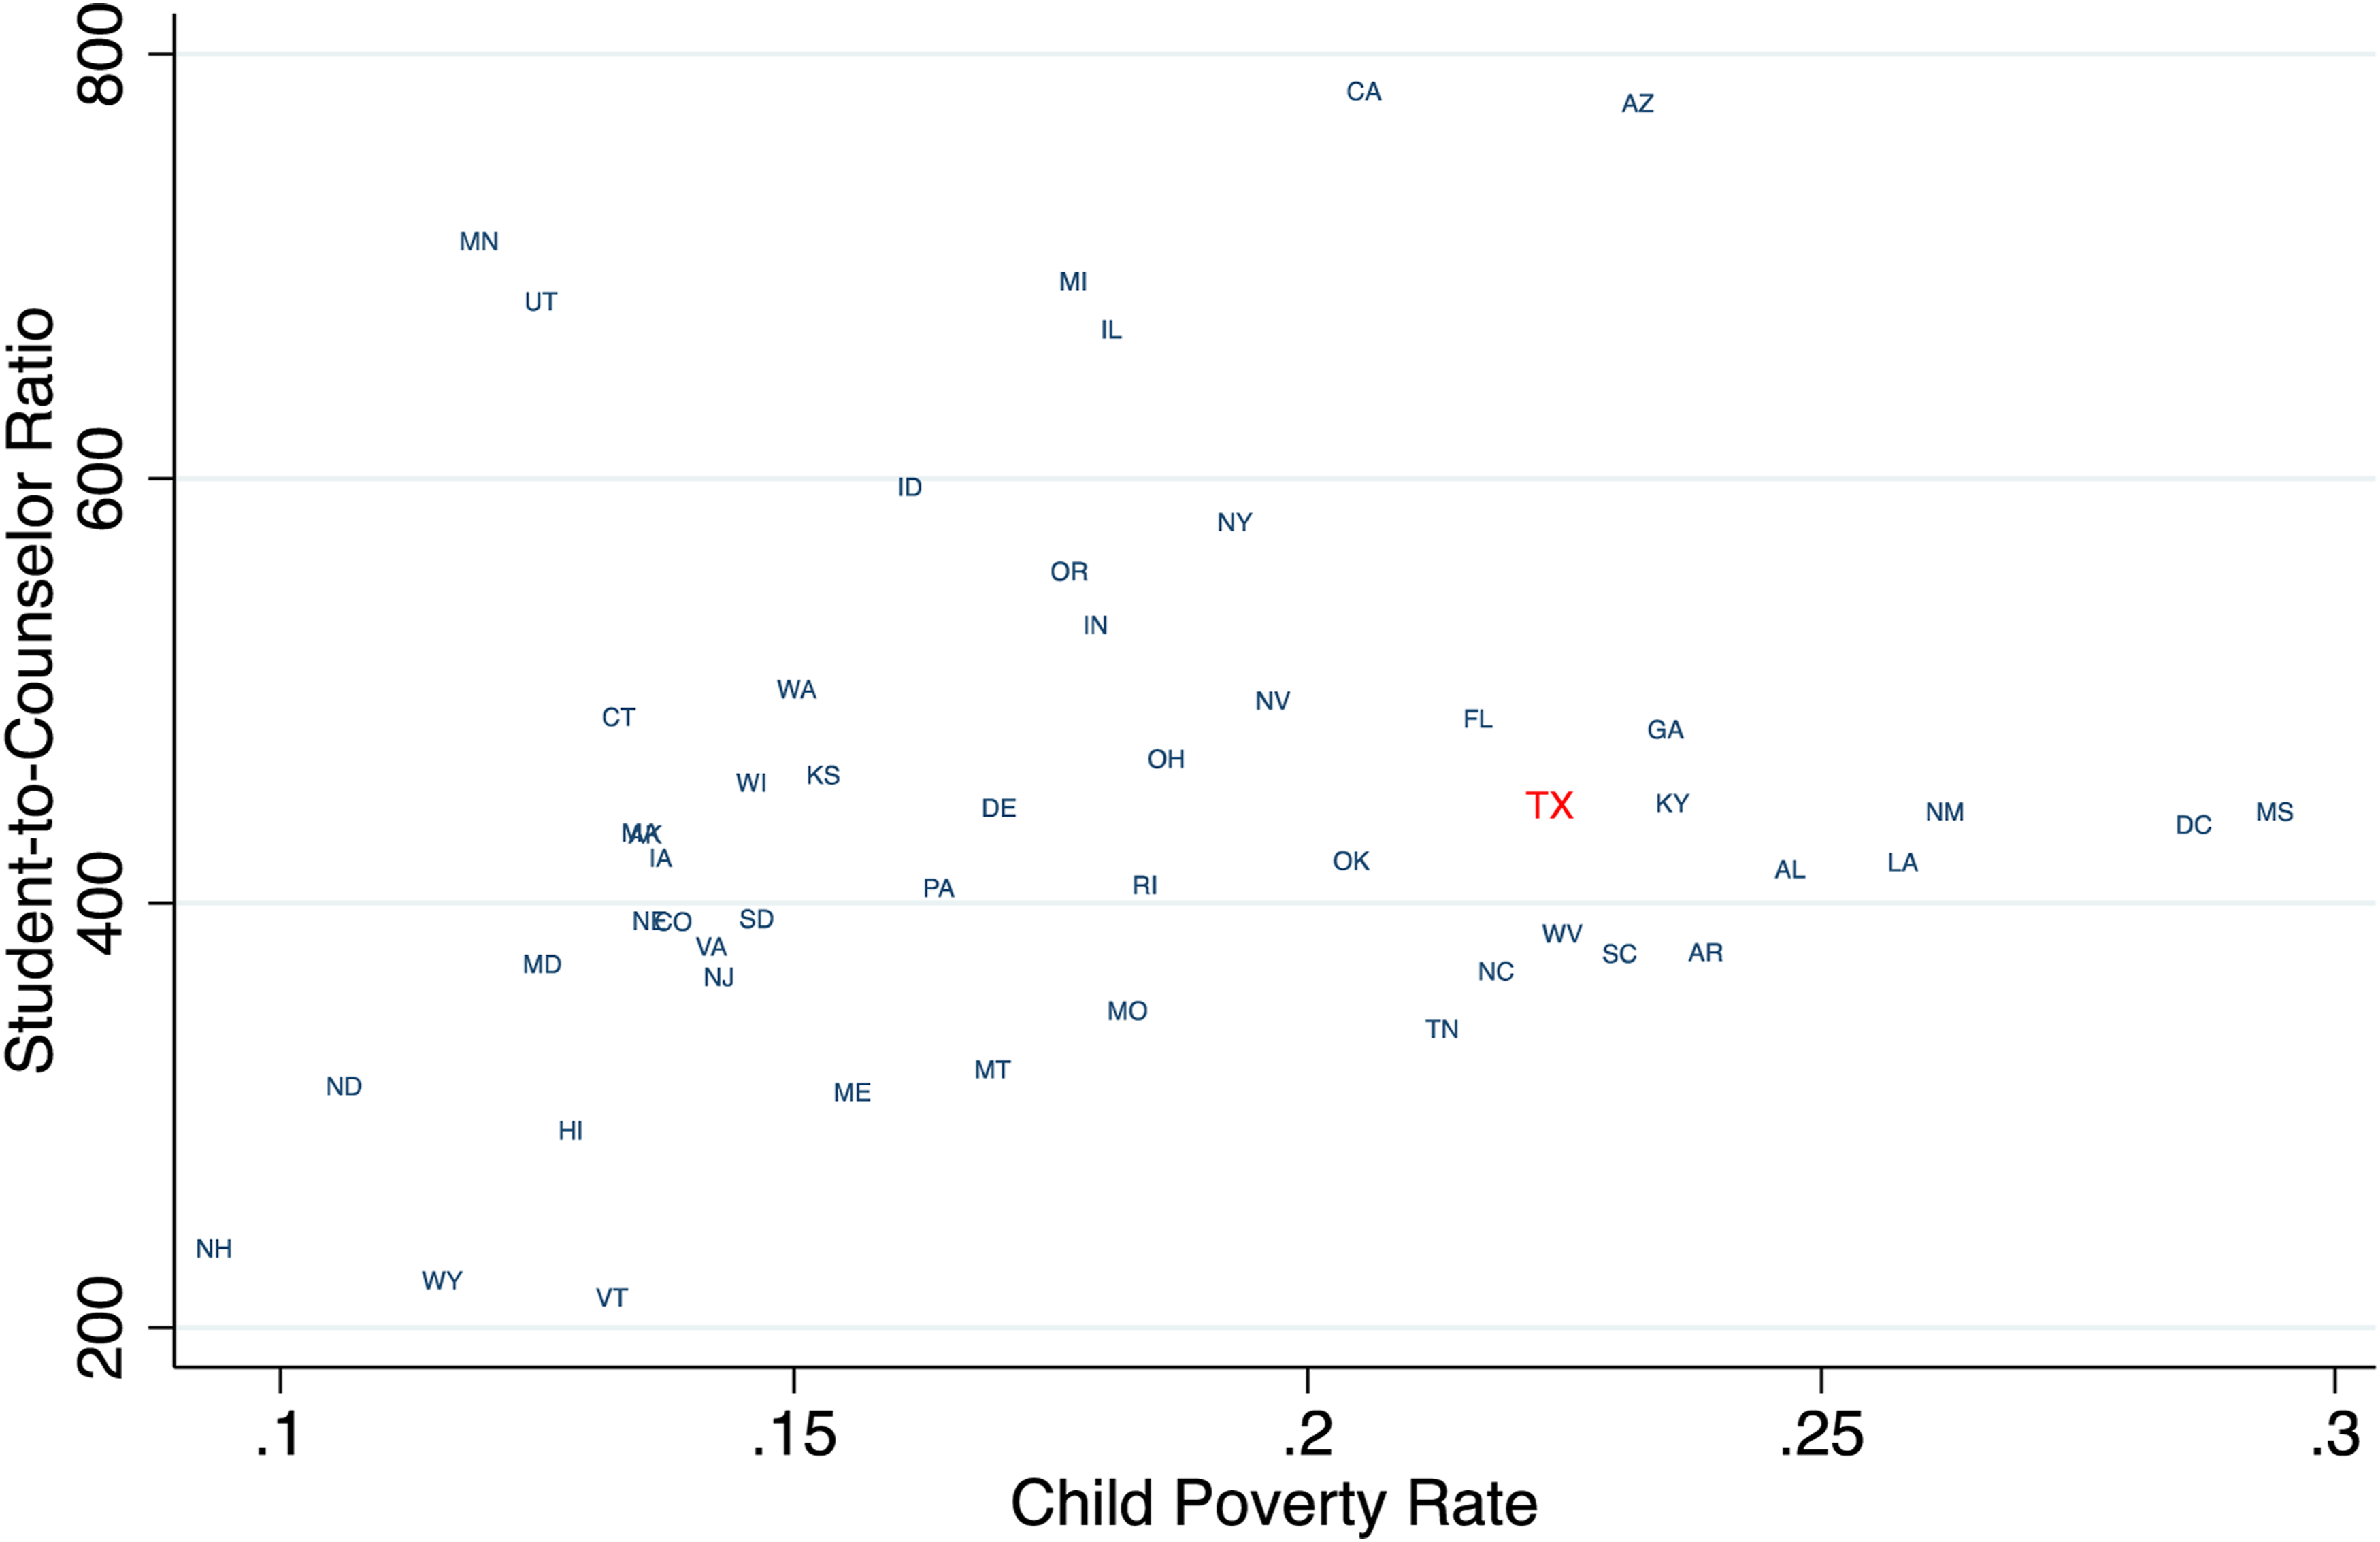
Method
We combined data from the National Center for Education Statistics (NCES), the Stanford Education Data Archive (Reardon et al., 2016), the U.S. Census Bureau, and the TEA. NCES data included district-level information for school years 1994–1995 to 2018–2019, such as the number of school counselors and teachers in each district in each year, student enrollment, and the percentages of students eligible for free or reduced-price lunches and identifying in various racial/ethnic categories. The Stanford Education Data Archive included data on standardized test scores and test score achievement gaps among students who identify as Black, Latinx, and White, from 2008–2009 to 2014–2015 for Grades 3 through 6. TEA data provided information about high school completion for school years 2002–2003 to 2018–2019. Finally, U.S. Census data provided annual child poverty rates for each school district.
Sample and Variables
Counselor Staffing Variables
We constructed several measures of counselor staffing levels. First, we calculated the number of students per school counselor in each district in each year. As educational outcomes result in part from cumulative inputs over several years, we calculated not simply the current ratio of students to counselors, but the average of this ratio over the current year and the prior three years. This approach allowed us to examine, for example, how a student’s likelihood of dropping out of high school is related to counselor staffing levels during the four years they spend in high school. We also calculated the inverse as the number of counselors for every 250 students. Districts with values below one employ fewer school counselors per student than recommended by ASCA, while those with values equal to or greater than one meet the ASCA recommended level of 250 students per school counselor. To simplify the interpretation of our results, we placed counselor staffing variables into five categories: (a) fewer than 350 students per counselor, (b) 351–400, (c) 401–450, (d) 451–550, and (e) 551 or more students per counselor. In alternate models, we transformed the value to a standardized measure with a mean of zero and a standard deviation of one. We also experimented with other groupings and continued ratio measures, and we reached generally similarly conclusions regardless of how districts are grouped.
Student Outcome Variables
The Stanford Education Data Archive provides achievement data in various forms including grade-level equivalencies, scaled scores, and growth scores. Students in Texas have taken the Texas Assessment of Knowledge and Skills (TAKS) from 2002–2003 to 2010–2011 and the State of Texas Assessment for Academic Readiness (STAAR) from 2011–2012 onwards. We used the scaled scores for 2008–2009 to 2014–2015 and standardized the values within the grade level for each year to a distribution with a mean of zero and a standard deviation of one. This allowed us to assess the relationship between student-to-school-counselor ratios and standard deviations of student achievement, a metric that is comparable across extant studies. We used annual scaled scores (rather than growth scores) because our analytic approach, described below, compared changes in achievement within the same district over time using district fixed effects. To streamline presentation of our results, we report Grade 5 math achievement, but our results for other grades and for reading follow similar patterns. We report results for overall scores and for Grade 5 racial achievement gaps available in the SEDA data, comparing students who identify as Black, Latinx, and White.
The TEA calculates 4 year graduation rates by tracking Grade 9 cohorts over a 4 year period. For example, the graduating class of 2018-2019 for a school district is defined as the number of students who first began Grade 9 in Texas public schools in 2015-2016 (or who transferred into the cohort) and who, by spring of 2019, had either graduated, continued high school, passed an equivalency exam, or dropped out (TEA Division of Research and Analysis, 2019). The TEA tracks these outcomes for all students, disaggregating the results by race/ethnicity and enrollment classification, for school years 2002–2003 to 2018–2019. For graduation and dropout rates, we tested models for all students and for student subgroups. 1 To streamline results, we report outcomes for graduation results for economically disadvantaged students and briefly summarize results for all other student subgroups. Results for graduation and dropout rates are based on all years of available data, from 2002–2003 to 2018–2019, whereas our results for test scores are based on years of available test score data, from 2008–2009 to 2014–2015.
Summary Statistics by Student-to-School Counselor Ratio Categories, 2002–2003 to 2018–2019.

Note. Counselors per 250 students refers to the number of full-time-equivalent counselors for every 250 students. Averages are weighted by district enrollment other than the enrollment variable.
Data Analysis
We estimated ordinary least squares regressions, predicting a set of student outcomes on various measures of per-student school counselor staffing levels. We used an approach known as school district fixed effects that allowed us to compare changes in counselor ratios over time in the same school district to changes in student outcomes in the same district. The approach rules out any time-invariant threats to validity that may have biased our results. For example, districts that generally have a stable workforce, a district wide college-going culture, or strong long-standing community partnerships may hire more counselors per student and have greater student outcomes, but the higher counselor staffing levels are not necessarily the cause of higher student outcomes. These unobserved (but time-invariant) factors would upwardly bias our estimates, making the relationship between counselor staffing rates and student outcomes appear stronger than the true value. Conversely, a district with long-standing challenges with low achievement and high school dropouts may generally staff their schools with greater numbers of counselors per student. By comparing changes within districts over time, we controlled for time-invariant factors that may have biased our estimates. We also controlled for time-varying factors including the percentage of students living in poverty, the percentage of students who identify as people of color, the number of teachers per student, and the log of district enrollment (Angrist & Pischke, 2009). We use the log of enrollment to account for the skewed distribution resulting from the large number of small districts in the state, and the much smaller number of large districts. We estimated the following form of the model, using subscripts for district d and year t:
Results
Relationship Between Student-to-School Counselor Ratios and Student Outcomes.

Note. Regressions are weighted by district enrollment size. Covariates are mean-centered, so the constant corresponds roughly to the statewide mean.
+p < 0.010, *p < 0.050, **p < 0.010, ***p < 0.001.
The next three columns of Table 2 show results for Grade 5 math for all students and racial achievement gaps for Black, Latinx, and White students. The first coefficient in Column 3 suggests that districts with student-to-school-counselor ratios of 350 or lower have math achievement 0.15 standard deviations higher compared to years when they have more than 550 students per counselor. Districts have similarly higher math achievement, 0.17 standard deviations, when they have student-to-school-counselor ratios from 351 to 400, compared to years with more than 550 students per counselor. Coefficients for higher student-to-school-counselor ratios are also positive and significant, although smaller in magnitude (0.08 and 0.06 standard deviations). The final two columns in Table 2 show that lower student-to-school-counselor ratios are also associated with reduced racial/ethnic gaps in Grade 5 math achievement. Results for other grade levels and for reading follow similar patterns.
Discussion and Implications
Our investigation into the influence of student-to-school-counselor ratios on students’ academic and graduation outcomes in Texas provides meaningful information. Although several studies have examined the impact of school counselors on student outcomes, an analysis of the state of Texas with a particular focus on academic and graduation outcomes is warranted (Greater Texas Foundation, 2016). Our data show that in Texas, the student-to-school-counselor ratio has ranged between 415 and 455 over the most recent 5 year period. This means that the ratio has consistently exceeded the recommended state and national ratios for optimal student success. These findings were similar to the trend of the national average for student-to-school-counselor ratios over the last 3 decades (American School Counselor, 2023). In the subsections below, we discuss our study’s connections to the literature, implications for policy and practice, and methodological limitations.
Summary and Connections to the Literature
Our findings show that for Texas districts, school years in which the district employed a greater number of counselors per student (holding other factors constant) were associated with higher graduation rates, lower dropout rates, higher student achievement, and lower achievement gaps. Indeed, it appears that the more counselors a school employed, the better its student achievement was, across grade levels and subjects. Moreover, as the number of counselors decreased per student (or an increase in student loads for counselors), math and reading achievement declined and racial achievement gaps increased. These findings are similar to those of previous researchers, who found that school counselors in Missouri who worked under conditions of optimal ratios had more time and resources to focus on students’ needs and, therefore, were associated with greater achievement of student outcomes than school counselors who worked under conditions with higher ratios (Lapan et al., 2001; Lapan, et al., 2012a; 2012b; Lapan et al., 1997). Although these findings appeared to substantiate the positive outcomes of optimal school counselor ratios, Reback’s (2010) findings showed that an additional school counselor did not significantly impact students’ standardized test scores in Alabama; however, the same study showed that an increase in the number of school counselors decreased “the likelihood of elementary school students being suspended or having weapon-related incidents” (p. 130). Research has shown that an increase in disciplinary problems is associated with a decrease in students’ test score performance (Figlio, 2007). Thus, overall, schools would benefit from lower student-to-school-counselor ratios so that school counselors have adequate time to work with students in areas that impact their academic achievement.
Our study also found that, compared to statewide Texas averages, districts had slightly higher than average graduation rates during years in which they maintained lower student-to-school-counselor ratios. These findings provide support for the results of Shi and Brown’s (2020) national study of retention rates. Their study found that counselors with higher caseloads were associated with higher ninth-grade dropout rates, suggesting the importance of counselors having lower ratios and “more time providing targeted direct and indirect counseling services. where students are at higher risk to repeat ninth grade” (p. 6). Our study also aligns with other researchers who found via a national study that schools with lower ratios are significantly more likely to have higher graduation rates that schools with higher ratios (Goodman-Scott et al., 2018).
Implications for Practice and Research
The study has implications for leading and working within school counseling programs. District administrators with limited counseling staff may optimize counselor placements by targeting additional staff to schools serving higher percentages of low-income students, particularly if focused on reducing high school dropout rates (as opposed to overall academic achievement or achievement gaps). For school counselors, recognizing the limitations and challenges of serving a large student caseload is important. Some counselors may wish to focus on a subset of higher need students, given that lower student loads are associated with greater success.
This study also provides implications for future researchers. It shows continued support for the use of ecological models in school counseling research in comprehending and addressing the needs of students (Schultheiss, 2005). Furthermore, the study extends and fills a gap in the study of ratios via an ecological model to the state of Texas, helping to examine student academic outcomes at the district level with particular interest in environmental factors such as socioeconomic status, culture, classroom ratio, and systemic challenges over multiple years. Utilizing an ecological lens makes clear that student outcomes are influenced by several factors, demonstrating the value of researchers analyzes not only of the impacts of student-to-school-counselor ratios but also of school counselor work conditions (e.g., COVID-19 work conditions) on student outcomes (Blake, 2020).
Implications for Policy
These results have implications for policy. Federal legislators have, at times, supported additional funding for school counselors, including expanding the number of full-time-equivalent counselors per student (U.S. Department of Education, 2022). Some state legislators have also supported funding for reducing student-to-school-counselor ratios; however, Texas has not demonstrated substantial support in this area (Holland et al., 2022). Our results suggest that efforts to expand counselor staffing levels warrant further consideration. Moreover, differences in counselor staffing levels across school districts may be cause for concern. Our data show that higher poverty school districts—the 20% of districts serving the highest percentage of low-income students—benefited from lower student-to-school-counselor ratios during the early 2000s, but that difference in improvement largely diminished after 2010-2011, when the state made large cuts to K-12 funding. This finding is similar to but not as extreme as the results of the study by Lapan, Whitcomb, and Aleman (2012), focused on the state of Connecticut. When analyzing the high school student-to school counselor ratios in Connecticut, these researchers found that “Connecticut school counselors working in financially poorer districts have, on average, higher student-to-school-counselor ratios” (p. 118).
When examining race and ethnicity, our results indicated that over the past 2 decades, Texas districts enrolling the highest percentage of students who identify as Black have maintained fewer school counselors per student and higher student-to-school-counselor ratios than districts enrolling the fewest number of Black students. This finding is significant and deserves consideration. Researchers have found that Black students, in particular Black male students, experience significant benefits from low student-to-school-counselor ratios, such as a decrease in student discipline problems (Carrell & Carrell, 2006). Furthermore, we found that districts serving predominantly Latinx students or higher proportions of Latinx students than other districts had higher student-to-school-counselor ratios for a large part of the 2000’s. This may shed light on other researchers’ findings that Latinx students are less likely to seek out school counselors for college information (Bryan et al., 2009). It is probable that school counselors working in predominantly Latinx districts with high student-to-school-counselor ratios have difficulty finding time to see each student and/or that students experience difficulties securing time in a counselor’s schedule.
Limitations
We caution readers that our analytic approach does not rule out all threats to internal validity, and we are not able to make strong causal inferences with our research design. A third, unobserved variable, such as a one-time investment in staff professional development that coincides with a change in the counselor ratio, or an unobserved change to student demographics that is not measured through our poverty and race variables but correlated with outcomes could bias our estimates. The greatest source of omitted variable bias stems from different staffing decisions across districts, based on local context. For example, district leaders might establish an especially strong counselor program in their district, with lower student-to-school-counselor ratios, to address low achievement or high dropout rates. A simple correlation across districts might find lower achievement in districts with lower ratios. Our approach is to examine changes in ratio within districts over time. By doing so through use of district fixed effects, we rule out time-invariant district factors such as a culture of having a strong counselor program. We also control for student poverty rate, race/ethnicity, and the number of teachers per student, to address time-varying factors that could be correlated with both counselor ratios and student outcomes. Still, other time-varying district factors, such as changing district leadership, could bias our estimates either up or down. We therefore interpret our results as providing strong but not necessarily causal evidence of a relationship between counselor staffing levels and student outcomes.
Conclusion
The findings of this study demonstrate that student-to-school-counselor ratios in the state of Texas are correlated with student outcomes, in particular academic achievement and graduation outcomes. Taking into consideration the various school and environmental influences (e.g., socioeconomic status, ethnicity, and limited school resources) students encounter, the number of school counselors per student must be viewed as an important component in the debate concerning means to improve student outcomes, particularly in Texas. Since the global pandemic, K-12 students in the state of Texas have experienced greater than typical academic losses, resulting in the state’s education agency recommending additional instructional day formulas for school districts to implement (TEA, 2021). This gives evidence of the challenges faced by schools in their transitions between virtual learning and in-person learning; however, it does not make clear the need for student supports that are typically found outside the in-person classroom. During the COVID-19 era, school leaders must recognize that school counselors are uniquely trained to provide much-needed counseling services and, therefore, should be included in ongoing improvement plans (Pincus et al., 2020). Not only is pursuing optimal student-to-school-counselor ratios evidently important, but school counselors must also have adequate time and space to engage in the work they have been trained to perform.
Footnotes
Declaration of Conflicting Interests
The author(s) declared no potential conflicts of interest with respect to the research, authorship, and/or publication of this article.
Funding
The author(s) disclosed receipt of the following financial support for the research, authorship, and/or publication of this article: This work was supported by the American School Counselor Association (OR20180453).