
Abstract
W. E. B. Du Bois argued that a focus on the opportunity structure available in a particular area was key to understanding why negative outcomes are more prevalent in some areas than others. We argue that the practice of residential redlining-discriminatory lending practices of the early 20th century-fundamentally altered the opportunities for conventional success present in neighborhoods thought to be the “riskiest.” Scholarship indicates that formerly redlined areas are characterized by significantly higher levels of community and health-related outcomes, including levels of firearm violence and homicide. Using longitudinal analyses and consistently defined communities in Miami, Florida, between 1970 and 2010, we assess the effects of residential redlining on lethal violence. Our models include measures of immigration as a control for potentially mitigating influences on the effect of redlining. Consistent with prior research, our results indicate that levels of lethal violence are associated with a community having been redlined. Results also indicate that the observed “buffering” effect of immigration has a moderating influence on the effect of residential redlining, offering strong, though indirect, support for the immigration revitalization hypothesis.
Introduction
Although a theme that runs through much of his work, the prescient arguments offered by W. E. B. Du Bois (1899) in The Philadelphia Negro, which emphasizes the critical link between social context and behavioral outcomes, remain as relevant today as it was when introduced over 125 years ago. In this work, he identifies the social structural conditions in Black communities as the cause of negative outcomes such as crime, rather than relying on staid racialized explanations. Du Bois's scholarship shifted scholarly focus away from individual-level sources (e.g., race) to a community's structural conditions such as limited opportunity structures and barriers to full social participation as the most salient precursors to criminal behavior. Indeed, these are subjects for which there is still much to understand and, even a century on, continue to garner much scholarly attention.
The present study continues that tradition by focusing on the consequences of severely restricted opportunities for residential attainment. More broadly, Du Bois connected residential mobility to upward social mobility, which he recognized was enjoyed by only a small share of the Black population. This is a pattern that continues into the present, with research finding that inequality between Blacks and Whites widening rather than converging since 1860 (see Derenoncourt et al., 2023). There are certainly many factors contributing to the noted inequity, we argue that one source may be associated with the restrictive housing policies (i.e., residential redlining) that were initiated in the 1930s and 1940s. However, little criminological research exists that quantifies the consequences of this policy, particularly the extent to which it is associated with contemporary levels of crime in those areas. The present study brings together unique data sources to address this topic more directly than in previous studies. We believe our examination of the historical effect of social marginalization follows in the spirit of Du Bois’ research in Philadelphia's Seventh Ward which sought to broaden understanding of an outcome through contextualization.
HOLC, Residential Redlining, and Crime
Residential redlining refers generally to the process wherein banks were refusing to offer loans to residents of certain communities ostensibly as a means of limiting the number of defaults on loan payments. Through an assessment process conducted by the Federally sponsored Home Owners Loan Corporation (HOLC) (https://dsl.richmond.edu/panorama/redlining/howandwhy), evaluated cities across the country and ranking areas within cities based their “desireability,” on perceptions of mortgage security, or the risk mortgage default. This evaluation system resulted in communities within an urban area being assigned a grade from “A” to “D,” with the latter representing the least desirable areas of the city, which were characterized by surveyors as “hazardous” (Farley & Frey, 1994; Jackson, 1985; Massey & Denton, 1993; Wilson, 1987). Further, a series of maps were produced for the cities in the HOLC studies, which clearly identified such areas as places loan officers should avoid when considering loan applications. As has been well established in the literature, communities of color, and particularly those which were home to Black residents, were assigned “D” grades almost without exception and thus, effectively excluded from loan consideration. Indeed, between 1935 and 1940, these communities accounted for less than 2% of FHA loans (Massey & Denton, 1993). 1
This exclusionary practice took hold at a critical time in the urban development of this country that corresponded with the push toward suburbanization, made possible due to a combination of changes in Federal financial (e.g., loan amortization) and housing policy (e.g., G.I. Bill). There was a large-scale exodus from cities to surrounding suburbs during this period, but it was all but impossible for most Black residents. To put this into perspective, according to the 1940 Annual FHA report, this would mean that of the roughly 202,000 loans secured that year nationally, fewer than 3,500 were made in the communities with the lowest HOLC grades (or approximately 3,250 of the over 162,000 new home loans were made in “D” graded communities). 2 The confluence of these institutional shifts meant that Black residents were largely unable to secure loans that would have allowed them to find better housing outside of the city, while also unable to receive loans to improve their residences inside the city. As a result, the Black population tended to live in not only older neighborhoods, but also in many cases, those comprised of deteriorating housing stock (Alba, Denton, Leung & Logan, 1995; Alba et al., 1999; Farley & Frey, 1994; Massey & Denton, 1993).
From this perspective, areas characterized by the highest levels of socioeconomic distress and crime were established primarily through a process of urban disinvestment rather than dynamic urban change. To illustrate, the FHA's denial of insured mortgage loans to Black families in urban communities is now well known. But less known is that “The FHA had its biggest impact on segregation, not in its discriminatory evaluations of individual mortgage applicants, but in its financing of entire subdivisions, in many cases entire suburbs, as racially exclusive white enclaves” (Rothstein, 2017, p. 70). Stated differently, the spatial concentration of disadvantage and crime is the result of a process of withdrawal of residents and resources from communities rather than the byproduct of an urban area's self-correcting sorting process. While the largescale exodus to the suburbs excluded much of the country's urban Black population, it is reasonable to anticipate that some of the demographic characteristics of these communities may also depart from ecological expectations. Because residential redlining effectively prevented relocation for many, it is likely that the lowest graded areas will have more of a sedentary population base than expected by disorganization theory (see Warner & Pierce, 1993). Further, it may also be the case that over time these neighborhoods are not occupied by the newest foreign-born arrivals to the city. If such patterns are revealed in our analyses, this will raise new questions about the applicability of the model of urban change proposed by disorganization theory (see Bursik, 1989; Hagan, 1994).
Drawing generally from the literature on public health, research has identified an association between historical residential redlining and an array of negative health (i.e., cancer, asthma, chronic disease) and environmental outcomes (i.e., reduced greenspace, alcohol establishments, urban heat) (see Hoffman et al., 2020; Krieger et al., 2020; cf Mehranbod et al., 2022, p. 165; Nardone et al., 2021). As it relates to matters of criminal deviance, the small but growing body of scholarship generally finds a strong association between a neighborhood's initial HOLC grade and contemporary levels of firearm violence and homicide (Jacoby et al., 2018; Poulson et al., 2023; Powell & Porter, 2022). For example, in their study of firearm violence in Boston, Massachusetts, Poulson and colleagues (2023) report that increases in income mobility (proxy for social mobility) are associated with reductions in firearm violence across communities independent of historical HOLC designations. However, they also find significant differences in the predicted number of shootings across neighborhoods that were originally graded “C” or “D” (Poulson et al., 2023). A similar pattern of results was reported by Jacoby et al. (2018, p. 92) in their study of gun violence in Philadelphia, where they conclude that “firearm injuries, which are arguably the most dangerous … appear to occur most frequently in historically red-zoned areas.” A similar conclusion is drawn by Benns et al., 2020, p. 1295) who find that “redlined neighborhood areas have approximately five times” as many gunshot victims as communities that received the highest HOLC grade. These findings are generally echoed in the recent multi-city study published by Lyons et al. (2023, p. 13), who found that “neighborhoods with a relatively poor HOLC grading had more violence and burglary some 70 years later.” As W. E. B. Du Bois (1899) understood, and Lyons and colleagues learned (2023), residing in red-zoned or highly segregated areas was dangerous and deadly across time and place.
Taken together, the literature strongly suggests that the effects of residential redlining on communities are enduring and consequential. Moreover, the latter work by Lyons and colleagues (2023) represents the most expansive examination of the association between HOLC community assessments and crime and one of the only ones with a social scientific focus. As such, the authors point out that additional research is needed to achieve a fuller understanding of the link between historical community characterizations and contemporary levels of lethal violence. One important gap in the literature, as identified by the authors, is the absence of longitudinal analyses focusing on this association, owing to a lack of available “information on the structural characteristics of neighborhoods in the decades between the HOLC maps and present-day crime” (Lyons et al., 2023, p. 13). The current study is designed to help provide initial insight into this aspect of the relationship, which has remained largely unexamined.
Research Setting
Our study focuses on the association between residential redlining, immigration, and homicides in Miami-Dade County, Florida for the period from 1970 to 2010. 3 In addition to more comprehensive data on community change, this area is particularly well suited for a study such as this. During this period, the county experienced sharp increases in the size of the Black and Latino populations, which began during the 1960s. The observed changes in the population characteristics were driven largely by the increase in the size of the Latino population in the county, which experienced approximately a 175% increase between 1970 and 2010. To place this unprecedented growth in context, in just over two decades, the Latinos became the county's majority population, rising from a low of roughly 5% in 1960 (see Martinez, 2002; Martinez et al., 2008). By comparison, the size of the Black population also grew by nearly 30% between 1970 and 2010, but this increase was steady over time, with the relative size of this group ranging between 15% and 19%. Moreover, considering the Black and Latino populations together, the county has had a “majority minority” designation for nearly the entire period under study, highlighting the diversity of the area's population generally. 4
The observed increases for both groups, but particularly for the Latino population, were driven largely by the growth in the size of the immigrant population. To illustrate, in absolute terms, the size of the foreign-born population increased by 1.24 M between 1970 and 2010, which accounts for nearly 80% (79.6) of the county's overall increase of 1.56 M residents. This translated to an increase in the share of the population born outside of the United States more than doubling (125% increase), growing from less than a quarter of the population (24.2%) to accounting for more than half of the total (54.1%). 5 As a result, Miami-Dade is the only County in the nation (of over 3,100) with a “majority foreign-born” population, which is a designation it has held since 2000. 6
It is well established that this exponential growth in immigration is owing largely to the arrival of Cuban-born individuals, which have been the largest share of the foreign-born population for more than five decades. 7 Indeed, in 2010, Cubans accounted for approximately 46% of the county's immigrant population, down from 75% in 1970 (Martin, Bouvier & Leonard, 1995). Although the foreign-born population in the county remains disproportionately represented by Cubans, this observed reduction in relative size indicates increasing heterogeneity among the county's immigrant population. For example, the county experienced notable increases in individuals from Central and South America, with the largest ethnic groups arriving from Nicaragua, Honduras, Columbia, and Peru (Logan, 2002; Martinez & Lee, 1998; Portes & Rumbaut, 2001). The diversity of the immigrant population is enhanced by sizable shares of arrivals from the Caribbean, particularly from Hispaniola, the island comprised of Haiti and the Dominican Republic (Schulz & Batalova, 2017). Fortunately for the purposes of our analyses, the period under study captures these dynamic shifts in immigration patterns, particularly over the past few decades. As such, these data permit a unique test of immigration's association with neighborhood levels of lethal violence.
Data and Methods
The community-level indicators included in this study are compiled from three primary sources. 8 Our dependent variable is the number of homicide incidents that occurred in a given area around each of the five decennial census periods between 1970 and 2010. Information about the incidents, including location, was obtained from records maintained by the homicide unit of the city of Miami Police Department and the Miami-Dade County Medical Examiner's Office (see Cancino et al., 2009; Lee et al., 2001; Martinez et al., 2010). Based on the 2010 boundary definitions, the records were then georeferenced using the address where the incident occurred and subsequently aggregated to neighborhoods. More specifically, for each time period, the dependent variable is measured as the number of homicides pooled over the five years preceding the decennial year (e.g., 1965–1970; 1975–1980; etc.), a common practice used to increase the reliability of the regression estimates (see Feldmeyer et al., 2022; Lyons et al., 2023; Martinez et al., 2010; Mears & Bhati, 2006; Ousey & Kubrin, 2018).
The aggregated homicide data were then matched to tract-level census indicators made available in the Neighborhood Change Data Base (NCDB) (Geolytics, 2012). The NCDB is ideal for the purposes of this study because it includes boundary-normalized census-based information for community social structural and compositional qualities for each of the decennial census periods. 9 , 10 Information about historical community HOLC grades was also made available based on the 2010 geographical definitions. The indicators included in our analytical models are informed by both social disorganization theory and previous neighborhood-level studies. As indicated above, examining the effect of immigration in the most socially disinvested neighborhoods is of key interest for the present study. To address this question, we employ a measure of immigrant concentration defined as the percent of the population born outside of the United States and the percent Latino (Feldmeyer, 2009; Martinez et al., 2010; Sampson, 2008; Sampson et al., 1997).
Additionally, we include a composite measure of concentrated socioeconomic disadvantage, which has been shown to be strongly associated with community levels of criminal deviance (see Bursik, 1984; Krivo & Peterson, 1996; Sampson et al., 1997; Sampson & Morenoff, 2004). The measure included in our analyses is comprised of four indicators: percent of families living in poverty, percent of households receiving public assistance; percent unemployed; and the percent of the employed population working in non-professional/non-managerial occupations. Combining variables into a single indicator is common practice in an effort to minimize any biasing influence on our estimates due to multicollinearity (Land et al., 1990; Sampson et al., 1997). Further, a confirmatory factor analysis indicates that this approach was warranted as each of these variables loaded on a single factor, with an Eigenvalue of 2.70 (results available upon request). Regarding polarity, higher values on this indicator indicate increased levels of socioeconomic disadvantage.
Our models also include a measure of racial/ethnic heterogeneity, as measured by the neighborhood diversity index (see Blau, 1977; Sampson & Groves, 1989). This measure considers the relative population sizes of multiple groups, which we argue captures a “full range” of neighborhood diversity, consistent with theoretical conceptualizations (Shaw & McKay, 1942; see also Sampson & Groves, 1989: 784–785). In the present study, the groups used to calculate the diversity index include “non-Latino Whites, non-Latino Blacks, Latinos, and Asians.” 11 As a measure of informal social control, we include a measure of the ratio of adults to children in a neighborhood (Sampson & Morenoff, 2004). An inverse association is anticipated between levels of informal social control and levels of homicide. We control for community affluence by including a measure of the share of the employed population working in professional/managerial occupations. Based on theoretical logic and previous studies, neighborhood affluence is expected to be inversely associated with the number of observed homicides (see Sampson et al., 1997; Ousey and Kubrin, 2018). Our final census-based indicator captures the residential stability of communities, measured as the sum of standardized scores for the percent of the population who have lived in their homes for at least five years and the percent of homes that are owner occupied.
Whether a neighborhood was residentially redlined is the final indicator included in our estimated regression models. More specifically, in the current study, we focus on areas deemed to be “hazardous” by HOLC surveyors and received the lowest assessment grade of “D” (Jackson, 1985; Massey & Denton, 1993; Wilson, 1987). Due to changing boundary definitions, the graded areas do not align perfectly with contemporary tract boundaries, resulting in a “splintering” of assessed areas. What this means is that it is possible for an assessed area to include varying shares of multiple tracts, or for a single current tract to have portions with multiple HOLC grades. Although the geographical slippage is not unique to the present study, it is an issue that had to be addressed analytically (see Lyons et al., 2023). For our purposes, we considered tracts as being redlined if at least 20% of the area received the lowest grade (average tract coverage = 47.9%). In all, we identified 43 redlined neighborhoods in Miami-Dade County, which account for just about 18% of all communities included in the analysis. A dummy variable was created with redlined areas being coded “1” and “0” otherwise. Further to account for potential period effects on community homicide levels, our models include dummy indicators for decade (Allison, 2005).
Estimation Procedure
Our multivariate analyses were conducted using a random-effects regression estimator. Because the dependent variable is measured as the count of homicides in each neighborhood for a given period, event-count models were the best-suited option for modeling change. More specifically, postestimation diagnostic tests indicated that the homicide data were over dispersed (i.e., μ<σ2), which necessitated that we model our data using the negative binomial regression technique. Under conditions of overdispersion, this approach is preferable because it provides more accurate estimates of the standard errors, and in turn, more reliable tests for statistical significance (Allison, 2005; Tabachnick & Fidell, 2019). The regression models were estimated based on random-effects, which permits the inclusion of time-invariant covariates such as our measure of residential redlining (see Allison, 2005). 12 A limitation of random-effects regression is that, unlike fixed-effects models, the results are subject to bias due to the extent that the model is incorrectly specified (see Allison, 2005). However, because our models are specified in accordance with previous research, we believe such concerns about omitted variable bias are minimized.
Results
Descriptive Findings
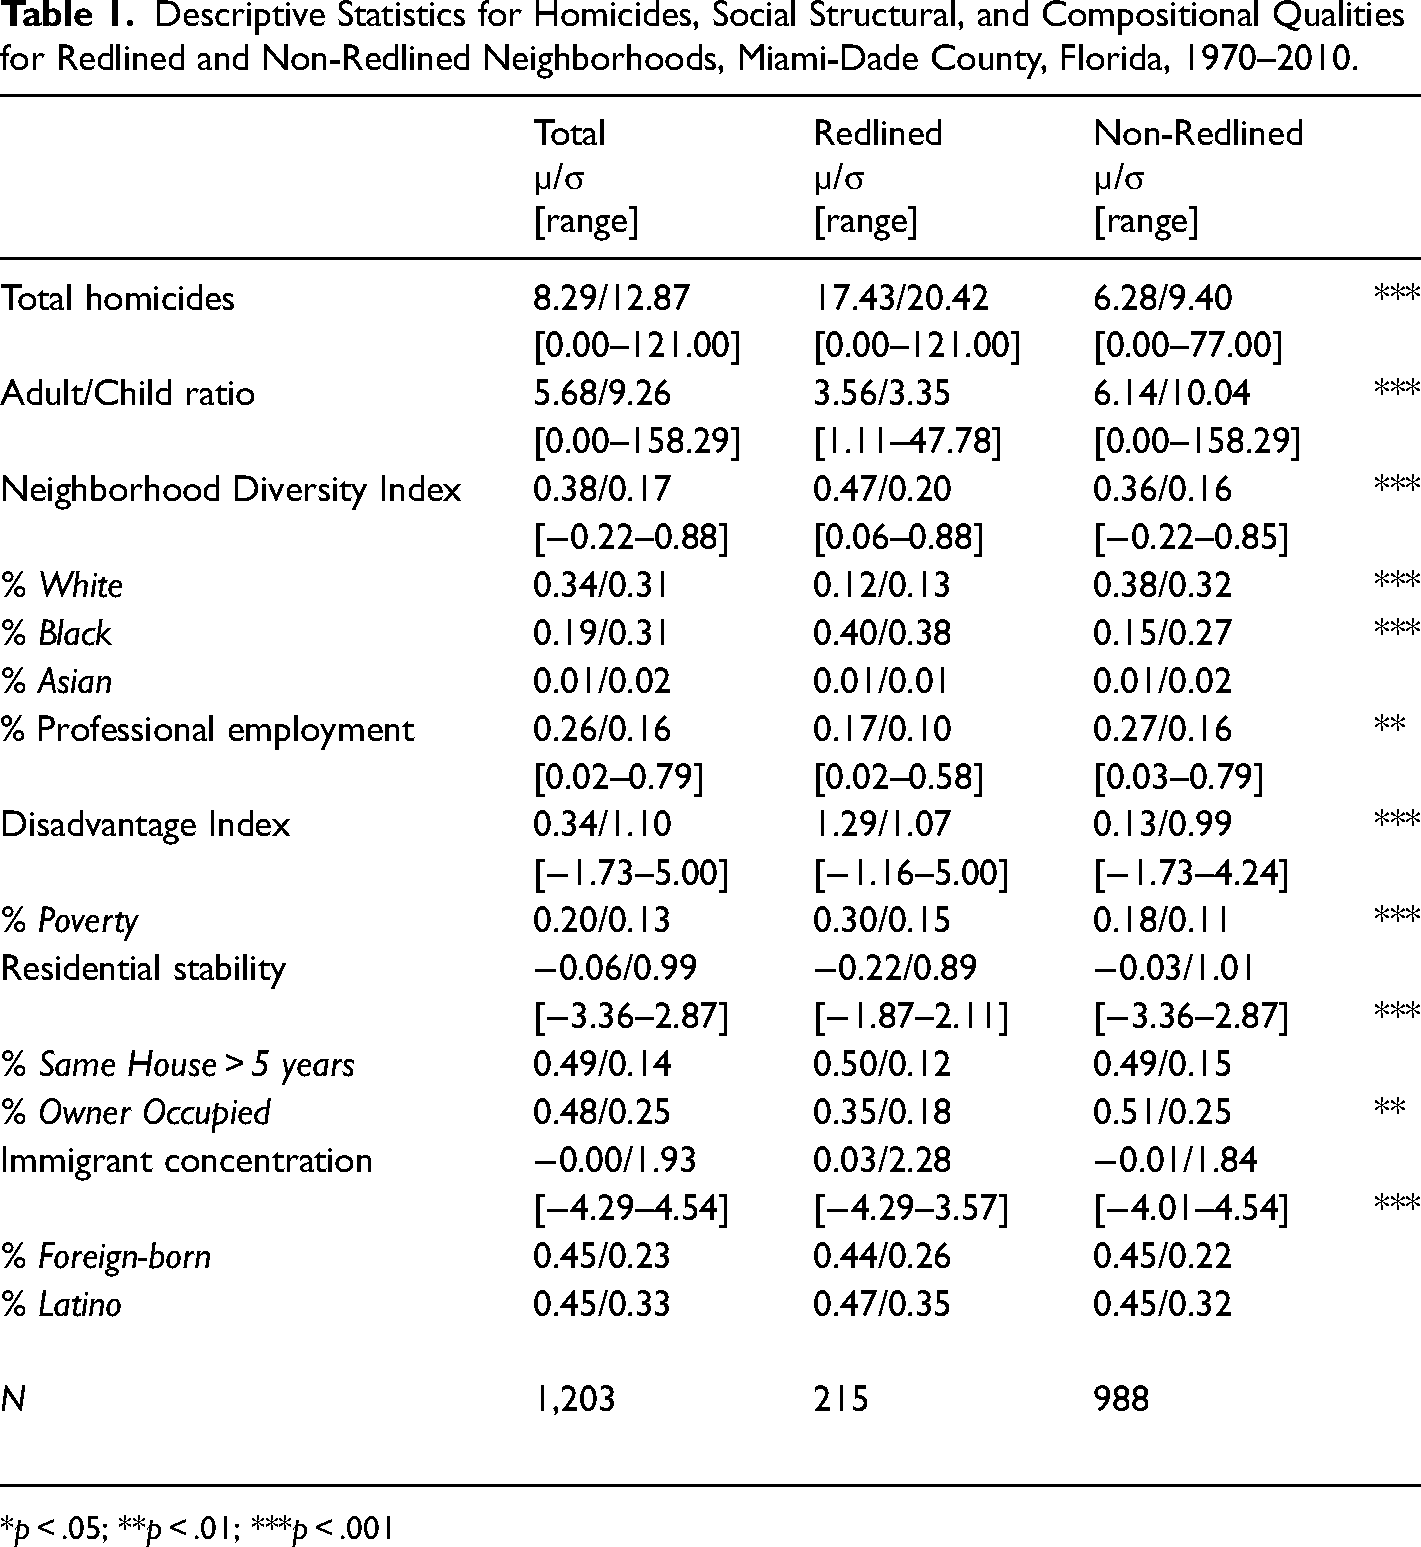
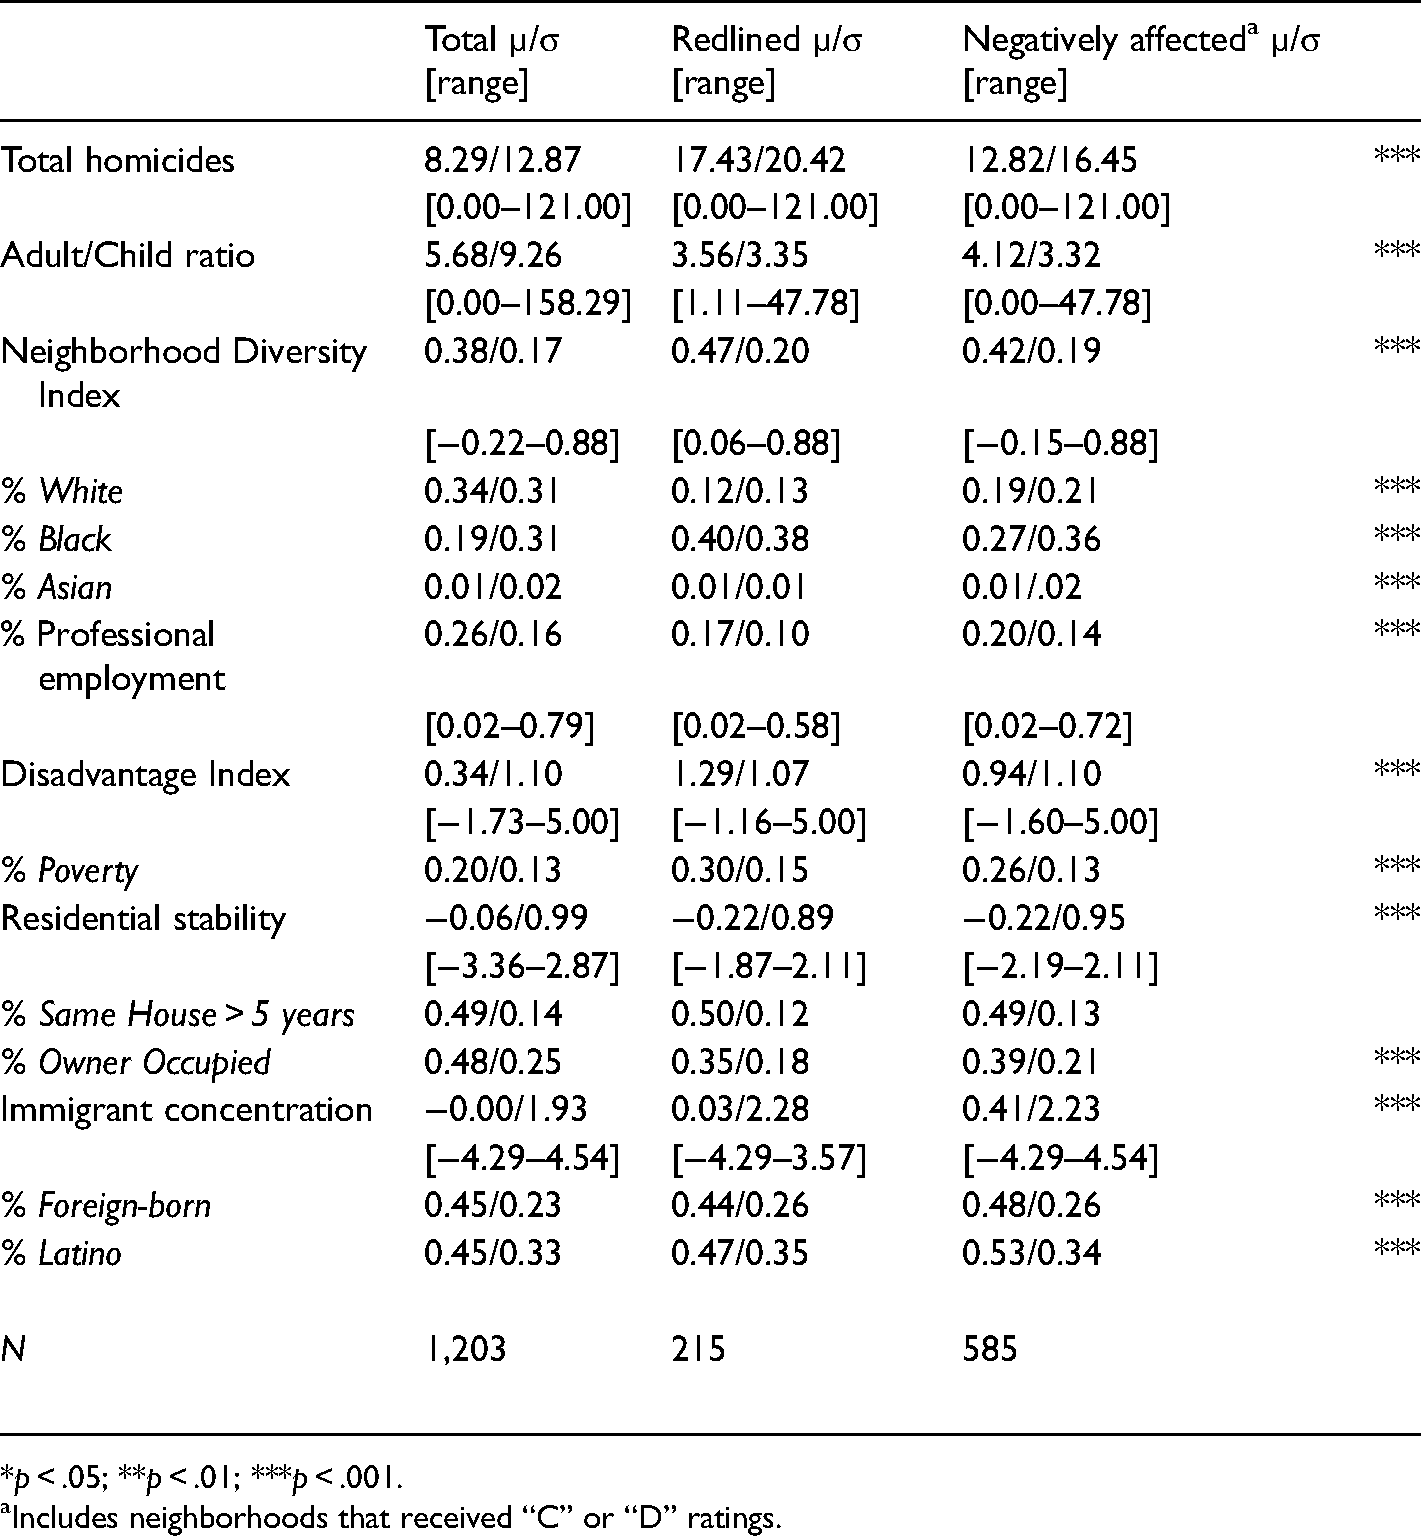
Table 1 includes the mean, standard deviation, and range over the study period for the indicators included in our regression analyses. The results from the descriptive analyses show pronounced compositional differences and social structural disparities between neighborhoods that received the lowest HOLC assessment and those that did not. We highlight the communities that received the lowest assessment grade because historically redlining led to concentrated poverty, hypersegregation, and racial isolation. These past structurally exclusionary forces maintained by “government and private industry came together to create a system of residential segregation” (Rothstein 2017, p. 75). Indeed, over the study period, redlined communities were significantly more violent, averaging nearly three times the number of homicides compared to those that received any other grade (17.4 and 6.3, respectively). Commensurate with the higher levels of lethal violence, residentially redlined neighborhoods in the county tended to be characterized by higher levels of socioeconomic disadvantage. Focusing on neighborhood levels of poverty, we see that redlined areas had an average of approximately 30% of their populations living below the poverty line, compared to roughly 18% for non-redlined communities. Residentially redlined communities tended to be more diverse compositionally, which is owing to the larger share of Black residents who averaged about 40% of the population in historically redlined communities between 1970 and 2010 (compared to 15% in non-redlined areas). By comparison, Whites accounted for only about 12% of the population in redlined areas, which is less than one-third of the total among the non-redlined neighborhoods (38%). Additionally, while redlined communities also tended to have significantly lower levels of informal social control, home ownership; no substantial neighborhood differences were observed between percent foreign-born or percent Latino. The disparities highlighted in our descriptive analyses underscore the importance of controlling for HOLC grade in the current study.
Descriptive Statistics for Homicides, Social Structural, and Compositional Qualities for Redlined and Non-Redlined Neighborhoods, Miami-Dade County, Florida, 1970–2010.
*p < .05; **p < .01; ***p < .001
Multivariate Results
Baseline Analysis
The results from a baseline, cross-sectional regression analysis of 2010 data are presented in Table 2. This model is useful because it will be used to help us determine the degree to which our data include some observations which might influence the findings from the longitudinal analyses. In other words, we do this as an attempt to minimize the likelihood that our results are an artifact of our neighborhood selection. Our assumption is that if our data produce results that resonate with findings from previous research, they would be unlikely to generate anomalous estimates in the more comprehensive analyses. The cross-sectional estimates are in line with previous immigration research, including studies focusing on communities in the city of Miami (see Lee, 2003; Lee et al., 2001; Martinez, 2002; Martinez & Lee, 2000). Except for the adult/child ratio, predictors had a statistically meaningful association with community homicide levels with each in the anticipated direction. More central for our purposes, these findings are consistent with the scholarship of Du Bois (1899) which emphasized the central role of social context in understanding criminological outcomes. By examining these questions over time, the present study contributes to ongoing discussions about community-level processes he first posed.
Negative Binomial Regression of Homicides on Residential Redlining and Neighborhood Structural Factors, Miami-Dade County, Florida, 2010.
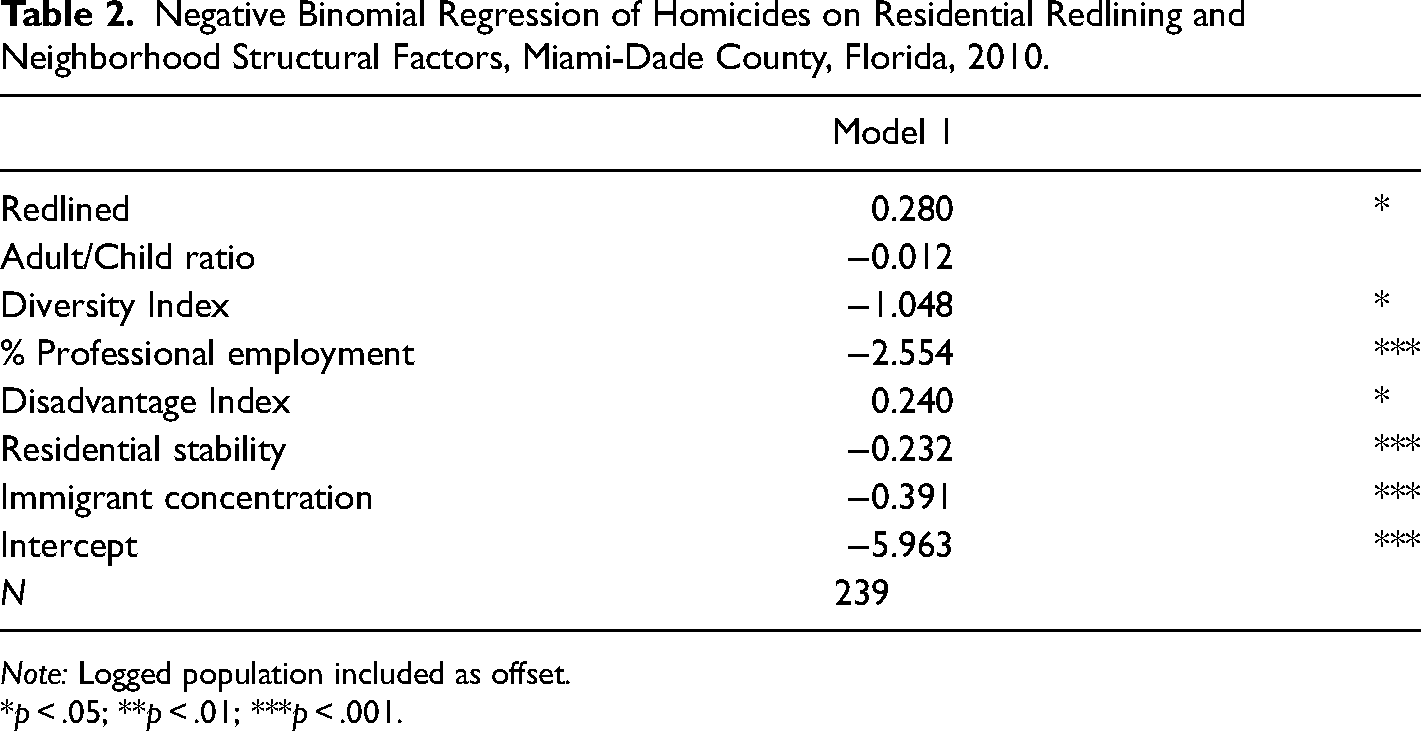
Note: Logged population included as offset.
*p < .05; **p < .01; ***p < .001.
Longitudinal Analyses
Turning now to our dynamic regression analyses, in Model 1 (Table 3), we see that changes in community social structural factors are associated with changes in observed levels of lethal violence. More specifically, we find that areas that experienced increasing levels of socioeconomic disadvantage during the period under study tended to lead to more homicides, net of other community conditions. This result is entirely consistent with theoretical expectations as well as previous research, again showing the strong association linking neighborhood economic vitality to expressions of criminal deviance (see Shaw & McKay, 1942; see also Adelman et al., 2017; Feldmeyer & Steffensmeier, 2009; Feldmeyer et al., 2022; Martinez et al., 2010; Ousey & Kubrin, 2018; Stowell et al., 2009; Stowell & Martinez, 2007). A similarly expected inverse effect is observed for the percent of the population employed in professional occupations, which is included as a proxy for community affluence. That is, our findings indicate that increases in affluence predict significantly fewer homicides, which also echoes the findings in previous research. Although they represent important statistical controls, we find null effects associated with both the adult/child ratio (informal social control) and neighborhood diversity index.
Random-Effects Negative Binomial Regression of Homicides on Residential Redlining and Neighborhood Structural Factors, Miami-Dade County, Florida, 1970–2010.
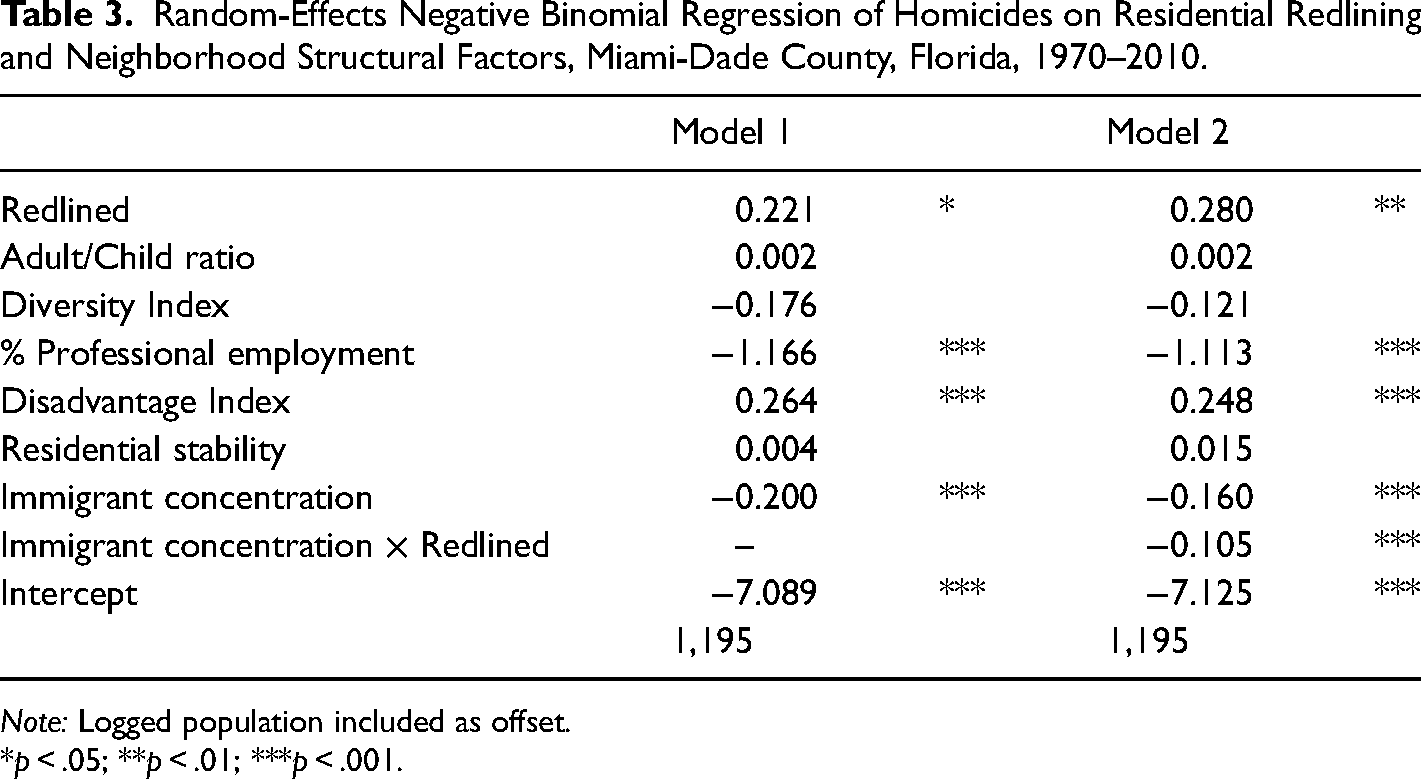
Note: Logged population included as offset.
*p < .05; **p < .01; ***p < .001.
Each of the predictors of primary interest, immigrant concentration and residential redlining emerge as significantly associated with the number of community homicides and in the expected directions. With respect to the former, communities in which immigrants became a larger share of the population experienced significant reductions in the number of homicide incidents over time. Our results also confirm that for the five decades under study, significantly more homicides were committed in communities that received the lowest HOLC grade, underscoring the continued saliency of a neighborhood assessment conducted more than 100 years ago by Du Bois in Philadelphia. Recall that another objective of this study was to examine the potential moderating effect of immigrant concentration on redlining. Such a test is important because it represents a closer examination of the immigrant revitalization perspective than has been conducted in previous research. Specifically, we proposed that a negative moderating temporal effect of immigrant concentration on crime within communities that were historically socially disinvested would be suggestive of a revitalization process linked to immigration. Indeed, a moderating influence was observed indicating that the effect of immigrant concentration is stronger within redlined neighborhoods. To our knowledge, these findings are among the first to show that community revitalization, or the violence-suppressing influence of immigrant concentration, is observed in communities that continue to experience the long-term consequences linked to HOLC's community assessments. Although an indirect test, we believe that finding represents an initial attempt to quantify this effect.
Summary and Conclusions
Results from the present study are both novel and confirmatory. On the one hand, our findings resonate closely with previous research and theoretical expectations in that they clearly show that changes in levels of lethal violence within communities are shaped by the changing landscape of neighborhood social structural and compositional qualities. Perhaps not entirely surprising, we found that factors such as community levels of socioeconomic distress and affluence emerge as strong predictors of homicide over a period of five decades. The results presented here are also supportive of previous research in that we observed a significant inverse association between homicide and immigrant concentration. The impact of immigrant concentration on homicide bolsters the argument made by Sampson and Bean (2006, p. 21) nearly two decades ago that it may no longer be “tenable to assume that immigration and diversity automatically lead to social disorganization and consequently crime.” Our findings are in complete accordance with established patterns of findings reported in the immigration and crime literature (Adelman et al., 2017; Feldmeyer et al., 2022; Lee, 2003; Martinez et al., 2010; Ousey & Kubrin, 2018; Stowell et al., 2009).
The present study also confirms that for the period under study, residentially redlined communities remained in a marginalized position socially, as they were characterized by significantly higher levels of socioeconomic distress, reduced levels of affluence, and lower levels of informal social control. As such, our research confirms that such neighborhoods were particularly susceptible to expressions of criminal violence, as these areas were also characterized by significantly higher levels of homicide. Consistent with previous research our results indicate that elevated levels of homicide are, in part, a direct consequence for neighborhoods that were evaluated negatively (Jacoby et al., 2018; Lyons et al., 2023; Poulson et al., 2023; Powell & Porter, 2022). That is, our study reveals a clear link between contemporary homicide risk and whether a community was deemed to be “hazardous” based on a HOLC community assessment conducted nearly 80 years ago. Moreover, these effects appear to be robust, as we observed a high degree of consistency with previous research despite differing analytical approaches.
Despite the consistency of findings, it is important to mention how the results from the longitudinal analyses help to bridge important gaps in our understanding of the link between a neighborhood's history and contemporary levels of homicide. Specifically, our unique data allowed us to model the dynamic nature of community processes and change in a more theoretically and empirically parsimonious manner (Bursik & Webb, 1982; Schuerman & Kobrin, 1986; Shaw & McKay, 1942). As it relates to studies of the impact of residential redlining on community levels of homicide, to our knowledge, the present study contributes to this literature because it is the first to examine this association over period of study. Our results also underscore the importance for community researchers to include controls for “historical facts,” or the policies and practices that shaped communities structurally (and criminologically). When possible, we urge researchers to consider factors such as whether a community had been “subjected to zoning, highway construction, redlining, urban renewal, or racial covenants” in their regression analyses (Linning & Eck, 2025, p. 234).
In addition to quantifying the effect of residential redlining, another finding of primary interest is the negative moderating influence of immigrant concentration on a community's homicide risk. While we observe the well-documented inverse “buffering” effect of immigration on homicide levels generally, the evidence suggests that this suppressive influence is somewhat stronger in residentially redlined communities (see Figure 1). 13 As is evident in the figure, immigrant concentration is negatively associated with homicide levels, for both redlined and non-redlined neighborhoods. However, the steeper negative slope for redlined areas illustrates that the ameliorative effect of immigration has a stronger homicide-suppressing influence in these areas. Figure 1 also shows that residentially redlined communities with high immigrant concentrations are expected to have fewer homicides than non-redlined neighborhoods, all things equal. Focusing on the effect of immigrant concentration within disadvantaged and historically disinvested communities allowed us to isolate the influence in a very specific social context. The beneficial negative impact of immigrant concentration offsets some of the effects of other disadvantageous structural conditions in these areas is indicative of improving neighborhood vitality.
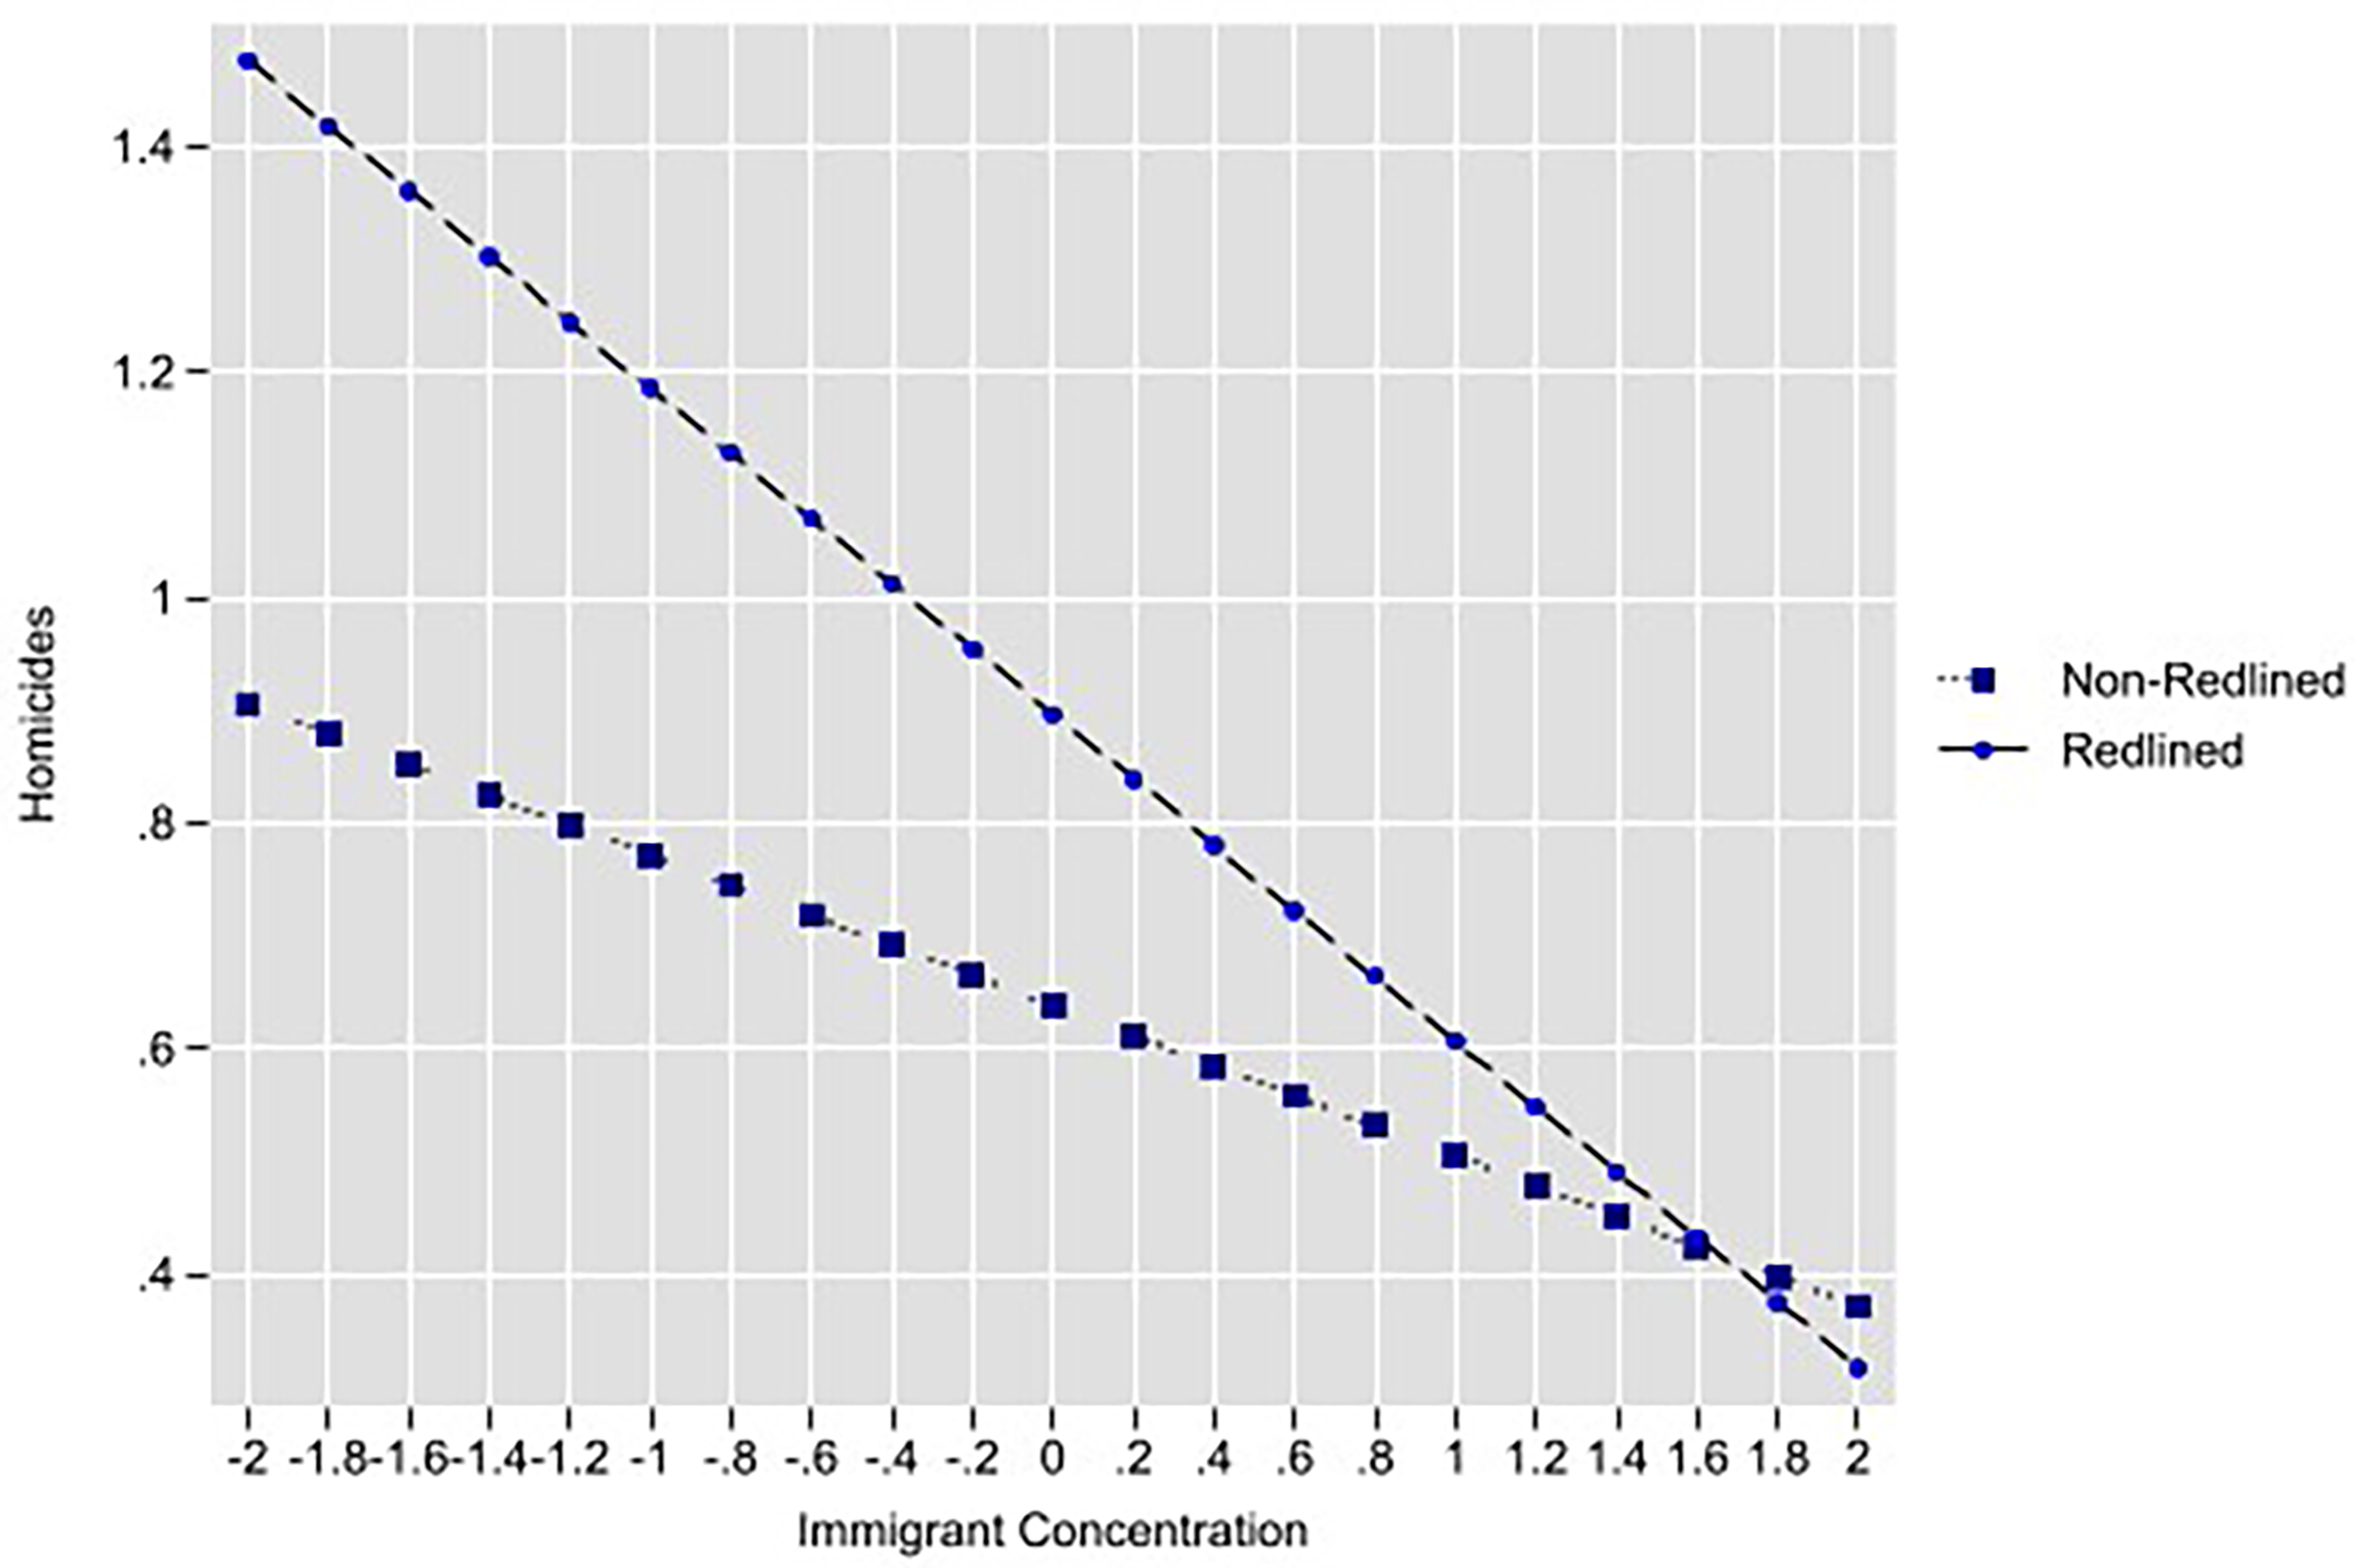
Predicted Neighborhood Levels of Homicide by Immigrant Concentration and Residential Redlining Status, Miami-Dade County, Florida, 1970–2010.
We acknowledge that the observed moderating influence of immigrant concentration is not a direct test of the revitalization perspective. Yet particularly because the immigration effect is observed within redlined communities, our findings provide new support for the perspective. For example, we find no clear indication that the negative impact of immigrant concentration reflects a selection effect, or that immigrants choose to settle in neighborhoods with already low levels of violence. From our perspective, it does not stand to reason that areas characterized by higher levels of crime, generational poverty, and other related decrements would be preferred in the presence of viable alternatives. As such, the effect of immigrant concentration on homicide would be artifactual to the extent that redlined communities represented the preferred, rather than the only, settlement option for immigrants. However, because of the significantly higher base homicide levels in the redlined neighborhoods, we find no empirical support for such a process. What this means substantively is that there is no real concern that our results are affected by endogeneity bias (see Hipp & Kane, 2017; Hipp & Williams; 2020; MacDonald et al., 2013; Martinez et al., 2016). In our estimation, the absence of residential selection effects adds further, albeit indirect, support for the immigrant revitalization perspective. 14
A key contribution of the present study is that it addresses an important limitation in previous studies which faced a restricted set of analytical options due to the “lack information on the structural characteristics of neighborhoods in the decades between the HOLC maps and present-day crime” (Lyons et al., 2023; p. 13). In addition to a wider array of analytical approaches, analyzing neighborhood data over five decades advances current knowledge by offering a more nuanced depiction of the relationship between immigrant concentration and criminal deviance than available in previous research. However, there are several questions that were beyond the scope of the present study that we believe would be fruitful directions for future research.
Limitations of available data prevented us from considering additional community-level factors that may influence the relationship between immigration and crime. For example, beyond redlined communities, our analyses do not consider other contextual factors that have been shown to bear on this association (see Lyons et al., 2013). Indeed, in their study of neighborhoods across 87 cities, Lyons et al. (2013, p. 13) report that the strongest inverse effect of immigration on crime is found in “neighborhoods benefit more from immigration when cities have greater political incorporation of Asians and Latinos into city offices and bureaucratic incorporation of minorities into the police force.” While we recognize the value in considering more directly the community context into which immigrants settle, we feel that such broad measures are better measures of between- rather than within-city variation. Developing and testing more localized measures of immigrant receptivity extends beyond the reach of our study, but it is a topic deserving of future analytical attention.
Although we offer findings supportive of the immigration revitalization perspective, research has yet to identify the particulars of this process. In part this is because the term has been widely used but only loosely defined. This perspective hypothesizes that immigration “breathes new life into areas” by reducing levels of social disorganization and decreasing crime (Lee, 2013; p. 277). Because more specific examples of the underlying causal process are not discussed, this perspective has remained largely understudied. For example, it is not clear if “social disorganization” refers to structural factors, or the degree to which immigrant concentration is associated with improvements in a community's levels of disadvantage, affluence, or residential stability. Alternatively, it could be that disorganization refers to more informal neighborhood processes associated with crime, such as levels of social cohesion or collective efficacy (see Sampson et al., 1997; Sampson & Groves, 1989). The latter suggests an indirect association where the effect of immigration on crime operates mainly through an intervening mechanism, which is more proximally associated with expressions of criminal deviance. In either case, additional research is necessary to flesh out how to best measure this important process.
As is the case with any study that focuses on communities within a single city, our findings are limited in terms of their generalizability. We strongly urge future research to test these associations using data for different cities and/or different points in time. This is especially true for research on residential redlining due to the known variation in the “creation and implementation of HOLC maps” across cities (Lyons et al., 2023; p. 13). Further, the size and diversity of Miami-Dade County's foreign-born population coupled with the modified geographical coverage, give more reason to question the generalizability of our findings. Because there is so little existing criminological research on redlining, we do believe that our findings should be considered generalizable; instead, we see this study as an early contribution to a nascent, but growing, body of literature. It is through the accumulation of findings that foundational (i.e., generalizable) understandings are built.
Setting the limitations aside, our study represents one of the first longitudinal analyses to consider the effect of HOLC's exclusionary residential policies on community homicide levels. Without exception, the results from our primary and supplemental analyses find that redlined communities experienced significantly more homicides than non-redlined communities. However, our study also shows immigrant concentration to moderate the relationship between redlining and homicide levels. That is, we identify an additional ameliorative effect of immigration among redlined neighborhoods. We offer no definitive conclusions, but we hope that the findings from this study can be used to inform policy debates as well as future academic research on the topic. Most importantly, we believe our study underscores the need for continued research on the interplay between these factors as a means of “understanding the many ways in which immigration prevents crime” (Lee & Martinez, 2009: 15).
We conclude by noting the indelible influence and continuing relevance of Du Boi'’s (1899) scholarship on communities and crime. His legacy serves as a reminder of the importance of understanding that the contemporary neighborhood conditions, such as levels of lethal violence, continue to be affected by historical inequalities. Further, our longitudinal analyses, over a period of 50 years, focus on the social and economic variation within places and how factors such as race and community disadvantage emerge as some of the strongest predictors of homicide. Du Bois also portrayed communities as dynamic, rather than static, entities, a point which is also supported by the present research. Our study also highlights the need for researchers to continue differentiating between the historical and contemporary effects of neighborhood conditions on levels of homicide. There is little question that violence is profoundly shaped by community conditions and we believe W. E. B. Du Bois would argue that the deadly consequences associated with residential redlining remain a research subject worthy of scholarly attention.
Footnotes
Declaration of conflicting interests
The author(s) declared no potential conflicts of interest with respect to the research, authorship, and/or publication of this article.
Funding
The author(s) received no financial support for the research, authorship, and/or publication of this article.
Notes
Author Biographies
Appendix A: Research Area Based on Census Tract Layout in Miami-Dade County,1950.
Appendix B. Descriptive Statistics for Homicides,Social Structural,and Compositional Qualities for Negatively Assessed HOLC Communities,Miami-Dade County,Florida,1970–2010.
| Total µ/σ [range] | Redlined µ/σ [range] | Negatively affecteda µ/σ [range] | ||
|---|---|---|---|---|
| Total homicides | 8.29/12.87 | 17.43/20.42 | 12.82/16.45 | *** |
| [0.00–121.00] | [0.00–121.00] | [0.00–121.00] | ||
| Adult/Child ratio | 5.68/9.26 | 3.56/3.35 | 4.12/3.32 | *** |
| [0.00–158.29] | [1.11–47.78] | [0.00–47.78] | ||
| Neighborhood Diversity Index | 0.38/0.17 | 0.47/0.20 | 0.42/0.19 | *** |
| [−0.22–0.88] | [0.06–0.88] | [−0.15–0.88] | ||
| % White | 0.34/0.31 | 0.12/0.13 | 0.19/0.21 | *** |
| % Black | 0.19/0.31 | 0.40/0.38 | 0.27/0.36 | *** |
| % Asian | 0.01/0.02 | 0.01/0.01 | 0.01/.02 | *** |
| % Professional employment | 0.26/0.16 | 0.17/0.10 | 0.20/0.14 | *** |
| [0.02–0.79] | [0.02–0.58] | [0.02–0.72] | ||
| Disadvantage Index | 0.34/1.10 | 1.29/1.07 | 0.94/1.10 | *** |
| [−1.73–5.00] | [−1.16–5.00] | [−1.60–5.00] | ||
| % Poverty | 0.20/0.13 | 0.30/0.15 | 0.26/0.13 | *** |
| Residential stability | −0.06/0.99 | −0.22/0.89 | −0.22/0.95 | *** |
| [−3.36–2.87] | [−1.87–2.11] | [−2.19–2.11] | ||
| % Same House > 5 years | 0.49/0.14 | 0.50/0.12 | 0.49/0.13 | |
| % Owner Occupied | 0.48/0.25 | 0.35/0.18 | 0.39/0.21 | *** |
| Immigrant concentration | −0.00/1.93 | 0.03/2.28 | 0.41/2.23 | *** |
| [−4.29–4.54] | [−4.29–3.57] | [−4.29–4.54] | ||
| % Foreign-born | 0.45/0.23 | 0.44/0.26 | 0.48/0.26 | *** |
| % Latino | 0.45/0.33 | 0.47/0.35 | 0.53/0.34 | *** |
| N | 1,203 | 215 | 585 | |
*p < .05; **p < .01; ***p < .001.
Includes neighborhoods that received “C” or “D” ratings.