
Abstract
Background
Surgical treatment of proximal femoral fractures typically involves fixation with intramedullary nailing or sliding hip screws, where screws inserted into the femoral head stabilize the fracture site. However, few studies have quantitatively assessed the distribution of bone density and quality within the femoral head. We investigated the distribution of bone mineral density (BMD) within the proximal femoral head, evaluated inter-patient variability, and examined associated factors based on computed tomography (CT) values.
Methods
This multicenter prospective observational study included 100 patients with femoral trochanteric fractures. Preoperative CT images were obtained from the first lumbar vertebra to the distal end of the femur. Using 3D Slicer (version 7), the proximal uninjured femur was segmented and reconstructed into a 3D model. The volume and CT values (Hounsfield units [HU]) of the proximal femur and femoral head were measured. Additionally, CT values were used to assess the bone volume and distribution of low bone-density areas (0-100 HU) and high bone-density areas (≥300 HU) in the femoral head.
Results
The average bone volume and CT values of proximal femur and femoral head were 90,641 mm3 and 94 HU, and 32,316 mm3 and 131 HU, respectively. The volume of the femoral head with CT values ≥300 HU was 2967 mm3, accounting for 9.1% of the total volume (range: 0.1%-32.6%), with a distribution observed along the central region of the femoral head, particularly along the principal compressive trabeculae. Additionally, the average CT value of the femoral head (<100 HU, ≥300 HU) correlated with bone volume.
Conclusion
A distribution of CT values within the femoral head is characteristic of patients with femoral trochanteric fractures. Using HU values from CT imaging to predict bone fragility preoperatively may aid in assessing the risk of postoperative complications.
Keywords
Introduction
Femoral trochanteric fractures are among the most common fragility fractures in patients with osteoporosis.1,2 The standard treatment involves lag screw fixation using a short femoral nail and sliding hip screw.3-5 Although fracture treatment has been standardized, complications are reported in approximately 2%-20% of patients, which can hinder early postoperative mobilization.6-8 Various patient-related and surgical factors contribute to these complications.6,9 A significant patient-related factor is decreased bone quality in the proximal femur, which can lead to fragility at the fracture site and impede stabilization of the femoral head, as it weakens the gripping force of the lag screw. However, few studies have quantitatively assessed the bone quality of the proximal femur.
Patients with femoral trochanteric fractures are hypothesized to have reduced bone mineral density (BMD). Positioning the lag screw in the center or lower part of the femoral head is crucial for grasping the femoral head and stabilizing the fracture. However, the distribution of BMD within the femoral head and the differences among patients have not been investigated in detail. Given that BMD may vary significantly among patients with osteoporosis, the distribution of BMD within the femoral head may also differ greatly between individuals. Furthermore, BMD in the femoral head is not uniform, as various trabeculae contribute to its distribution in response to mechanical stress. However, few studies have conducted a detailed investigation into the distribution of BMD within the femoral head.
In this context, the present study investigated the distribution of BMD within the proximal femoral head, assessed the differences in BMD among patients, and examined the factors associated with its distribution.
Methods
Patient Selection
This multicenter prospective observational study was conducted at three hospitals in Japan. All patients provided written informed consent. The study was approved by the relevant institutional review board and adhered to the tenets of the Declaration of Helsinki.
Data were prospectively collected from patients diagnosed with femoral trochanteric fractures who underwent intramedullary nail surgery between May 2021 and September 2022 after providing written informed consent. Of the 189 consecutive patients, 100 were included in the study after excluding those with incomplete preoperative imaging, missing data, or prior intramedullary nail surgery on the contralateral hip (Figure 1). Flowchart of Patient Selection
The inclusion criteria were as follows: patients aged 45 years or older at the time of surgery; patients deemed suitable to undergo initial intramedullary nail fixation with or without bone cement augmentation; patients (or their legally authorized representatives, such as a spouse or guardian) who provided written informed consent; and patients who, either independently or with the support of their representative, were judged by the principal investigator or a sub-investigator to have the willingness and ability to comply with the surgical and research procedures (eg, responding to a Japanese language questionnaire).
The exclusion criteria were as follows: women who were pregnant or breastfeeding; Patients with obvious deformities of the femoral head or acetabulum; patients scheduled to undergo surgery with bone augmentation using artificial bone; patients whose contralateral femur had already been enrolled in this study; patients with amputation of the contralateral femur; and patients with a history of open reduction and internal fixation of the affected femur.
As this study sought to evaluate bone mass in femoral trochanteric fractures quantitatively, the primary outcomes were bone volume (mm3) and CT values (Hounsfield units; HU) of the unaffected femoral head and proximal femur, as well as the BMD distribution in the healthy femoral head and proximal femur. Secondary outcomes included the correlation of bone volume and CT values of the femoral head and proximal femur with height, weight, body mass index (BMI), fracture type, and laboratory data (total protein, albumin, and C-reactive protein [CRP]). The fracture types were classified using the Association of Osteosynthesis (AO) classification. Laboratory data collected at the time of admission were analyzed. Postoperative complications, such as telescoping and cutout, were assessed 6 months post-surgery. Patients were divided into two groups, based on the presence or absence of postoperative complications. CT values and bone volumes of the femoral head and proximal femur were compared within and between the groups.
Image Analysis
To evaluate bone volume and CT values, a preoperative CT scan (120 kV, 300 mA, 1.0 mm slice thickness) was performed from the first lumbar vertebra to the distal femur. Using 3D Slicer software (version 5.6.2; https://www.slicer.org/), the proximal femur on both sides was segmented for each slice. Segmentation was performed manually on a slice-by-slice basis using coronal, sagittal, and axial CT images obtained at the time of admission. Care was taken to ensure that cortical bone was excluded, and only cancellous bone regions were extracted. All segmentation procedures were carried out by a single board-certified orthopedic surgeon for all 100 cases.
The segmented proximal femur was then reconstructed into a 3D model, and the volume and CT values (in HU) of the proximal femur and femoral head were measured. The distal boundary of the proximal femur was defined as the inferior margin of the lesser trochanter for all measurements (Figure 2). Segmentation and Distribution of Computed Tomography (CT) Values of the Femoral Head and Femoral Trochanteric Region. A-D: Plain CT Images of the Femoral Head and Proximal Femur Taken Using 1 mm Slices Were Segmented and Converted to Three-Dimensional Images. The Range of CT Values was Defined as Follows, and the Volume (mm3) and CT Values (HU) Within This Range Were Measured. The Distributions in the Femoral Head and Proximal Femur Were Color-Coded according to the Range of CT Values (100, 200, and 300 HU)
To assess the distribution of BMD within the femoral head and proximal femur, CT values were categorized into four ranges: <100 HU, 100-200 HU, 200-300 HU, and ≥300 HU. Bone volume and distribution location were evaluated within these ranges. Low-density regions were defined as those <100 HU and high-density regions were defined as those ≥300 HU (Figure 2). The volume and percentage of each region were measured within the femoral head and proximal femur, respectively.
Statistical Analysis
Pearson’s correlation coefficients were calculated to assess the relationship between the fracture type with the CT values and volumes of the femoral head and proximal femur. Pearson’s correlation coefficient was also used to assess the correlations of CT values and bone volumes of the femoral head and proximal femur with age, height, weight, and BMI. Additionally, we evaluated the correlation between the fracture type and CT values or bone volume of the femoral head and proximal femur for each CT value distribution defined in this study using Pearson’s correlation coefficient. The Wilcoxon signed-rank test was used to evaluate the characteristics of patients with and without complications. In this study, a total of 100 cases were analyzed, and both the statistical power and sample size were considered adequate.
Results
Demographic Data of Patients in This Study

Data are presented as numbers or mean (range).

Comparison of Bone Volume (mm3) and Computed Tomography (CT) Values (HU) of the Femoral Head and Proximal Femur Between the Uninjured and Injured Sides. A-D: Bone Mass and CT Values of the Uninjured and Injured Sides of the Entire Proximal Femur and Femoral Head Were Strongly Correlated in 20 Cases of Femoral Trochanteric Fractures
Mean Volume and Computed Tomography (CT) Values of the Femoral Head and Proximal Femur

CT, computed tomography; HU, Hounsfield units.
Coefficients of Correlation (R) of Patient Background With CT Values of the Femoral Head and Proximal Femur and Bone Mass

BMI, body mass index; CT, computed tomography.
The mean volume of the femoral head with CT values <100 HU was 14,090 mm3 (1529-27,422 mm3), and that with CT values ≥300 HU was 2967 mm3 (35.2-33,390.7 mm3). The volume of the femoral head with CT values ≥300 HU represented an average of 9.1% of the total femoral head volume, ranging from 0.1% to 32.6% across cases (Figure 4). A negative correlation was observed between the mean CT value and bone volume in femoral heads with CT values <100 HU (r = −0.81), whereas a positive correlation was found for CT values ≥300 HU (r = 0.79) (Figure 5). Percentage of Femoral Head With Computed Tomography (CT) Values ≥300 HU. The Volume of the Femoral Head With CT Values ≥300 HU Ranged From 0.1% to 32.6% Across the Cases Correlation Between Mean Computed Tomography (CT) Values of the Femoral Head and Proximal Femur and the Volume of the Femoral Head and Proximal Femur With CT Values ≥300 HU and <100 HU. A-D. A Negative Correlation was Observed Between the Mean CT Value of the Femoral Head and Bone Volume in Femoral Heads With CT Values <100 HU (r = −0.81), while a Positive Correlation was Found for CT Values ≥300 HU (r = 0.79). A Negative Correlation was Found Between the Mean CT Value of the Entire Proximal Femur and Bone Volume in Areas With CT Values Below 100 HU (r = −0.53). A Positive Correlation was Observed Between the Mean CT Value of the Proximal Femur and Bone Volume in Areas With CT Values ≥300 HU (r = 0.90)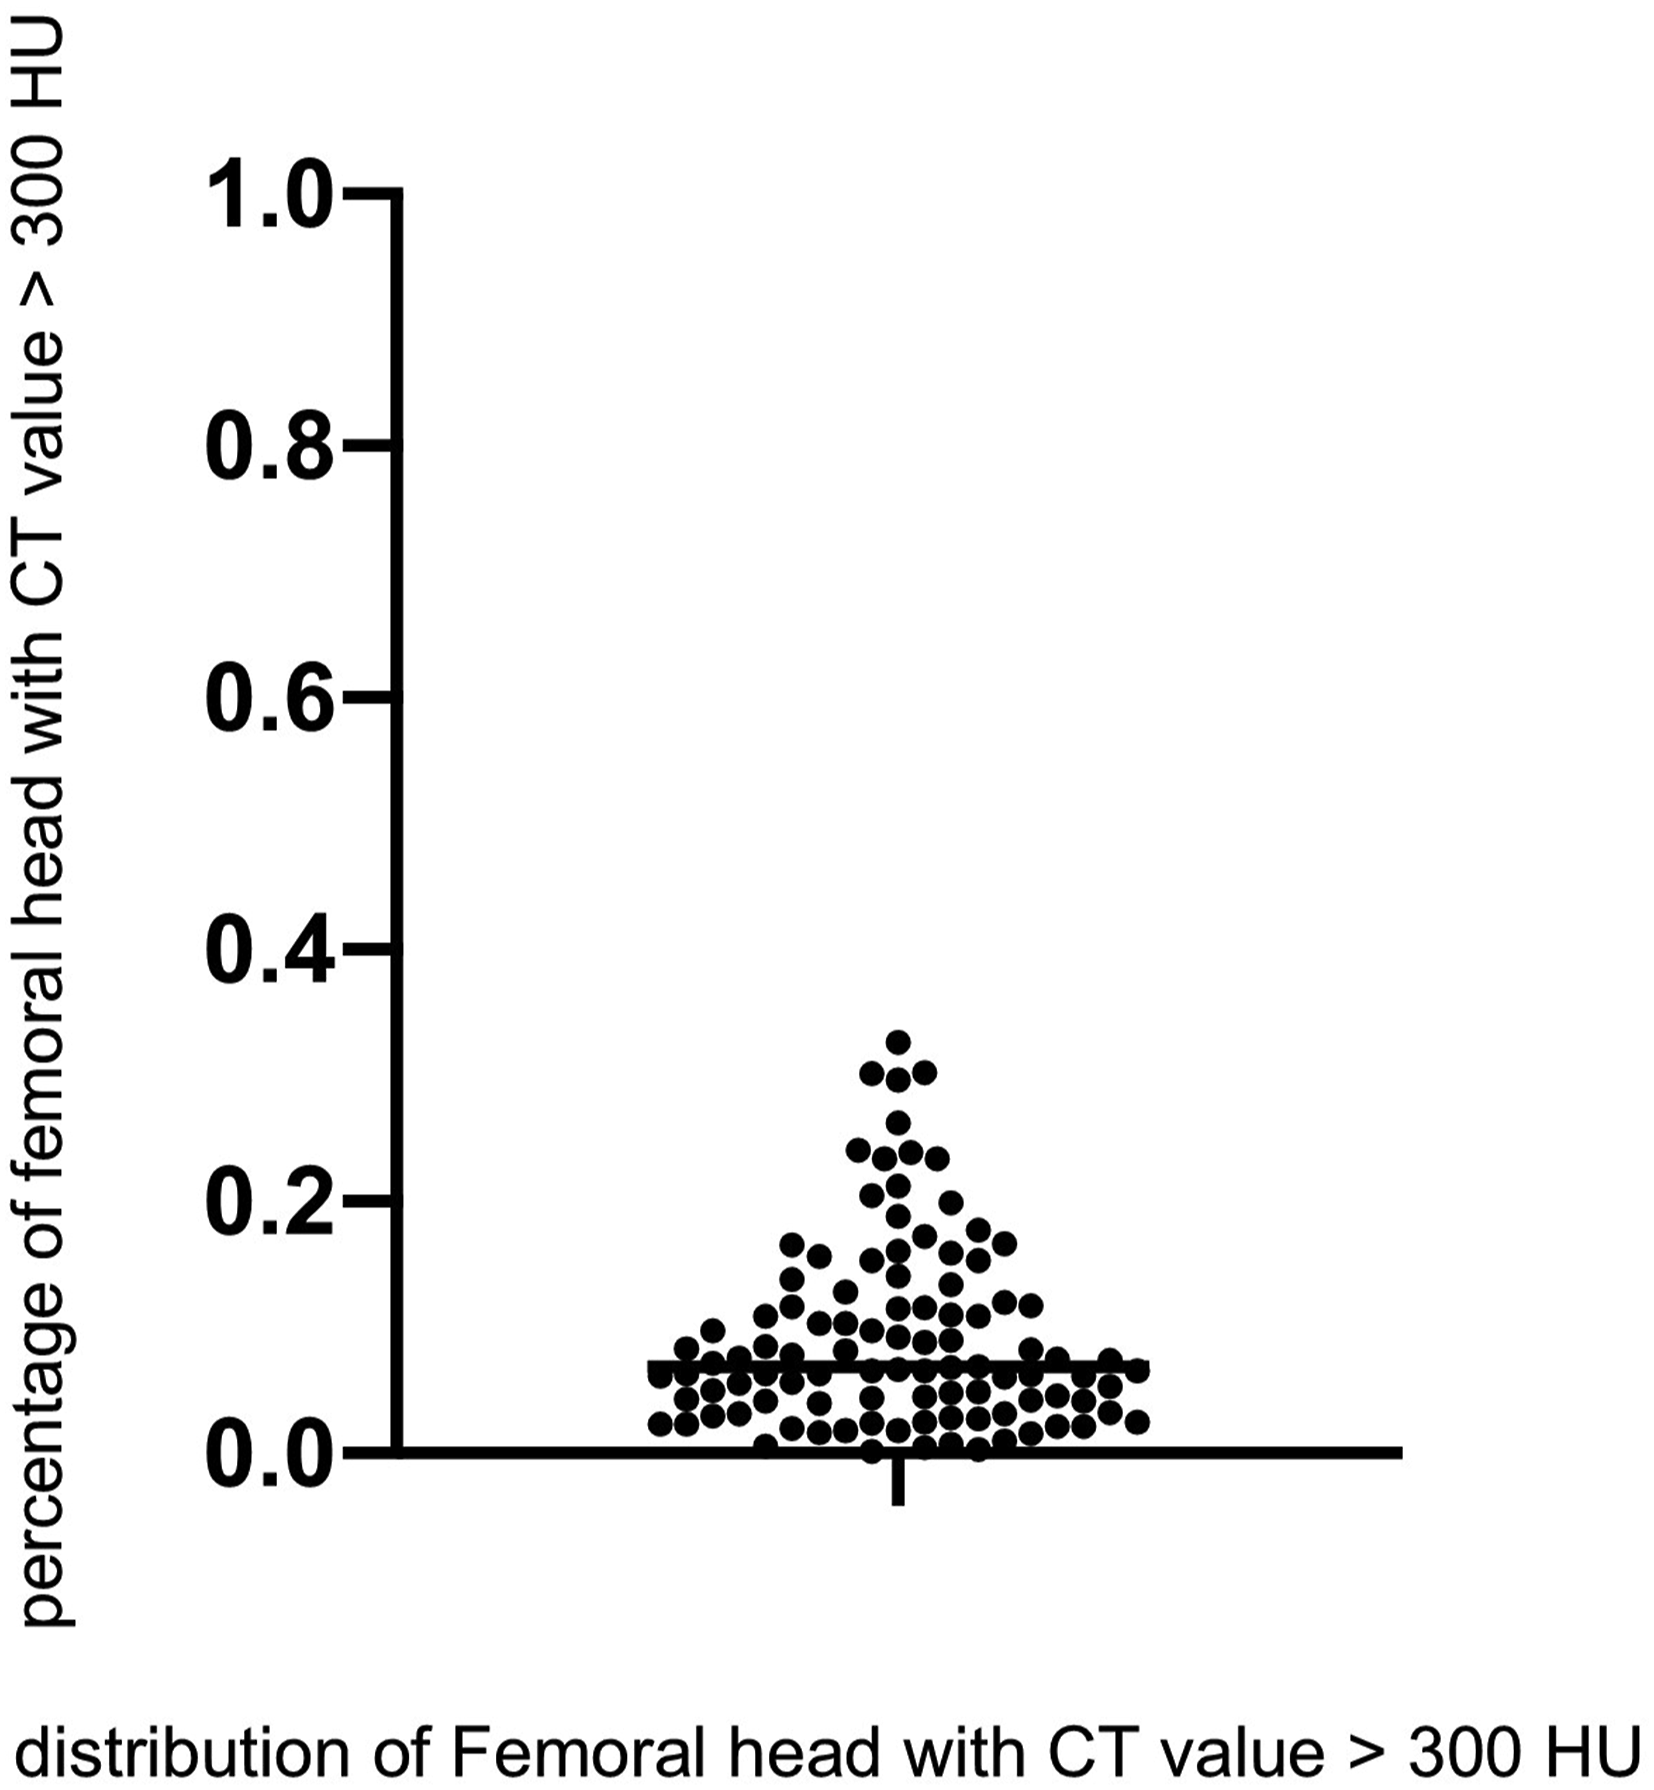

For the proximal femur, the mean volume with CT values <100 HU was 55,122 mm3 (56,388-165,169 mm3), and the mean volume with CT values ≥300 HU was 7772 mm3 (1326-71,554 mm3). The proportion of proximal femurs with CT values of ≥300 HU averaged 8.5%, ranging from 1.5% to 33.5%. A negative correlation was found between the mean CT value of the entire proximal femur and the bone volume in areas with CT values <100 HU (r = −0.53), while a positive correlation was observed between the mean CT value and bone volume in areas with CT values ≥300 HU (r = 0.90) (Figure 5).
Coefficients of Correlation (R) of Laboratory Data With the Bone Mass of the Femoral Head and Proximal Femur
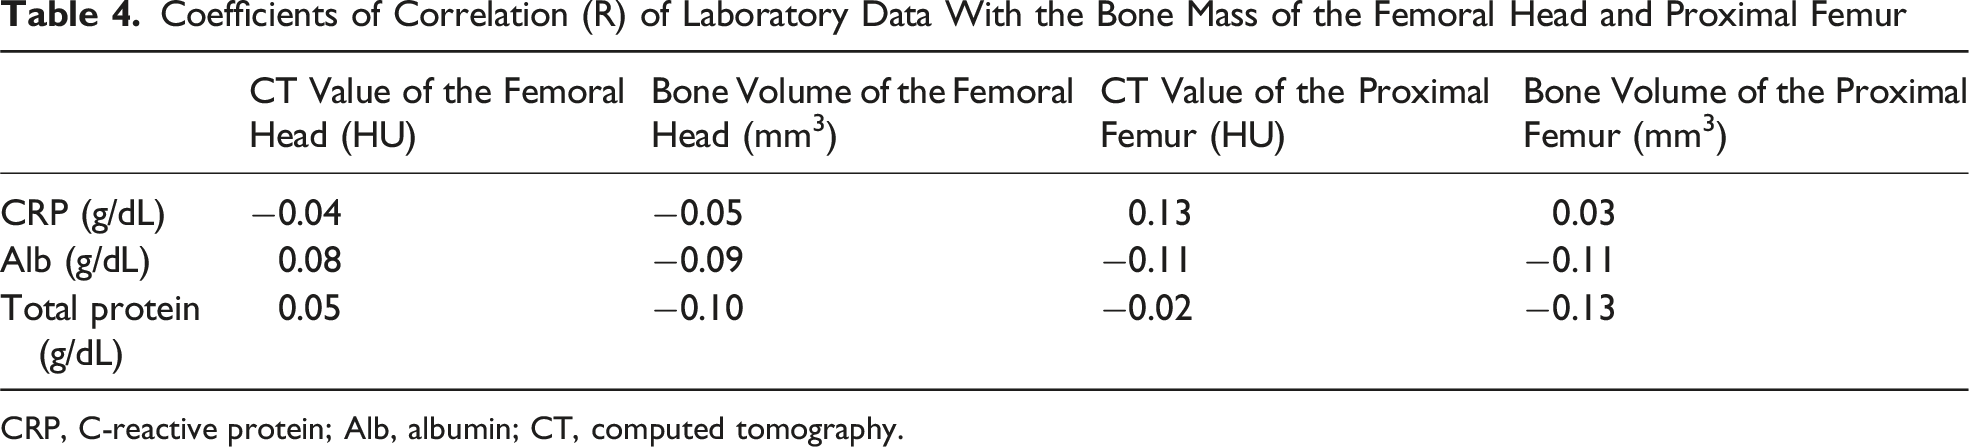
CRP, C-reactive protein; Alb, albumin; CT, computed tomography.
High-density areas with CT values ≥300 HU were identified along the main compressive trabeculae of the proximal femur (Figure 6). Among the 100 cases, the distribution of CT values ≥200 HU was compared among the cases with the highest, median, and lowest mean CT values. As the mean CT value of the proximal femur decreased, the distribution of CT values ≥200 HU became increasingly restricted to the main compressive trabeculae (Figure 7). The volume of the main compressive trabeculae decreased as the mean CT value of the proximal femur decreased. The highest volume of the main compressive trabeculae was 21,481.4 mm3, the median volume of the main compressive trabeculae was 12,942.1 mm3, and the lowest volume of the main compressive trabeculae was 11,200.6 mm3. Distribution of Computed Tomography (CT) Values in the Proximal Trochanteric Femur. The proximal trochanteric femur was color-coded according to the range of CT values. Coronal images show axial images at each number Distribution of Computed Tomography (CT) Values ≥200 HU in the Proximal Trochanteric Femur. A–F. Comparison of Mean CT Values of the Entire Proximal Femur. Comparison of the Distribution of the Mean CT Values of the Entire Proximal Trochanteric Region With HU ≥200 for the Smallest Median CT Value and the Largest Proximal Femur CT Value, Respectively

Background of Patients With and Without Complications

AO, Association of Osteosynthesis; BMI, body mass index; Alb, albumin; CRP, C-reactive protein.
Comparison of the Femoral Head Volume and CT Values With the Presence or Absence of Complications

P values were determined using the Wilcoxon signed-rank test (two-sided test).
Discussion
In the present study, we investigated the BMD distribution and CT values in the proximal femur of patients with femoral trochanteric fractures. We demonstrated that the CT values in the proximal femur and femoral head were not uniform, with limited areas of higher CT values. Cases in which the average CT value within the femoral head was low had fewer areas with high CT values, and these high CT value regions, which are considered to have a high bone density, tended to concentrate in the main compressive trabeculae. Specifically, in our case series, CT values in the proximal femur and femoral head did not correlate with body type, femoral head volume, or fracture type.
Under the assumption that higher CT values represent better bone quality, predicting bone quality is difficult without directly measuring HU values based on preoperative CT. Among patients with femoral trochanteric fractures, those with more pronounced bone fragility have fewer regions with good bone quality, raising concerns that lag screws in these patients may not be able to achieve an adequate bone grip on the femoral head. To improve bone grip with lag screws in such patients, not only must the screws be inserted into regions with good bone quality, but augmentation of the femoral head (eg, with hyaluronic acid or bone cement) should be considered.9-11
Although surgical methods for femoral trochanteric fractures are well established, lag screw cutout complications have been reported.6,7,12-14 The occurrence of such complications is a significant factor delaying early ambulation and potentially worsening patient mobility, particularly in older patients for whom early postoperative mobilization is emphasized. Therefore, adequate preventive measures are necessary before surgery. Bone quality is a significant factor in lag screw cutout complications. 15 CT value quantification of the femoral head, as done in this study, could be useful for screening patients who are at risk of experiencing lag screw cutout. However, in our study, there was no significant difference in the distribution of CT values between cases with complications and those without. This suggests that complications are not solely attributable to bone fragility but likely influenced by multiple confounding factors, including the reduction position of the proximal fragment, rotational instability, the insertion position of the lag screw, the entry point of the intramedullary nail, and the presence of a posterolateral fragment. Therefore, further investigations with a larger sample size will be necessary to more thoroughly examine the relationship among these factors, particularly the position of lag screw insertion, and the occurrence of complications.
In patients with proximal femoral fractures, measuring post-fracture BMD is difficult because of severe pain or cognitive impairment; therefore, bone fragility should ideally be assessed using other methods. One predictive approach for bone fragility involves evaluating patient background, with some studies reporting a positive correlation between body weight and bone density.16,17 However, in this study, CT values in the proximal femur and femoral head did not correlate with the body type. This may be attributed to the high average age of our study population (88.8 years). Indeed, as all patients had sustained femoral trochanteric fractures, we infer that their bone fragility was not associated with body type. Although the fracture type did not correlate with CT values, the substantial external force and rotational load on the hip joint likely influenced the fracture type more than did individual variations in bone quality. In addition, Emir et al. reported a cutoff value of 83.5 HU for predicting fracture risk, based on CT values measured at the level of the lesser trochanter. 18 The average CT value in the proximal femur of our patients was 94.3 HU, and a previous report on the relationship between proximal femoral fractures and CT values suggested that a CT value of less than 112 HU in the proximal femur is associated with a higher likelihood of fracture. 17 This explains the bone fragility observed in our patients. Additionally, the threshold for osteoporosis in the hip joint has been reported to be between 198.24-296.15 HU, 19 indicating that our patient group had severe osteoporosis. Within this fragile group, patients with varying levels of bone volume were found. Therefore, preoperative CT scans and quantification of CT values could be useful for identifying patients with lower bone quality within the fragile group. Measuring the average CT value of the femoral head could be a simple way to predict bone fragility and identifying regions with poor bone quality.
In this study, the CT value thresholds were established to stratify bone fragility based on previous studies. Donna et al. reported thresholds of 170 HU for normal bone and 120 HU for osteoporotic bone, while Zaidi et al. reported a threshold of 110 HU for osteoporosis. Based on these findings, we defined the CT value thresholds as 100, 200, and 300 HU.20,21
In our patient group, the distribution of the CT values in the femoral head and proximal femur was distinctive, with areas of high CT values consistently located in the main compressive trabeculae. Regions with high CT values (HU ≥300) in the femoral head comprised only about 10% of the total femoral head volume. In cases with low average CT values, the volume of regions with high bone density was reduced. Previous reports have identified high bone-density regions in the superomedial part of the femoral head. However, in our study, 22 high CT values were observed along the main compressive trabeculae, extending inferiorly. According to the Singh classification, with increasing age, trabeculae subjected to low stress loads undergo atrophy, leaving only the main compressive trabeculae, which eventually leads to an increased risk of proximal femoral fractures due to a lack of stress dispersion. 23 In this study, we also observed areas with high CT values in the main compressive trabeculae in all patients with femoral trochanteric fractures. When comparing regions with average CT values of ≥200 HU in the femoral head, we found that regions with high CT values were more likely to be limited to the main compressive trabeculae in the group with lower average CT values. This suggests that, when inserting a lag screw, targeting the main compressive trabeculae is essential. The recommended insertion site for the lag screw is the central part of the femoral head rather than the inferior part, as the central region overlaps with both the main compressive and tensile trabecular regions, providing better bone grip. 24 In cases with high average CT values, the main tensile trabecular mass may still be present, but in cases with low average CT values, only the main compressive trabeculae may remain. Therefore, insertion of lag screws should be tailored to each patient’s bone structure, and the insertion positions used in cases with low average CT values should be carefully considered. Postoperative complications following femoral trochanteric fractures are likely influenced by various factors that cannot be explained solely by bone fragility at the time of injury. In order to reduce the risk of complications related to surgical technique, such as the insertion position of the intramedullary nail and lag screw, it may be beneficial to understand the BMD distribution within the proximal femur prior to surgery.
This study had several limitations. In this study, there were only eight male patients, which is substantially fewer than the number of female patients. Therefore, the possibility of sex-related bias in our results cannot be excluded. Investigating differences in the distribution of BMD within the femoral head based on sex remains an important issue for future research.
CT values were used as an indicator of BMD; however, the role of HU values in osteoporosis diagnosis has not been validated against gold-standard methods such as dual-energy X-ray absorptiometry. Future studies should include comparative analyses to confirm this correlation.
The CT values measured in the femoral head did not correlate with the occurrence of lag screw cutout complications. Lag screw cutout complications have multifactorial causes, and factors such as fracture type, postoperative reduction, and insertion position of the intramedullary nail are believed to play a significant role. While quantification of average CT values in the femoral head is useful for evaluating bone quality, further refinement and application of these measurements during surgery are needed to prevent cutout, which remains an area for future research.
Conclusion
This study showed that regions of good bone quality within the femoral head are limited to the main compressive trabecular areas and that, in patients with low average CT values within the femoral head, these regions of good bone quality are even more localized. In patients with femoral trochanteric fractures, bone fragility may be predicted preoperatively using HU values from CT images, which can serve as useful indicators for assessing the risk of postoperative complications.
Footnotes
Acknowledgement
The authors would like to express their appreciation for the crucial role of Associate Professor Hyonmin Choe and thank the staff of Elsevier for their assistance with language editing.
Ethical Approval
This multicenter prospective observational study was conducted at three hospitals. The institutional review boards of these centers approved this study, which was conducted in accordance with the tenets of the Declaration of Helsinki. This study approved by the institutional ethical review board of our hospital (approval No. B210100009).
Consent to Participate
Patients provided informed consent to participate. Written consent was obtained from all participants.
Consent for Publication
Informed consent for publication was obtained from the participants or their legally authorized representatives. Non-essential identifying details have been omitted to protect the privacy of the participants. The authors hold written informed consent.
Author Contributions
Hyonmin Choe designed the study and the main conceptual ideas. Kazuyoshi Yamamoto, Kousuke Matsuo and Hiroyuki Makita collected the data. Hyonmin Choe, Masahiro Matsumoto, Koki Abe, Naomi Kobayashi, and Yutaka Inaba aided in interpreting the results and worked on the manuscript. Daisuke Enomoto wrote the manuscript with support from Hyonmin Choe and Masahiro Matsumoto. Yutaka Inaba supervised the project. All authors discussed the results and commented on the manuscript.
Funding
The authors received no financial support for the research, authorship, or publication of this article.
Declaration of Conflicting Interest
The authors declare no potential conflicts of interest with respect to the research, authorship, or publication of this article.
Data Availability Statement
All data generated or analyzed during this study are included in this published article and its supplementary information files.