
Abstract
Introduction:
In this study, we evaluated how muscle mass and bone density affect postoperative functional scores and subsequent fracture rates and investigated the correlation between sarcopenia and osteoporosis by measuring preoperative psoas muscle indices (PMIs) and bone mineral densities (BMDs) in elderly patients followed for more 1 year after surgical treatment for hip fracture.
Methods:
Among patients older than 65 years who underwent surgery for hip fracture from January 2009 to November 2018, 154 patients with preoperative 3D pelvic bone computed tomography and dual-energy X-ray absorptiometry BMD data and followed postoperatively for at least 1 year were considered for the present study. One hundred twenty-six patients were finally included. These patients were divided into 4 groups based on PMIs and T-score, that is, to osteoporosis, sarcopenia, osteosarcopenia, or normal groups. To analyze outcomes after surgery, we measured functional activity levels using the Barthel index and Harris hip score (HHS) systems. In addition, we compared the rates of subsequent hip fracture ratio with patient’s characteristics, and analyzed the correlation between PMIs and BMDs using Pearson correlations analysis.
Results:
Barthel index and HHS score showed significant differences between the normal and osteosarcopenia group at 6 weeks, 3 months, and 1 year after surgery (P < .001). Subsequent fracture incidences were significantly higher in the osteosarcopenia group than in the normal group (P = .046), and T-score and PMI were found to be strongly correlated (a < 0.01; R = 0.763).
Conclusion:
Postoperative functional outcomes were significantly poorer and the subsequent fracture rate was significantly higher in the osteosarcopenia group than in the normal group. In addition, sarcopenia and osteoporosis were found to be highly correlated.
Backgrounds
Sarcopenia is defined as a decrease in muscle strength at the same time as loss of muscle mass with aging, and osteoporosis is defined as a systemic skeletal disease characterized by a decrease in bone mass and abnormalities in microstructure. Various studies related to sarcopenia have been conducted since Baumartner et al 1 presented the criteria for sarcopenia in 1999. But unlike osteoporosis, there are no standardized diagnostic criteria yet.
In patients with acute or chronic disease, sarcopenia and osteoporosis can lead to unsuccessful clinical outcomes. 2 In recent years, several studies for relationship between osteoporosis and sarcopenia have addressed. However, most of these studies were conducted on patients with medical comorbidities such as cancer, and relatively few have examined how osteosarcopenia affects the clinical outcomes of elderly trauma patients after surgery.
The incidence rate of hip fractures has increased over recent years, and despite the progress made to improve surgical treatment and rehabilitation regimes, mortality and complication rates remain high. Approximately 80% of elderly patients depend on a cane to walk for at least 12 months after undergoing surgery for hip fracture. 3
In this study, we investigated how muscle mass and bone density affect postoperative functional scores and subsequent fracture rate and the correlation between psoas muscle indices (PMIs) and bone mineral densities (BMDs) in elderly patients followed for more than 1 year after surgical treatment for hip fracture.
Methods
Patient
The 154 elderly (>65 years) hip fracture patients who had undergone preoperative evaluation by 3-dimensional (3D) pelvic bone computed tomography (CT) and by BMD scan from January 2009 to November 2018 with a minimum of follow-up of 1 year were initially considered for this retrospective study. Of these 154 patients, 5 patients with evidence of malignancy by preoperative CT, 7 with accompanying lower extremity weakness due to previous stroke, and 16 unable to cooperate (due to dementia, delirium, depression, or other conditions) were excluded. Thus, this retrospective study was conducted on 126 patients (23 males and 103 females; Figure 1). Radiologic images were accessed using a Picture Archiving and Communication System (PACS). Preoperative general conditions were classified using the American Society of Anesthesiologists (ASA) classification system. This research, including patient selection and data collection, was conducted after obtaining approval from the Inha University Hospital Institutional Review Board (IRB INHA 2019-12-050).

Study patient flow chart.
Evaluation
Computed tomography scans and BMD measurements were performed preoperatively to determine the presence of osteoporosis or sarcopenia. Total psoas area measured in CT images was used as a surrogate of whole skeletal muscle mass, as previously described. 4,5 All CT images were evaluated by a radiology specialist using PACS, and cross-sectional areas of both psoas muscles were measured in the axial plane at the level of the upper L3 body (Figure 2).

Measurement of psoas muscle index at the level of the third lumbar vertebra upper body on a computed tomography (CT) image. A, Axial plane CT image at the level of the upper L3 body. B, Details on measurements of cross-sectional areas of transversal psoas muscles thickness (transverse: continuous line, axial: dotted line).
Patient PMIs were calculated by dividing the summed cross sectional areas (cm2) of both psoas muscles divided by patient height squared (m2). The total PMIs of 126 patients satisfied the normal distribution statistically (mean ± standard deviation = 4.01 ± 0.48, confidence interval = 3.92 ∼ 4.09). Based on these result, in this study, it was defined as sarcopenia when it had a PMIs below mean value. Male and female patients were divided about average PMIs. Sarcopenia was defined as a PMI below average. Bone mineral densities were measured at femurs and lumbar spines (L1–L4) using dual-energy X-ray absorptiometry (Lunar Prodigy; GE Healthcare). Osteoporosis was defined as a T-score of < −2.5 according to the World Health Organization guideline. Using PMIs and BMD scores, patients were allocated to 1 of the 4 groups, as follows; the osteosarcopenia group (T-score ≤ −2.5 and low PMI), the sarcopenia group (low PMI and T-score >−2.5), the osteoporosis group (T-score ≤ −2.5 and high PMI), or the normal group (T-score >−2.5 and high PMI).
Seventy of the 126 study patients underwent internal fixation (IF). Eight had a nondisplaced transverse cervical fracture of femur, and 62 had a femur intertrochanteric fracture. The other 56 patients underwent bipolar hemiarthroplasty or total hip arthroplasty.
Each patient was assessed before surgery and followed for 6 weeks, 3 months, and 1 year after surgery. Functional activities (Barthel Indices, Harris Hip Scores [HHSs]) were evaluated at each visit.
The Barthel Index scores are used to assess the patient’s current level of ability for each of the following 10 items (bowels, bladder control, grooming, toilet use, feeding, transfer, mobility, dressing, stairs, bathing) and summed scores (maximum 100 points) were used to determine dependency. Shah et al suggested classifying Barthel Index scores as follows: 0 to 20 total functional dependency, 21 to 60 dependency, 61 to 90 moderate dependency, 91 to 99 as slight dependency, and 100 as total functional independence. 6
The HHS system was introduced by William Harris in 1969 to evaluate ability to conduct daily activities after hip surgery. 7 Scores are calculated by summing pain assessment and functional activity scores, and are considered to reflect ability to conduct daily activities. Harris hip scores are classified as follows: < 70 poor, 70 to 79 fair, 80 to 89 as good, and 90 to 100 as excellent. We also compared and analyzed group differences for fracture types, surgery types, and subsequent fracture rates.
Statistical Analysis
The osteosarcopenia and normal groups were compared with respect to sex ratio, subsequent hip fracture ratio after surgery, number of deaths at the minimum 1 year follow-up, and changes in HHS and Barthel Index scores 1 year after surgery. The correlation between BMD and PMI was analyzed using Pearson correlation coefficient analysis. The χ2 test was used to assess intergroup differences between categorical variables and the T-test, the Mann-Whitney U test, or analysis of variance were used to analyze numerical variables. Correlations between variables were analyzed using the χ2 test or Fisher exact test. Statistical analysis was performed using IBM SPSS Statistics for Windows version 19.0 (IBM Corp), and the significance level was set to P < .05 (both sides).
Result
Demographic data are shown summarized in Table 1. Percentages of study patients (23 men and 103 women) allocated to the normal group, osteoporosis, sarcopenia, and osteosarcopenia groups were 35.7%, 13.5%, 4.8%, and 46.0%, respectively.
Patient Demographic Data by Group.a

Abbreviations: A, arthroplasty; ASA, American Society of Anesthesiologists; BMI, body mass index; IF, internal fixation.
a Data are shown as numbers (%) or means ± standard deviations.
Sex ratios were significantly different in the 4 groups, but no significant differences were found between average ages, body mass indices, ASA classifications, mortality rate at the 1 year follow-up, fracture or surgery types, or subsequent fracture rates.
Comparisons of results of the normal and osteosarcopenia groups revealed notable differences (Table 2). Before surgery, differences of HHS score and Barthel Index score between 2 groups were not statistically significant (P = .092, P = 0.167, retrospectively) but mean Barthel Index score and HHS score in the osteosarcopenia group was significantly lower than in the normal group at 3-, 6-, and 12 months after surgery (P < .001). Moreover, subsequent fracture rates were significantly different in these 2 groups (P = .046).
Characteristics of the Normal and Osteosarcopenia Groups.
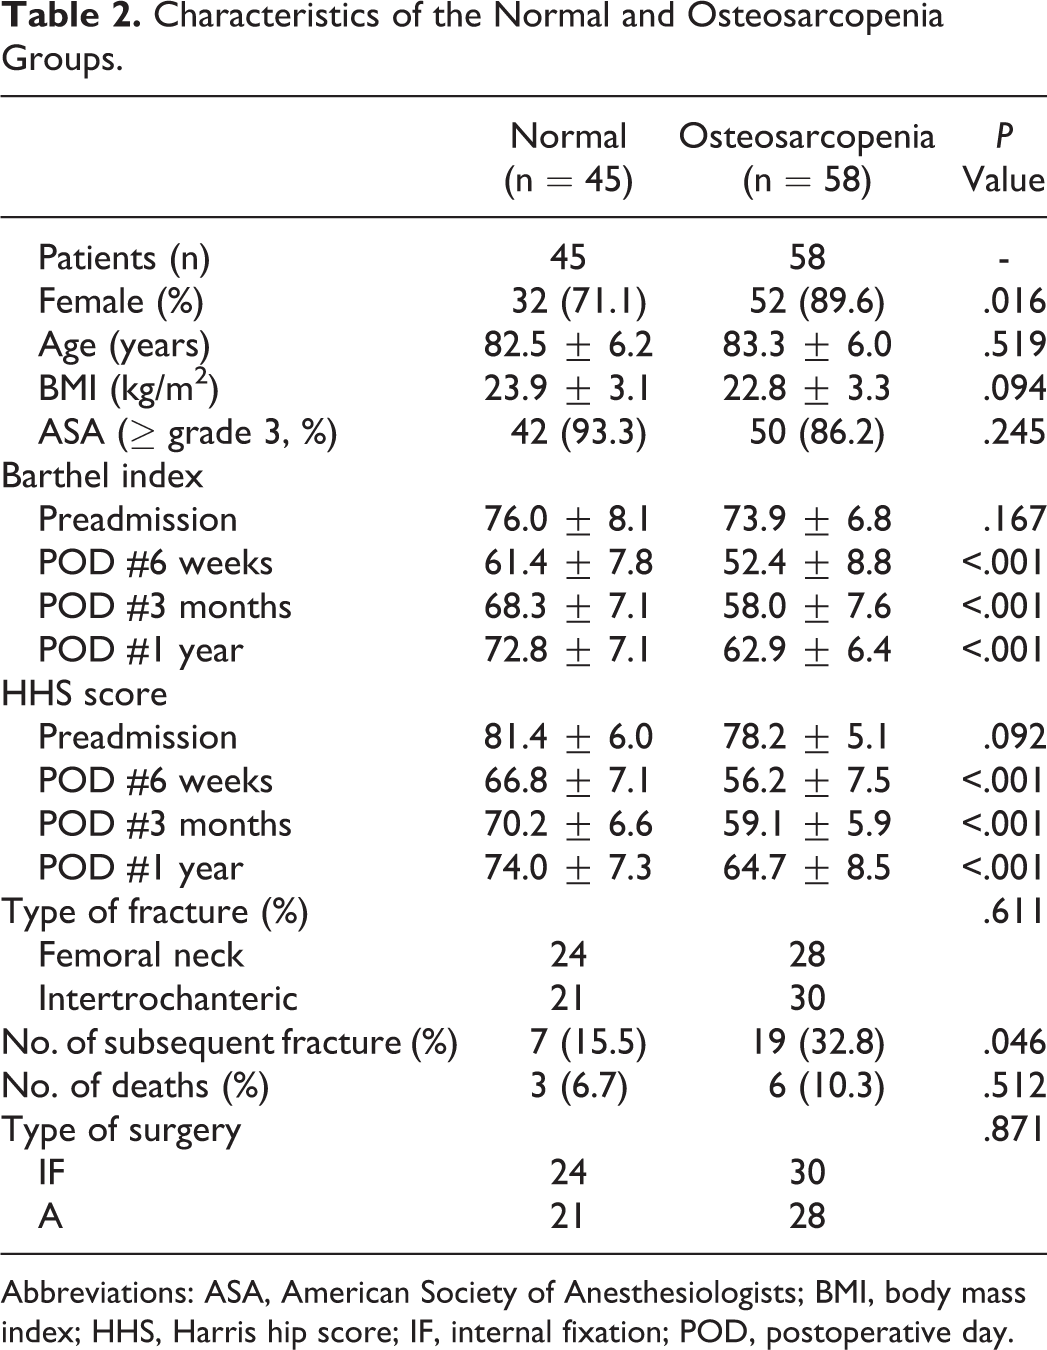
Abbreviations: ASA, American Society of Anesthesiologists; BMI, body mass index; HHS, Harris hip score; IF, internal fixation; POD, postoperative day.
The correlation between T-scores and PMIs of the 126 patients before surgery is shown in Figure 3, which shows PMIs increased linearly with T-scores. Pearson correlation coefficient analysis was used to confirm this positive correlation, and showed a significance level of P < .01 and a correlation coefficient (R) of 0.763, indicating a high level of correlation between T-scores and PMIs.

The linear relationship observed between T-scores and Psoas muscle indices (PMIs).
Discussion
Osteoporosis and sarcopenia are associated with unfavorable outcomes after the surgical treatment of hip fracture in the elderly. In our study, there were no significant difference between the postoperative 1 year mortality rate of osteosarcopenic and normal control group in our study (P = .512). However, Kim et al 8 reported a significant difference between the postoperative 5-year mortality rates of osteosarcopenic and normal controls (P = .028). In particular, their osteosarcopenia group (n = 45, mortality rate 82.7%) had a 30% higher mortality rate than the control group (n = 46, 52.7%). Yoo et al 9 reported a similar result in their study on 324 patients who underwent hip surgery. The postoperative 1-year mortality rate in their osteosarcopenia group was 15.1%, which was twice as high as that of the control group (7.8%) with a hazard ratio of 1.84 (P = .023). Several clinical studies have been conducted with the aim of preventing falls, which is of considerable concern in elderly patients with compromised mobility, and a recent study reported that the incidence of fracture was 10 times higher in patients with osteoporosis or sarcopenia than in those without. 10
We found no significant difference between Barthel Index scores and HHS scores in the osteosarcopenia and normal group before surgery, but mean Barthel Index was significantly lower and subsequent fracture rate was significantly higher in the osteosarcopenia group at 1 year after surgery. This result suggests that osteoporosis and sarcopenia are major factors of the recovery of daily living ability and function after hip fracture surgery in elderly patients.
In old age, hip fractures can occur after low-energy trauma, and are presumed to result from age-associated loss of muscle mass and bone density. Cook et al suggested that diminished protective reactions and muscular weakness as well as osteoporosis importantly contribute to hip fractures in the elderly. 11 Subsequently, various studies were conducted on the clinical importance of sarcopenia. A study in New Mexico concluded sarcopenia was a major risk factor of physical disability and that elderly with sarcopenia were at significantly higher risk of balance, daily living, and gait problems than those without. 1 Several researchers have suggested that sarcopenia is a predictor of low BMD, 12,13 though Hack et al reported no correlation between the two. 14 But, the studies subject to sarcopenia started 15 to 20 years later than those on osteoporosis and a criteria that define clinical sarcopenia is not yet standardized.
We conducted Pearson correlation coefficient analysis to investigate the nature of the relationship between preoperative BMDs and PMIs of 126 patients. The relationship was found to be positive and linear result with a significance level (P < .01) and a high correlation coefficient of R = 0.763. According to the correlation analysis classified by Dancey and Reidy, 15 a weak correlation exists if 0 < R < 0.4, moderate correlation exists if 0.4 ≤ R < 0.7, strong correlation exists if 0.7 ≤ R < 1, and a perfect correlation exists if R = 1. Thus, the result is meaningful as it shows a strong relationship exists between sarcopenia and osteoporosis.
Our results show efforts should be made to reduce the risk of fracture in elderly hip fracture patients after surgery by adopting active rehabilitation protocols that promote functional recovery during the early postoperative stage. Nevertheless, further study is required on active rehabilitation after hip surgery, as randomized studies on its effectiveness are lacking, and the majority of studies performed to date enrolled only small numbers of patients. It is evident that more attention should be paid to the treatment and prevention of fractures and sarcopenia in the elderly, and that a multicenter study should be undertaken with the aim of providing criteria that define clinical sarcopenia.
The present study has a number of limitations that warrant consideration. First, the data collection was conducted retrospectively and this may have introduced selection bias. Second, we could not evaluate muscle power or physical function due to the emergent nature of hip surgery, although the diagnostic criteria of sarcopenia include muscle power and physical function. Third, psoas muscles, unlike other muscle groups, can present atrophy and fatty degeneration restricted to the psoas. 16 Thus, psoas muscle cross sectional areas may not accurately reflect total skeletal muscle mass in elderly patients. 17 Lastly, we did not examine the effects of hip fracture location or severity on functional recovery or ability to conduct daily activities.
In this study, unfavorable outcomes were more common in the osteosarcopenia group and subsequent fracture rates were higher than in the normal group. Furthermore, functional scores differed significantly in these 2 groups, and these are known to be related to the recovery of daily living abilities after surgery. Notably, the present study shows a strong correlation exists between PMIs indices and T-scores in elderly hip surgery patients with sarcopenia and osteoporosis.
Footnotes
Acknowledgments
This study was supported by Inha University.
Declaration of Conflicting Interests
The author(s) declared no potential conflicts of interest with respect to the research, authorship, and/or publication of this article.
Funding
The author(s) disclosed receipt of the following financial support for the research, authorship, and/or publication of this article: Received support from Inha University research grant.