
Abstract
Background and aim:
Hip fracture is a leading cause of mortality, morbidity, and disability in older people. The aim of the present study was to prospectively assess the development of physical performance in patients with hip fracture after surgery.
Setting:
Prospective, observational study in a Swedish university hospital.
Methods:
Assessment of 102 consecutive patients (65 females), with a mean age of 82 years (range 35-98) without specific inclusion or exclusion criteria. Seven physical functions were assessed using the following 4 measuring methods and 3 rating scales at baseline 7 to 10 days after surgery and follow-up after 4 months (F4): 10-m habitual walking speed (HWS), timed up and go (TUG), 30-second chair stand test (CST), handgrip strength (HGS), Berg balance scale (BBS), functional ambulation category (FAC), and general mobility.
Results:
The 47% dropout patients were significantly older and more often lived alone or in nursing homes and used indoor walking aids. At baseline, the mean HWS was 0.4/0.5 (females/males) m/s; TUG 53/30 s; CST 4/5 kg, and HGS 17.4/31.2 kg. The medians of BBS and FAC were 20/20 and 4/4, respectively. There were significant mean improvements at F4 for all 4 measured functions, except for HGS in males but for neither of the rating scales. There was a large heterogeneity in all assessed variables, both at baseline and regarding change at 4 months. Therefore, the mean/median results are depicted in figures, showing all individual results at baseline and F4, compared to reference values and discussed in relation to degree of improvement.
Conclusion:
The observed large heterogeneity at baseline as well as F4 makes it essentially meaningless to report means and median data of functional assessment of patients with hip fracture. There is a strong need for individualization in both health analysis and how the treatment program is targeted, carried through, and evaluated over time in patients with hip fracture.
Introduction
The highest rates of hip fracture are seen in northern Europe and in the United States and the lowest in Latin America and Africa, with a more than 50-fold difference in annual incidence. Sweden and Denmark have the highest age-standardized annual incidence of hip fracture in females in the world, around 560 of 100 000 inhabitants. 1,2 In Sweden, 68% of patients with hip fracture are females and the mean age is 83 years for females and 80 years for males. 3 At 50 years of age, the risk of hip fracture during the remaining life time is 23% for females and 11% for males. Among females reaching the age of 90 years, almost 50% have experienced a hip fracture. Annual costs for surgery and rehabilitation after hip fracture amount to 1.5 billion Swedish Krona (≈ US$230 million). 3
Hip fracture is a leading cause of mortality, morbidity, and disability in older people. 4 In Sweden, the total mortality at 4 months after a hip fracture is 14% for males and 9% for females but is highly related to age and institutionalization before the fracture. 5 Among survivors, pain is common, mobility and autonomy are reduced, and up to 50% never regain their previous functional level. 3
Since hip fractures often have a poor prognosis, there is a challenge to develop the rehabilitation process to optimize individualized, integrated, and targeted treatment programs that are easy to administer. To this end, it is crucial to develop a battery of suitable and reliable methods to assess the development of physical function over time after a hip fracture. 6
The aim of the present study was to observe and describe general characteristics of patients with hip fracture in Örebro, Sweden, divided by females and males, and to assess their physical performance over time in regular care without any new intervention from the early postoperative phase until 4 months after surgery.
Materials and Methods
Patients
During a 5-month period from October 2008 to February 2009, we invited all consecutive patients with acute hip fracture to participate in the study, totaling to 140 patients. Of these, 29 patients were excluded since they had their hip surgery during the Christmas holidays between December 15, 2008 and January 06, 2009, when the staff was reduced and it was not possible to follow the study protocol. In all, 6 patients did not wish to or could not participate in the study and 3 were excluded since they lived outside Örebro county. A total of 102 patients (65 females and 37 males) gave written informed consent to participate in the study. Figure 1 illustrates exclusions and dropouts between inclusion and follow-up at 4 months (F4).

Inclusions, exclusions, and dropouts between baseline and follow-up at 4 months.
Study Protocol
All patients with acute hip fracture at Örebro University Hospital had their surgical procedure at the Department of Orthopaedic Surgery. We performed standardized assessment of the physical functions mentioned subsequently on 5 different occasions. The average inpatient length of stay was 10 days (range 3-25, standard deviation [SD] = 6), and the first study examination (baseline) occurred close to the end of the inpatient period, usually 7 to 10 days after the surgery. Follow-up examinations were performed monthly for 4 months, starting 1 month after hospital discharge as polyclinic visits to the Department of Geriatric Medicine at Örebro University Hospital. Since the Swedish national hip fracture registry has its main F4 after surgery, in this report, we decided only to address changes between assessment of physical function at baseline and at F4 after surgery.
The following 7 methods were used to assess physical performance; 4 measurements and 3 rating scales: Habitual walking speed (HWS) measured with the 10-m walking test while walking at a comfortable speed.
7
Walking aids were used if necessary. Patients’ walking time and use of any walking aid were recorded. For people aged 79 to 85 years, the HWS has been reported as 1.0 to 1.2 m/s.
8
The minimal clinically important difference (MCID) for elderly people after hip fracture has been estimated to be ≈0.1 m/s.
9,10
Timed Up and Go (TUG): This test was described in 1991 to assess functional mobility and balance.
11
The patients were encouraged to walk in a pace they preferred using their usual walking aids. The time taken to rise from a chair with arm rests, walk 3 m, cross a line on the floor, turn, walk back, and sit down again was registered. The reference TUG range for people aged 80 to 99 years expressed as mean (95% confidence intervals) has been estimated to be 11.3 (10.0-12.7) seconds
12
and 11 to 20 seconds in frail elderly and disabled patients,
11
respectively. The MCID for TUG has not been established.
13
The 30-second chair-stand test (CST): This test was described in 1999 to assess lower extremity strength and balance in older people.
14
The patients were asked to rise from a chair with arm rests to full standing and sit down again as many times as possible in 30 seconds with arms crossed over the chest or stomach. If the patient could not rise up at all with arms crossed, he or she was allowed to perform the test using the arms. The arm position and the number of stands were registered. For people aged 80 to 84 years, the normal 25% to 75% interpercentile range is 9 to 14 for females and 10 to 15 for males.
14,15
The CST is complex and requires good leg strength, coordination, and balance.
16
The relevant improvement is not only based on the increase in the number of stands but also on whether arms are needed or not. Previous studies suggest an increased risk of falling if a patient performs less than 5 chair stands during 30 seconds.
16
Handgrip strength (HGS): This test assesses both muscle strength and coordination and was measured using a Jamar hand dynamometer (Lafayette Instrument Company, Indiana, USA). The best score of 3 trials with each hand was chosen. The HGS is considered a marker of muscle weakness related to frailty and increased hip fracture risk.
16
The reference means (95% confidence intervals) for people aged 80 to 84 years have been reported as 17.3 (14.8-19.9) kg for females and 30.1 (24.3-35.9) kg for males.
17,18
Berg balance scale (BBS): This rating scale was described in 1989 and consists of 14 items representing functional movements common in everyday life.
19
Some items assess the ability of the participant to maintain the positions during various activities, for example, functional reach or standing on 1 leg while other items examine the functional ability to perform specific tasks, such as stand up, turn around, or pick up an object from the floor. Scoring is based on a manual where each item is scored from 0 to 4 amounting to a maximum of 56 points, which is considered as normal
20
and less than 45 points is considered as the prediction of fall in elderly adults.
21
Functional ambulation category (FAC): This test scores patients’ functional dependency for ambulation, with or without walking device, ranging from 0 (unable to walk or in need of assistance from more than 2 persons to walk) to 5 (independent).
22
General mobility was assessed using the General Motor Function (GMF) rating scale. The assessor observed the degree of dependence, which was assessed on a 3-point scale but was later dichotomized into dependent or independent for the following 4 functional categories: (1) supine to side lying; (2) sit up from supine; (3) lie down from sitting; and (4) move from bed to chair.
23
The study was approved by the Research Ethics Committee in Uppsala, Sweden.
Statistical Analysis
Distributions of variables are presented as means, SDs, medians, ranges, and percentages. Age differences were analyzed by independent 2-sided t-test. For comparisons between the groups, the chi-square test was used for continuous variables, the Mann-Whitney U test for ordered variables, and the Newcombe and Altman method for dichotomized variables. 24 Normality of changes was analyzed by Shapiro-Wilk test for all physical functions. Nonparametric Wilcoxon rank test was used for comparing unpaired data and Mann-Whitney U test for comparing paired data. McNemar test was used for comparing the dichotomized variables for paired data. Median difference was analyzed by Hodges-Lehmann estimates. A P value <.05 was considered as significant.
Results
All 102 included patients were not able to participate at F4 and Figure 1 shows the reasons for dropout. In total, 48 (47%) patients dropped out before F4 and the 2 most common reasons were death 18 and not having the strength to participate. 24 Our aim was to analyze data from all 4 follow-ups. However, there was varying compliance rates at all follow-up time points with many missing values. After consulting a statistician, we decided not to analyze all data using mixed general linear models since too many missing values would have had to be compensated for. A compilation of data from follow-up at 3 months and F4 would not be justified. Thus, we only present results comparing data from baseline with F4. This is in line with the Swedish national hip fracture registry having its major end point at F4 after hip surgery. The 54 patients that participated at both baseline and F4 were designated “the study group.”
Table 1 compares patient characteristics at baseline between the study group and the dropout group and there were several significant differences. The dropout group was on average 5 years older. The vast majority in the study group were living at home, whereas around half of the patients in the dropout group lived in nursing home. More dropout patients were living alone and more were using walking aids indoors.
General Characteristics of the Study and Dropout Groups at Baseline.a
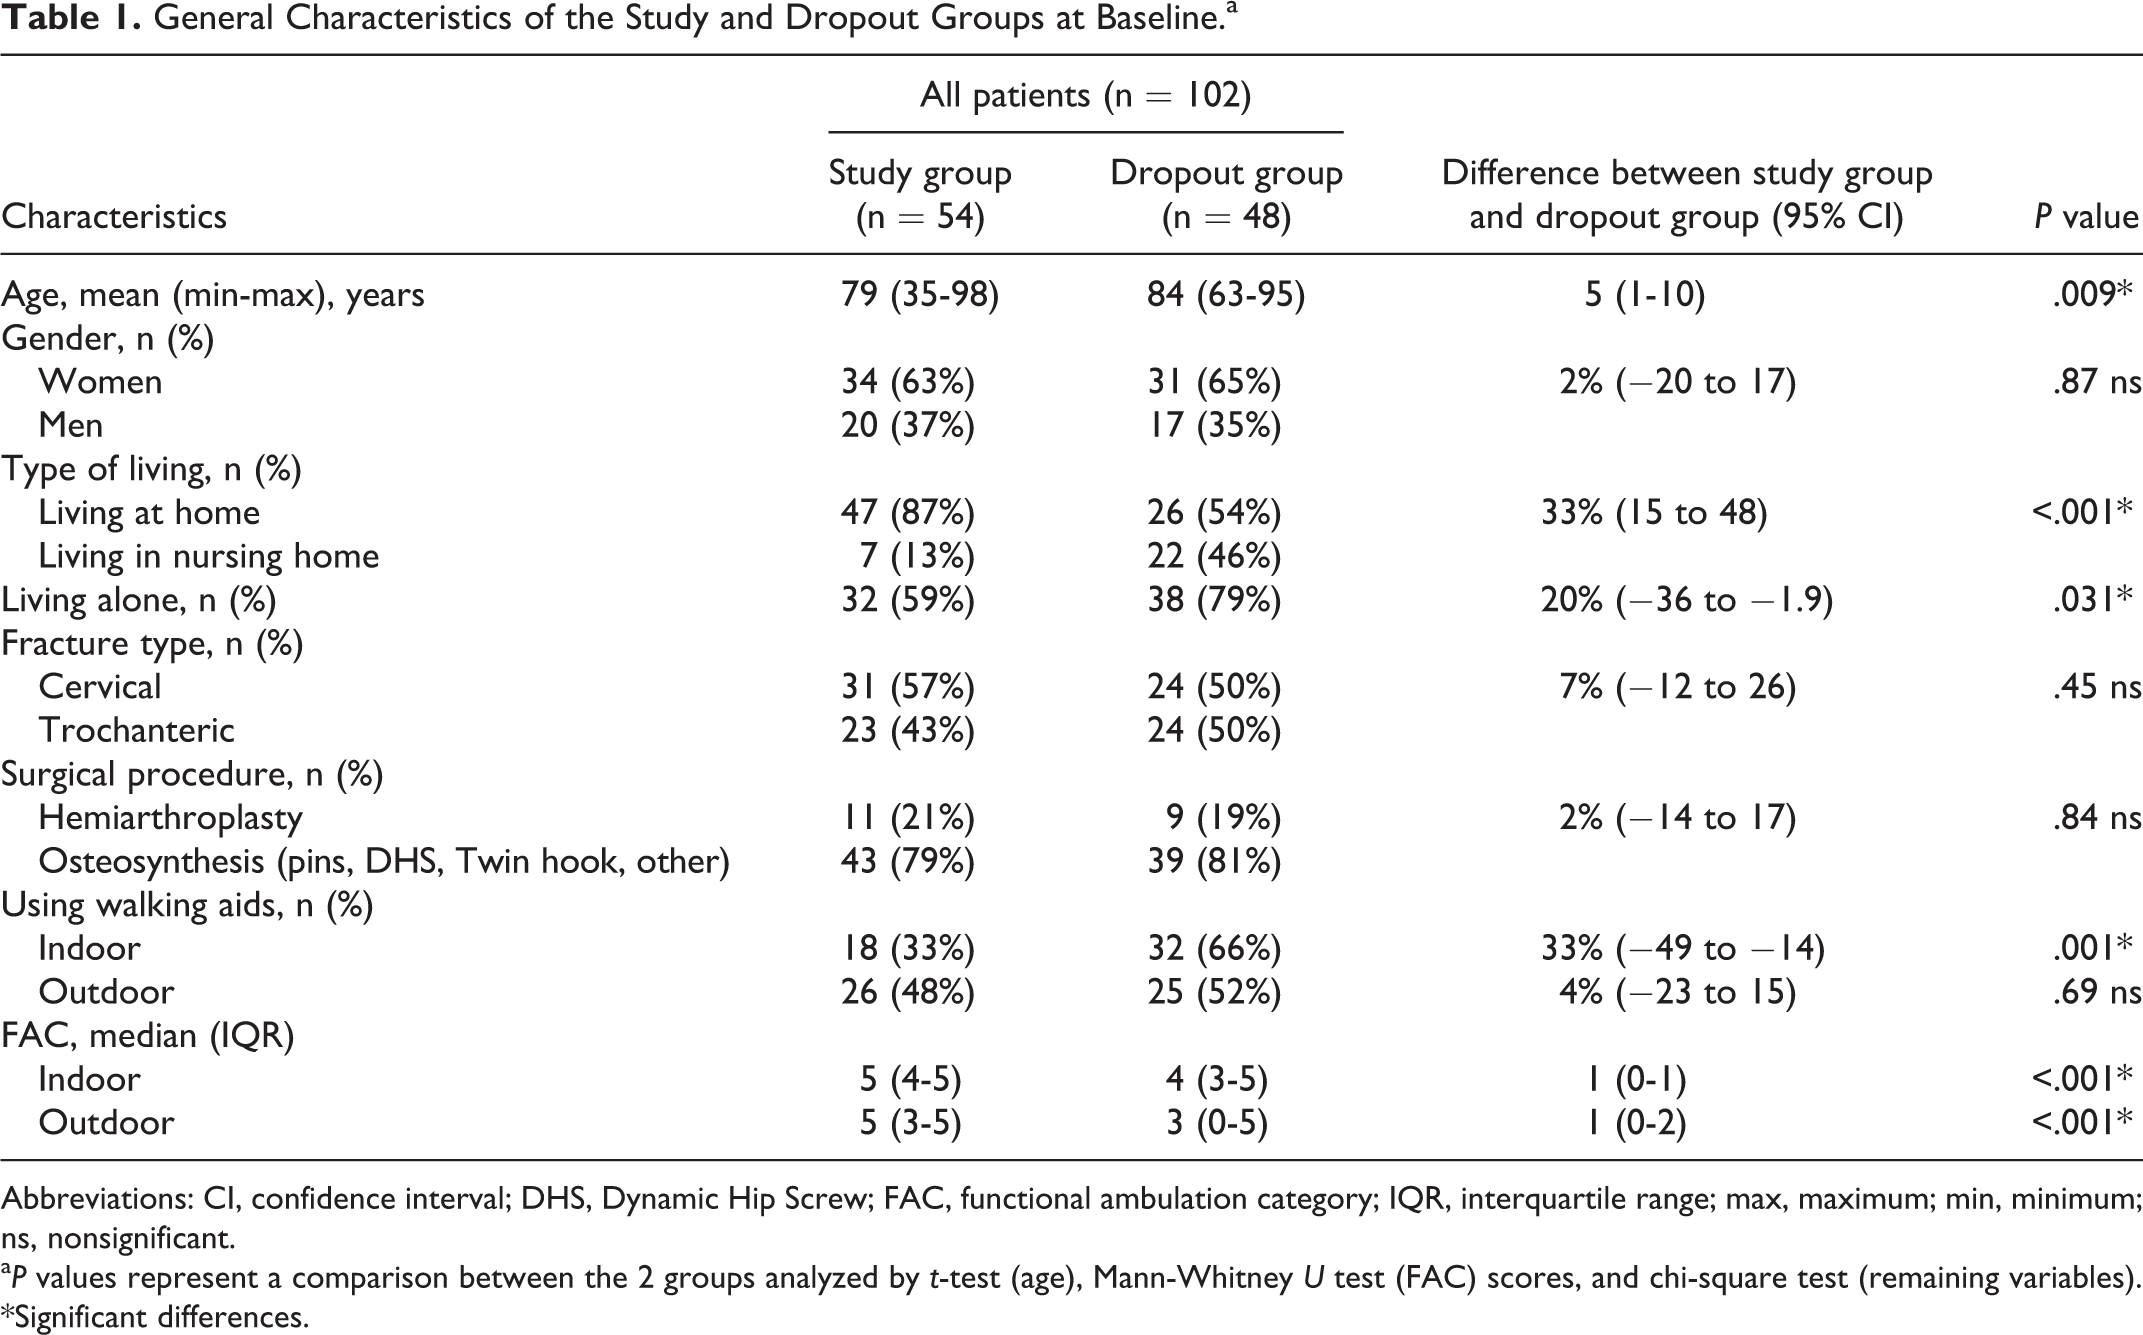
Abbreviations: CI, confidence interval; DHS, Dynamic Hip Screw; FAC, functional ambulation category; IQR, interquartile range; max, maximum; min, minimum; ns, nonsignificant.
a P values represent a comparison between the 2 groups analyzed by t-test (age), Mann-Whitney U test (FAC) scores, and chi-square test (remaining variables). *Significant differences.
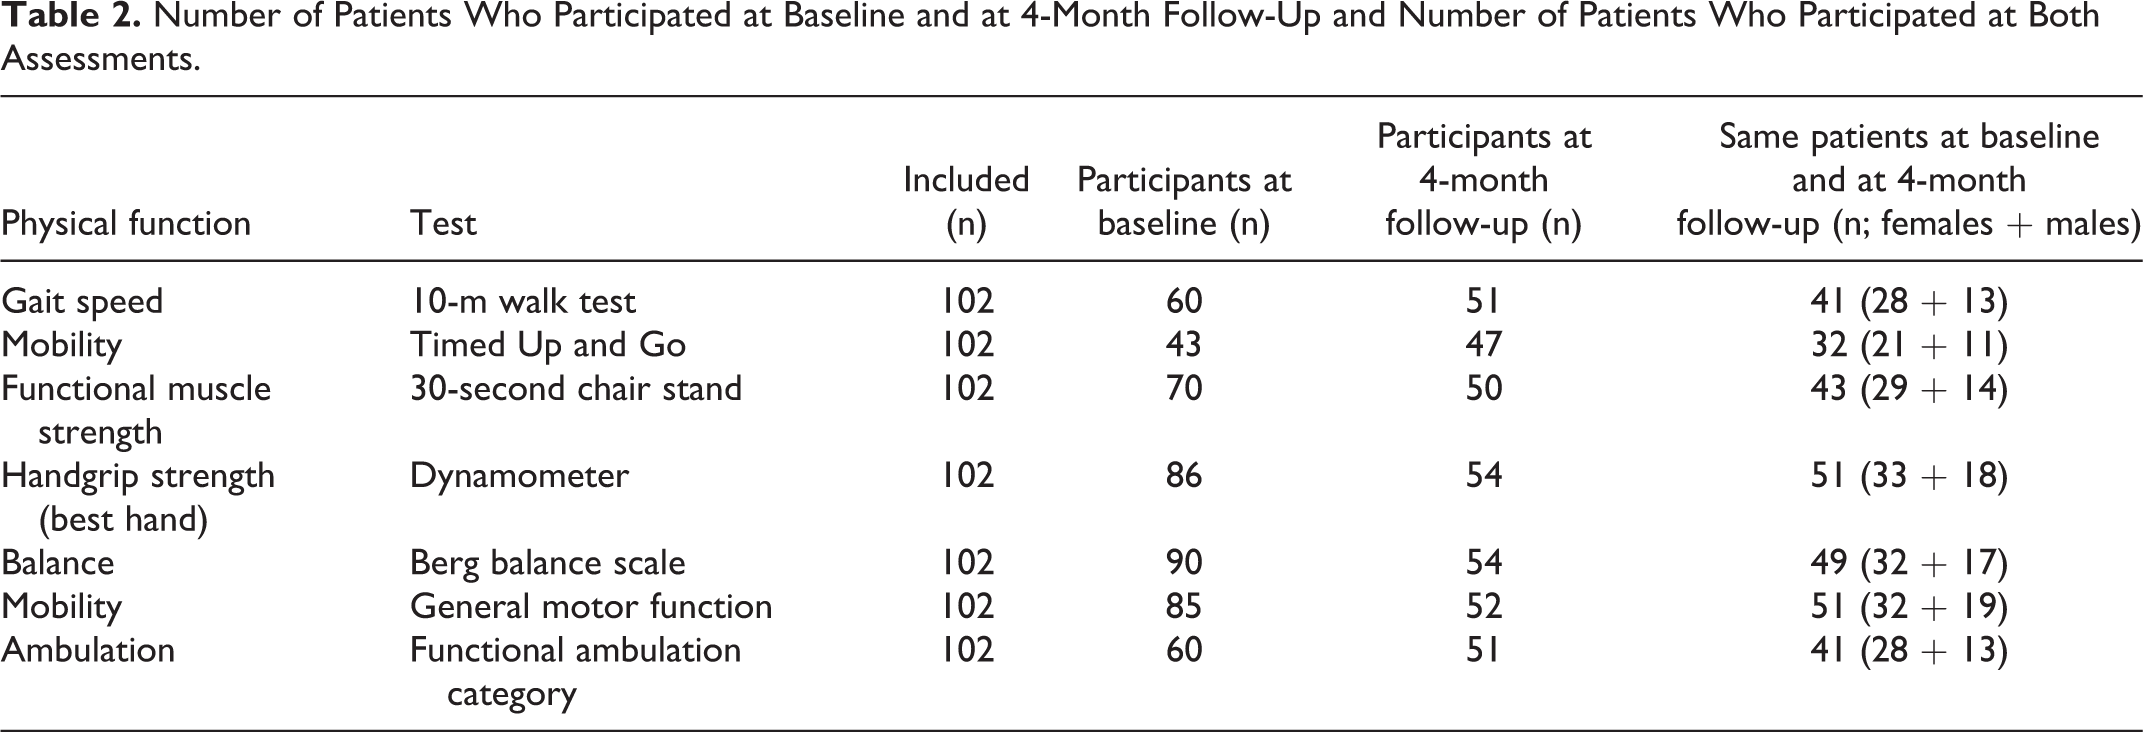
Table 2 shows the number of patients who participated at baseline and F4 as well as at both occasions for different assessments of physical function. Table 3 shows the means and medians of the assessed physical functions at baseline and F4 as well as changes in the functions between baseline and F4, respectively.
Number of Patients Who Participated at Baseline and at 4-Month Follow-Up and Number of Patients Who Participated at Both Assessments.
Physical Functions for Females and Males at Baseline and F4 and Changes Between Baseline and F4.

Abbreviations: F4, follow-up at 4 months; HWS, habitual walking speed; TUG, timed up and go; CST, chair stand test; HGS, handgrip strength; BBS, Berg balance scale; FAC, functional ambulatory category, Md, median, SD, standard deviation, q1-q3, quartile 1-quartile 3.
aIndicates significant differences between baseline and F4 for each gender.
bIndicates significant differences between baseline and F4 between females and males at baseline.
cIndicates significant differences between baseline and F4 between females and males at F4.
Numerous significant changes were found as indicated in Table 3; however, there were no significant differences in changes of physical functions between baseline and F4 for females and males. Since the variation between all variables was so large, the mean values are complemented by individual data in Figures 2 to 5
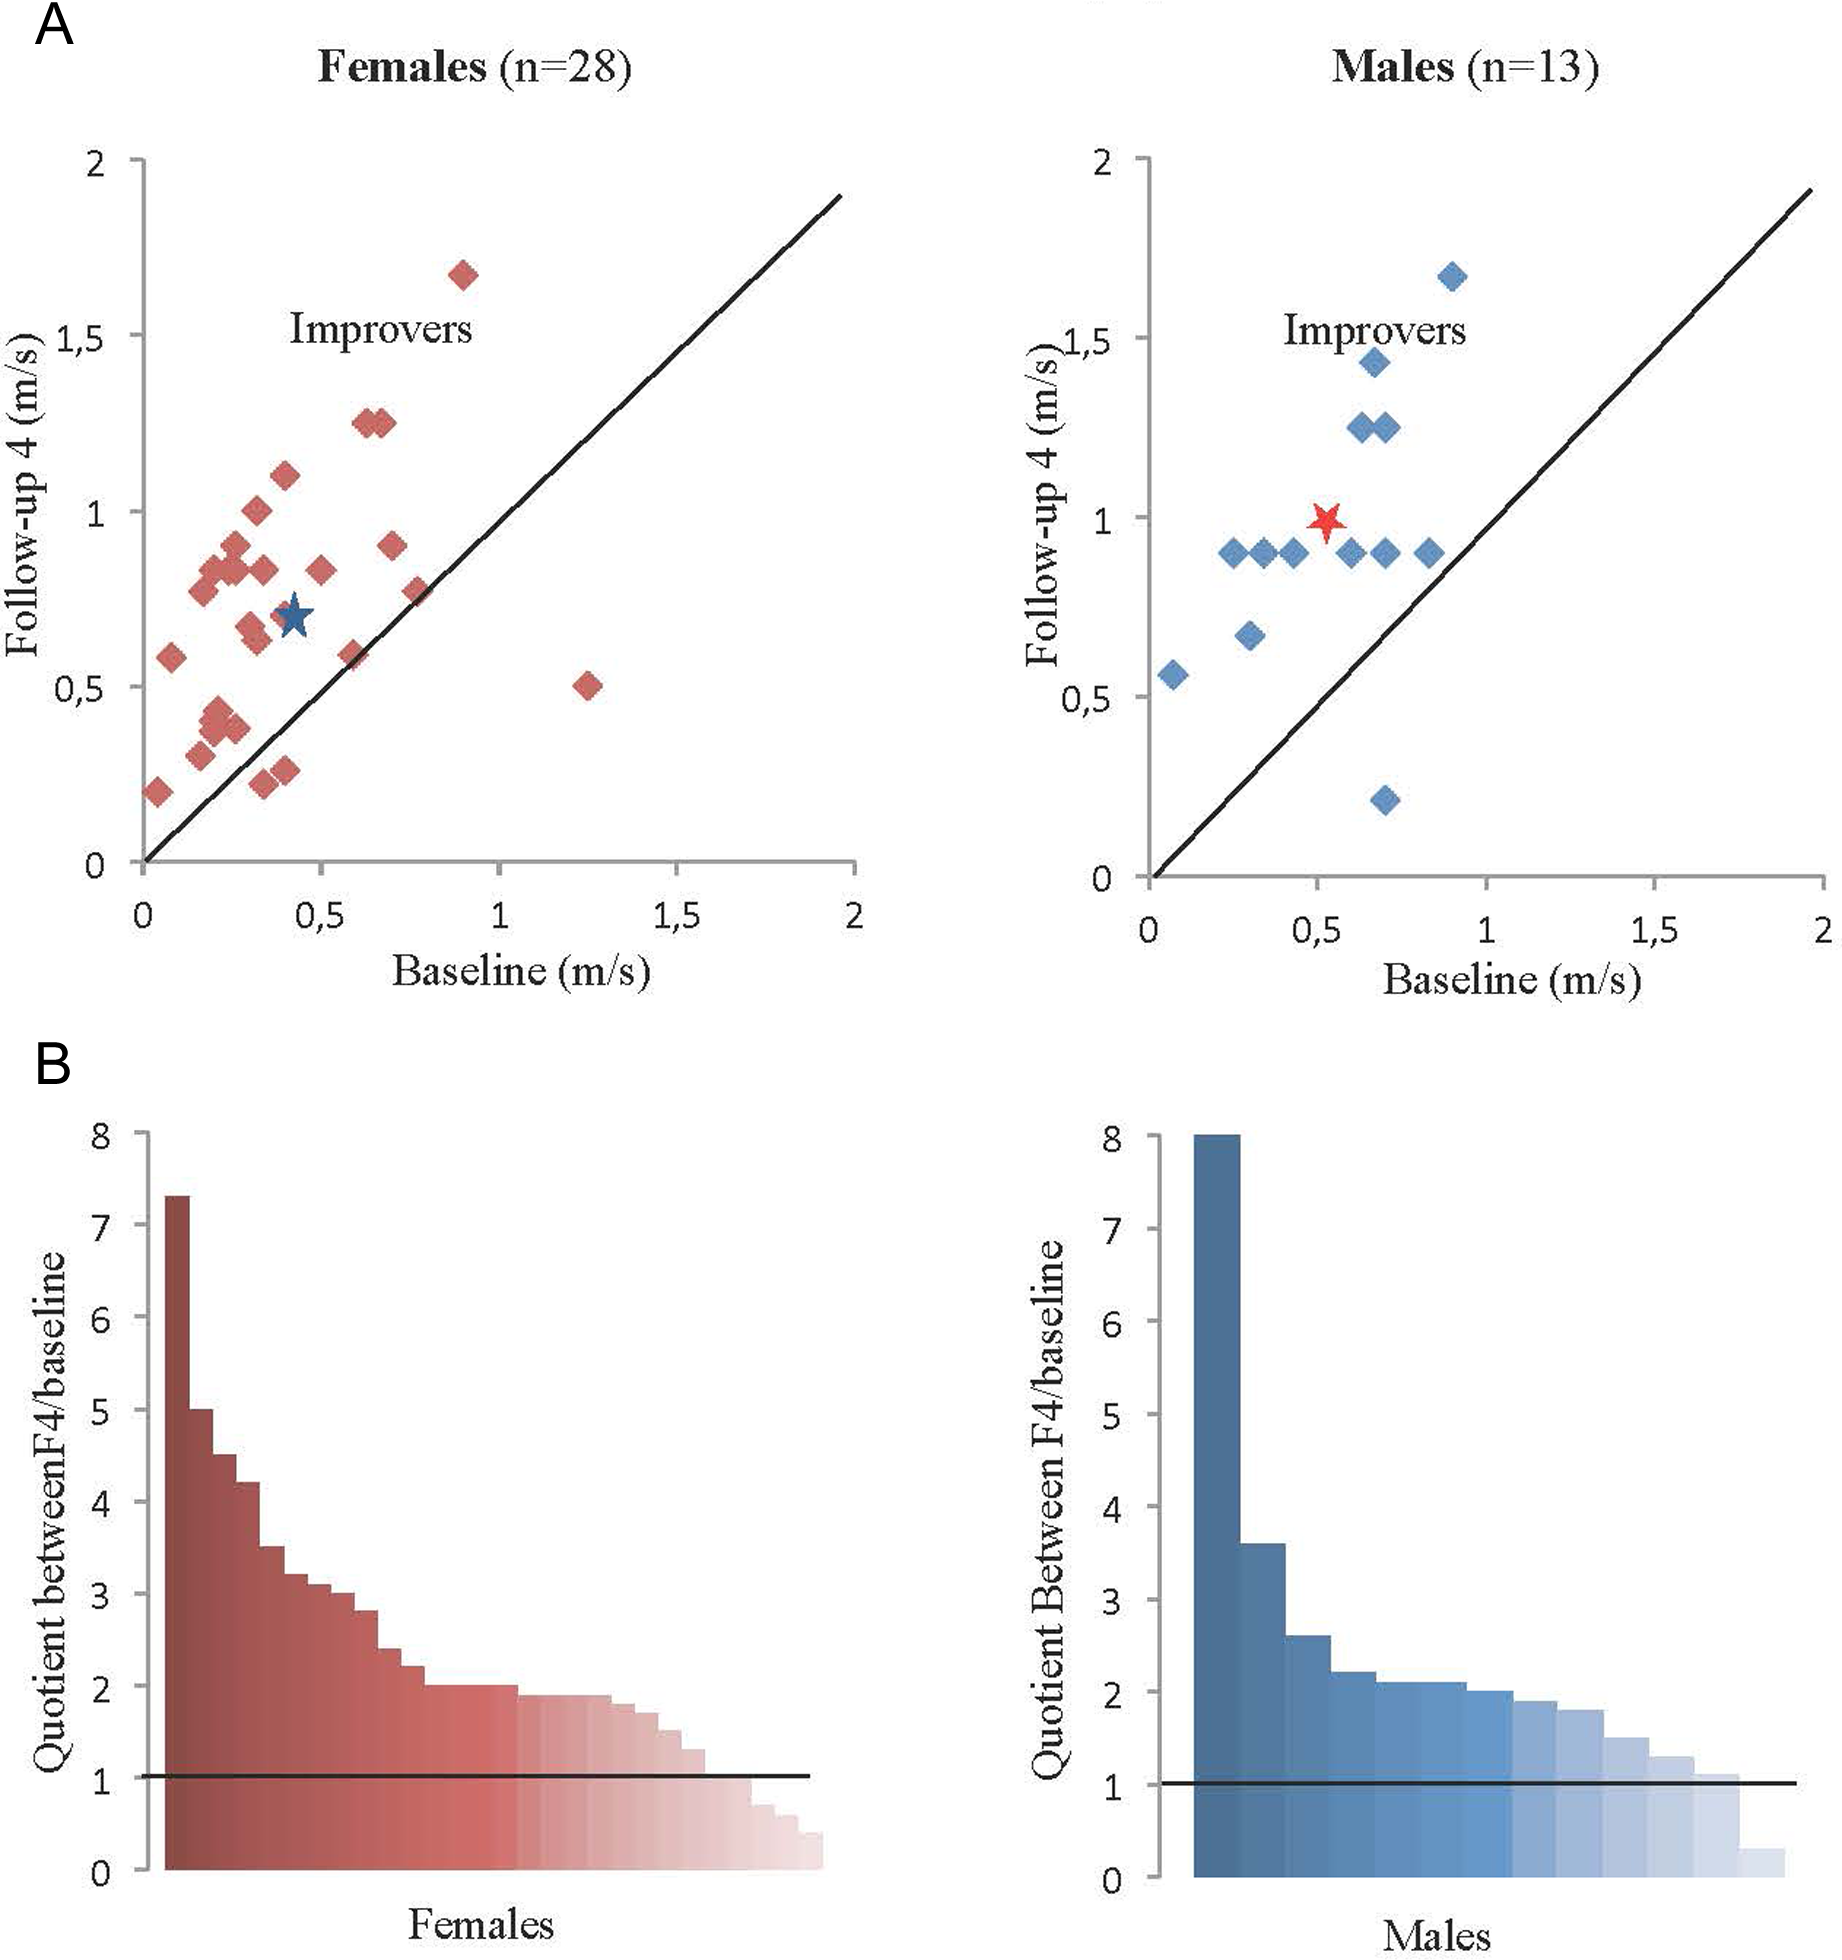
A, Absolute habitual walking speed (m/s) for females and males comparing results at baseline and follow-up at 4 months (F4) for each individual patient. The improvers are indicated above the line showing no change between baseline and F4. The symbol (*) represents the mean values. B, Improvement in habitual walking speed between baseline and F4 for all individual females and males, expressed as quotient between walking speed at F4 and baseline, sorted from high to low improvement. The line represents no improvement.
Habitual 10-meter Walking Speed
The mean speed improved from 0.4 to 0.7 m/s for females and from 0.5 to 1.0 m/s for males. There were large individual differences in improvements; for females −0.8 to 0.8 m/s and for males 0.07-0.8 m/s. All but 5 (18%) of 28 females and 4 (31%) of 13 males improved their walking speed at F4 by >1.0 m/s. In total, 22 (78%) of 28 females and all 13 males changed their HWS from baseline to F4 ≥ 0.1 m/s, the level found to represent MCID (Figure 2A and B).
Timed Up and Go
The mean TUG time decreased by 33 seconds (from 53-20 seconds) for females and by 11 seconds (from 30-19 seconds) for males with large individual differences; for females 6 to 138 seconds and for males −82 to 45 seconds. In total, 14 (67%) of 21 females and 10 (91%) of 11 males improved their results at F4 to less than 20 seconds, the upper reference limit for TUG in a frail population. 8 At F4, 10 (48%) of 21 females and 5 (45%) of 11 males were able to perform the test without any walking aid (Figure 3A and B).

A, Timed up and go (TUG) for females and males comparing results at baseline and follow-up at 4 months (F4) for each individual patient. The improvers are indicated below the line showing no change between baseline and F4. The symbol (*) represents the mean values. B, Improvement in TUG between baseline and F4 for all individual females and males, expressed as quotient between TUG at F4 and baseline, sorted from high to low improvement. The horizontal line represents no improvement.
The 30-second CST
Regardless of the arm position, the mean number of chair stands increased from 4 to 8 for females (P < .001) and from 3 to 10 for males (P = .003). All but 4 females and 4 males improved their results at F4, however, with large individual differences, females −9 to 14 seconds and males −3 to 11 seconds. At F4, 15 (52%) of 29 females and 9 (64%) of 14 males could perform more than 5 chair stands in 30 seconds, the cutoff value for increased risk of falling (Figure 4A and B).

A, Results of 30-second chair stand test for females and males at baseline and follow-up at 4 months (F4) for each individual patient. The improvers are indicated above the line showing no change between baseline and F4. The symbol (*) represents the mean values. The figure includes all 3 subgroups (see text). B, Improvement in 30-second chair stand test between baseline and F4 for all individual females and males, expressed as quotient between the results at F4 and baseline, sorted from high to low improvement. The horizontal line represents no improvement.
The results were also divided into 3 subgroups, including both females and males, based on their need of hand/arm support on the 2 test occasions: (a) crossed arms to crossed arms; (b) arm rest to arm rest; and (c) arm rest to crossed arms. Almost half of the 43 assessed patients (13 females and 7 males) improved at F4 and were able to perform the second test using crossed arms (subgroup c) while the mean number of repetitions was decreased. In the 2 other subgroups, the mean number of chair stands improved.
Handgrip strength, Best Hand (Not Shown)
The mean HGS in the best hand changed minimally from 17.4 to 18.4 kg for females and 31.2 to 32.0 kg for males. The best HGS at F4 ranged from −7 to 9 kg for females (n = 33) and −7 to 9 kg for males (n = 18).
Berg Balance Scale
The median score for BBS improved from 20 to 41 for females and 20 to 46 for males, however, with large individual differences; females −9 to 47 and males −25 to 38 points (Figure 5A and B).

A, Results of the Berg balance scale for females and males at baseline and follow-up at 4 months (F4) for each individual patient. The improvers are indicated above the line showing no change between baseline and F4. The symbol (*) represents the median values. B, Improvement in the Berg balance scale between baseline and F4 for all individual females and males, expressed as quotient between the results at F4 and baseline, sorted from high to low improvement. The horizontal line represents no improvement.
Functional Ambulation Category (Not Shown)
The number of patients who could walk independently on even surfaces, with or without walking device, increased between baseline and F4 from 15 to 22 for females (n = 28) and from 10 to 12 for males (n = 13).
General Motor Function (Not Shown)
At F4, the number of patients still dependent on the 4 assessed categories A to D were 0, 7, 2, and 3 for females (n = 32) and 0, 1, 1, and 4, for males (n = 19), respectively.
Discussion
Heterogeneity
Both at baseline and at F4, there was a strong heterogeneity for all assessed physical functions. The observed large differences in physical functions at baseline as well as regarding improvement at 4 months make it essentially meaningless to report means and median data and serve as a strong call for individualization in both health analyses, targeting of treatment, and follow-up over time. This conclusion is further strengthened by the heterogeneity between patients in number and mix of manifest health problems and risk factors including number of other treatments, such as prescription medical drugs (manuscript in preparation).
Effect Size
Most participants increased their HWS between baseline and F4, but only 18% of females and 31% of males reached the reference speed of 1.0 m/s for elderly people aged 79 to 84 at F4. 5 A manual on traffic control device concluded that a speed of 1.2 m/s is safe for pedestrians to walk across a street. 25 Half of the females had a walking speed of less than 0.7 m/s at F4, suggesting safety problems in traffic environments as well as an increased risk to fall. 26
All participants improved TUG from their baseline level but only 33% of the females and 64% of the males were able to perform TUG at F4 within the mid-reference time of 11.3 seconds for elderly people aged 80 to 99. 12 Only 45% of females and 64% of males were able to perform more than 5 chair stands in 30 seconds at F4 representing increased risk of falling and indicating the frailty of the assessed group. Performance of TUG has been found to improve when assistive device is introduced. 27 The patients were allowed to use their usual walking aids during the test and this may explain part of the TUG improvement.
Only 48% of females and 33% of males were able to achieve the reference values of HGS of 17.3 kg for females and 30.1 kg for males, indicating the muscle weakness of the study group.
Almost all females and males improved their score in BBS test at F4; however, only 2 females and 2 males reached the full score of 56 points, implying that many patients had remaining balance problems with increased risk of falls.
Limitations of the Study
The main limitation of the study is the large dropout rate. However, this was expected since the project was a pragmatic study performed in a regular clinical setting of patients with hip fracture. The dropout group was on average older, had more nursing home- and single-living residents, and more use of indoors walking aids, all indicating worse average health condition than the study group. Thus, it is difficult to translate the observed functional development over 4 months after a hip fracture to the whole population with hip fracture. Another limitation is that the functional assessments were performed by several physiotherapists. However, they were trained in the used assessment methods and carefully followed the manuals.
Conclusion
The observed large heterogeneity regarding physical functions at baseline as well as improvements at 4 months makes it difficult to standardize the rehabilitation process after hip fracture surgery. There is a strong need for individualization of how the physical training program is targeted, performed, and evaluated over time after a hip fracture.
Footnotes
Acknowledgments
We thank Anders Magnuson, Clinical epidemiology and biostatistics, Örebro University Hospital, for his valuable comments during the statistical work.
Declaration of Conflicting Interests
The author(s) declared no potential conflicts of interest with respect to the research, authorship, and/or publication of this article.
Funding
The author(s) received no financial support for the research, authorship, and/or publication of this article.