
Abstract
Background
The objective of this study was to evaluate mean cerebral blood flow velocity, gaseous microemboli (GME) counts, regional cerebral oxygen saturation (rSO2), and clinical outcomes using multimodality neuromonitoring in risk-stratified congenital cardiac surgery patients and by cyanotic and acyanotic heart disease.
Methods
A total of 377 pediatric patients undergoing congenital cardiac surgery with cardiopulmonary bypass (CPB) were stratified by the Society of Thoracic Surgeons-European Association for Cardio-Thoracic Surgery (STAT) mortality categories and by classification of cyanotic and acyanotic heart disease. Intraoperative mean cerebral blood flow velocity, GME counts, and rSO2 were assessed at multiple time points. Clinical outcomes were compared between patients of each STAT mortality category and cyanotic classification.
Results
Mean cerebral blood flow velocities of STAT Mortality Category 5 patients decreased drastically from baseline values after cross-clamp (down to 56%) and after off-bypass (down to 32%), while rSO2 values increased significantly during CPB. Patients in STAT mortality category 5 experienced higher GME counts (1.3- to 4.4-fold greater) compared with patients in all other STAT categories. When compared with acyanotic patients, cyanotic patients experienced significantly lower mean blood flow velocity, significantly greater rSO2 during CPB, and greater GME counts than acyanotic patients (1.3-fold greater). Although 29 patients experienced neurological injury confirmed by electroencephalogram and magnetic resonance imaging, instances of injury were not correlated with GME counts among risk-stratified and cyanotic versus acyanotic patients.
Conclusions
Utilization of intraoperative transcranial Doppler, in addition to near-infrared spectroscopy, may help to identify other parameters for cerebral protection, such as drastically decreased cerebral blood flow velocity and increased cerebral microemboli counts, particularly in STAT Mortality Category 5 and cyanotic patients.
Keywords
Introduction
Although mortality rates following congenital cardiac surgeries have improved, this has been replaced instead by an increase in observed postsurgical morbidity, with neurodevelopmental deficits being a particular area of attention.1–4 Long-term outcomes can be further complicated by the categorization of patients as cyanotic within the context of their disease, which by definition means systemic venous blood shunting into the systemic arterial circulation, including to the cerebral circulation. In a retrospective cross-sectional study from the Society of Thoracic Surgeons Congenital Heart Surgery Database and Congenital Cardiac Anesthesia Society Database Module, cyanotic patient cohorts were found to have higher operative mortality and major postoperative complications. 5 This necessitates further investigation of disparities in intraoperative sequelae among cyanotic and acyanotic groups to differentiate their outcomes postoperatively. Methods that help identify potentially modifiable intraoperative factors, such as mitigating the generation and delivery of cerebral gaseous microemboli (GME), optimizing cerebral perfusion, and assessing influences on cerebral regional oxygen saturation (rSO2), become of utmost importance. Multimodality neuromonitoring allows a window into beginning to understand these processes.
There are countless factors contributing to neurodevelopmental deficits, from preexisting comorbidities to perioperative injuries. Unfortunately, several of these factors are fixed and patient-specific and have been shown to be strong predictors of worse neurodevelopmental outcomes. 6 However, this highlights the importance of recognizing measures that are in fact modifiable, including those in the intraoperative setting.
One measure of significance is cerebral blood flow velocity during cardiopulmonary bypass (CPB). New hypoxic–ischemic brain injury is detected on magnetic resonance imaging (MRI) in 36% to 73% of neonates after congenital heart disease (CHD) surgeries with cardiopulmonary bypass (CPB). 7 Due to incomplete understanding of the limits of cerebral blood-flow pressure autoregulation in pediatric populations, ensuring adequate cerebral oxygenation throughout the entirety of surgery can be a challenging task. 8
Another measure that warrants close investigation is GME transmission during CPB. Although the extent of its impact is not well characterized, there is evidence in the adult population that increased cerebral GME transmission during surgery is associated with negative neurologic sequalae. 9 To our knowledge, this relationship in the pediatric population is not well-established. Additionally, while the extent of its impact is unclear, its potential mechanisms of injury are well understood. Due to their gaseous nature, GME are malleable in shape and may bypass arterial filters. Large volumes of unfiltered GME in the neurovascular circulation can obstruct capillaries and cause ischemia. 10 Due to their small size, GME can travel through circulation at very high speeds and shear endothelium from microvasculature, causing endothelial dysfunction and arteriosclerosis. 11
These findings emphasize the necessity of close intraoperative neuromonitoring during CPB procedures. Fortunately, advancements in different neuromonitoring techniques have allowed for improved measurements of both cerebral blood flow velocity and GME detection. Thus, the aim of this study is to utilize neuromonitoring modalities such as transcranial Doppler (TCD) Ultrasound to evaluate cerebral hemodynamics and GME counts and near-infrared spectroscopy (NIRS) to evaluate regional oxygen saturation during surgery. These intraoperative measures will be correlated with postoperative clinical outcomes, including neurological injury (stroke, seizure, and white matter injury [WMI] confirmed by EEG or MRI) in risk-stratified patients and patients classified based on cyanotic or acyanotic heart disease to determine their significance. To our knowledge, there has not been an analysis detailing GME differences in cyanotic versus acyanotic patients. This could be a factor that contributes to negative outcomes in this patient population and requires further evaluation to magnify awareness in clinical care.
Methods
Experimental Design
Pediatric patients who underwent congenital heart surgery at the Penn State Milton S. Hershey Medical Center participated in this study (Penn State College of Medicine IRB Study ID: PRAMS030476EP, last approval date: 04/19/2024). Complete intraoperative neuromonitoring data of all patients were included. The local IRB did not require obtaining patient consent. Inclusion criteria were pediatric patients under 18 years old with congenital heart defects who underwent surgical correction using CPB. Patients over 18 years old were excluded. Patients who were diagnosed with chronic kidney disease or a seizure disorder preoperatively were excluded from analysis of neurological outcomes. Intraoperative cerebral hemodynamics and GME counts were assessed using TCD, and regional oxygen saturation was assessed using NIRS at multiple time points during surgery. Postoperative clinical outcomes were compared between risk categories and between cyanotic and acyanotic patient groups.
Neuromonitoring technicians conducted and recorded all cerebral measurements during surgery using TCD and NIRS. We performed chart reviews to determine whether patients experienced any postoperative neurological injuries, such as seizures, strokes, white matter injuries, or a combination of these, as confirmed by EEG and MRI. The multidisciplinary team decided whether additional imaging was necessary based on each patient's clinical indications. As a result, we did not perform postoperative electroencephalogram (EEG) or MRI for all 377 patients included in this retrospective observational study.
Mortality Risk Stratification and Cyanotic Classification
The patients were assigned mortality scores by utilizing the most recent Society of Thoracic Surgeons-European Association for Cardio-Thoracic Surgery (STAT) score. Patients were stratified into five different mortality categories. 12 The patients were also classified based on cyanotic or acyanotic heart disease. All anatomies considered to be cyanotic are included in the supplemental section.
Anesthesia, Perfusion, and Pediatric Intensive Care Unit Protocols
Details regarding anesthesia, perfusion, and pediatric intensive care unit protocols are provided in the supplemental section and our previously published work.13–16
Cerebral Protection Strategies
Prior to the initiation of bypass, deairing of the venous line was performed to minimize extracorporeal sources of microemboli as described in our previous work. 17 Our cerebral protection strategies depended on the nature of the cases. The typical flow rate for antegrade cerebral perfusion was 40 ml/kg/min. When cooling for regional low-flow cerebral perfusion (RLFP), the pump flow index was reduced to 1.5 L/m2/min from 2.4 L/m2/min while monitoring head and venous saturations. These saturations are typically well above the baseline. A secondary cardiotomy reservoir was used for blood returning through pump suckers before returning to the primary cardiotomy reservoir. 18
Transcranial Doppler Ultrasound
Transcranial doppler ultrasound (Pioneer TC8080; Nicolet Biomedical Inc) was used intraoperatively to evaluate cerebral blood flow velocity and GME delivery. Details about TCD operation and data collection can be found in the supplemental section.
Near-Infrared Spectroscopy
Near-infrared spectroscopy is a noninvasive modality of continuous neuromonitoring that measures the percentage of saturated oxyhemoglobin to total hemoglobin. This evaluates the rSO2 of a tissue. In this study, the INVOS 5100B NIRS monitor (Somanetics) was used. Details about NIRS operation and data collection can be found in the supplemental section.
Postoperative Clinical Outcomes
Various parameters documented in the postoperative setting were used to evaluate clinical outcomes. These parameters included intubation duration after surgery, length of stay (LOS) in the intensive care unit (ICU), hospital LOS, and mortality. Mortality was defined as any cause of death within 180 days of surgery. Gaseous microemboli counts were also assessed with respect to neural injury as defined by evidence of seizure, stroke, or WMI by imaging or EEG postoperatively.
Statistical Analysis
For continuous data, residual diagnostics were used to assess model fit and the underlying parametric assumptions (eg, quantile–quantile plots to assess normality). Based on the residual diagnostics, analysis of variance models (ANOVA) or Kruskal-Wallis tests were used to compare STAT mortality categories with respect to continuous demographics, CPB characteristics, and clinical outcomes collected at one point in time per patient (eg, weight, aortic cross-clamp time, and length of hospital stay). Post hoc pairwise STAT mortality category comparisons were adjusted for multiple comparisons testing using the Tukey-Kramer method for the ANOVA models or the Dwass, Steel, Critchlow-Fligner method for the Kruskal-Wallis tests. 19 Similarly, based on the residual diagnostics, unpaired t tests or Wilcoxon rank-sum tests were used to compare cyanotic status (ie, cyanotic vs acyanotic) with respect to continuous demographics, CPB characteristics, and clinical outcomes collected at one point in time per patient.
Chi-square tests from binary logistic regression using penalized maximum likelihood estimation were used to compare STAT mortality categories, as well as cyanotic status, with respect to binary outcomes (eg, patient mortality within 180 days). 20 Post hoc pairwise STAT mortality category comparisons were adjusted for multiple comparisons testing using the Tukey-Kramer method.
Spearman correlation coefficients, using the Fisher's Z-transformation to obtain 95% confidence intervals, were used to assess the strength of the correlation between mean flow velocity at a given time point and GME counts, as well as the correlation between regional cerebral oxygen saturation at a given time point with GME counts, over all patients and by STAT mortality category and cyanotic status. All hypothesis tests were two-sided, and all analyses were performed using SAS software, version 9.4 (SAS Institute Inc.). Additional statistical analyses are included in the supplemental section.
Linear mixed models were used to compare STAT mortality categories, as well as cyanotic status, with respect to continuous cerebral hemodynamics data collected repeatedly over time per patient (eg, mean blood flow velocity). Mixed models account for the within-subject, as well as the between-subject, variability inherent in data collected at multiple time points per patient (ie, repeated measures). Residual diagnostics were used to assess mixed model fit and the underlying parametric assumptions (eg, quantile–quantile plots to assess normality). Post hoc pairwise STAT mortality category comparisons were adjusted for multiple comparisons testing using the Tukey-Kramer method.
Results
Demographic and Cardiopulmonary Bypass Characteristics
All results for demographics and CPB characteristics for patients stratified by STAT Mortality Category and cyanotic versus acyanotic CHD can be found in Table 1, Table 2, Supplemental Results, and Supplemental Figure 1A and B.
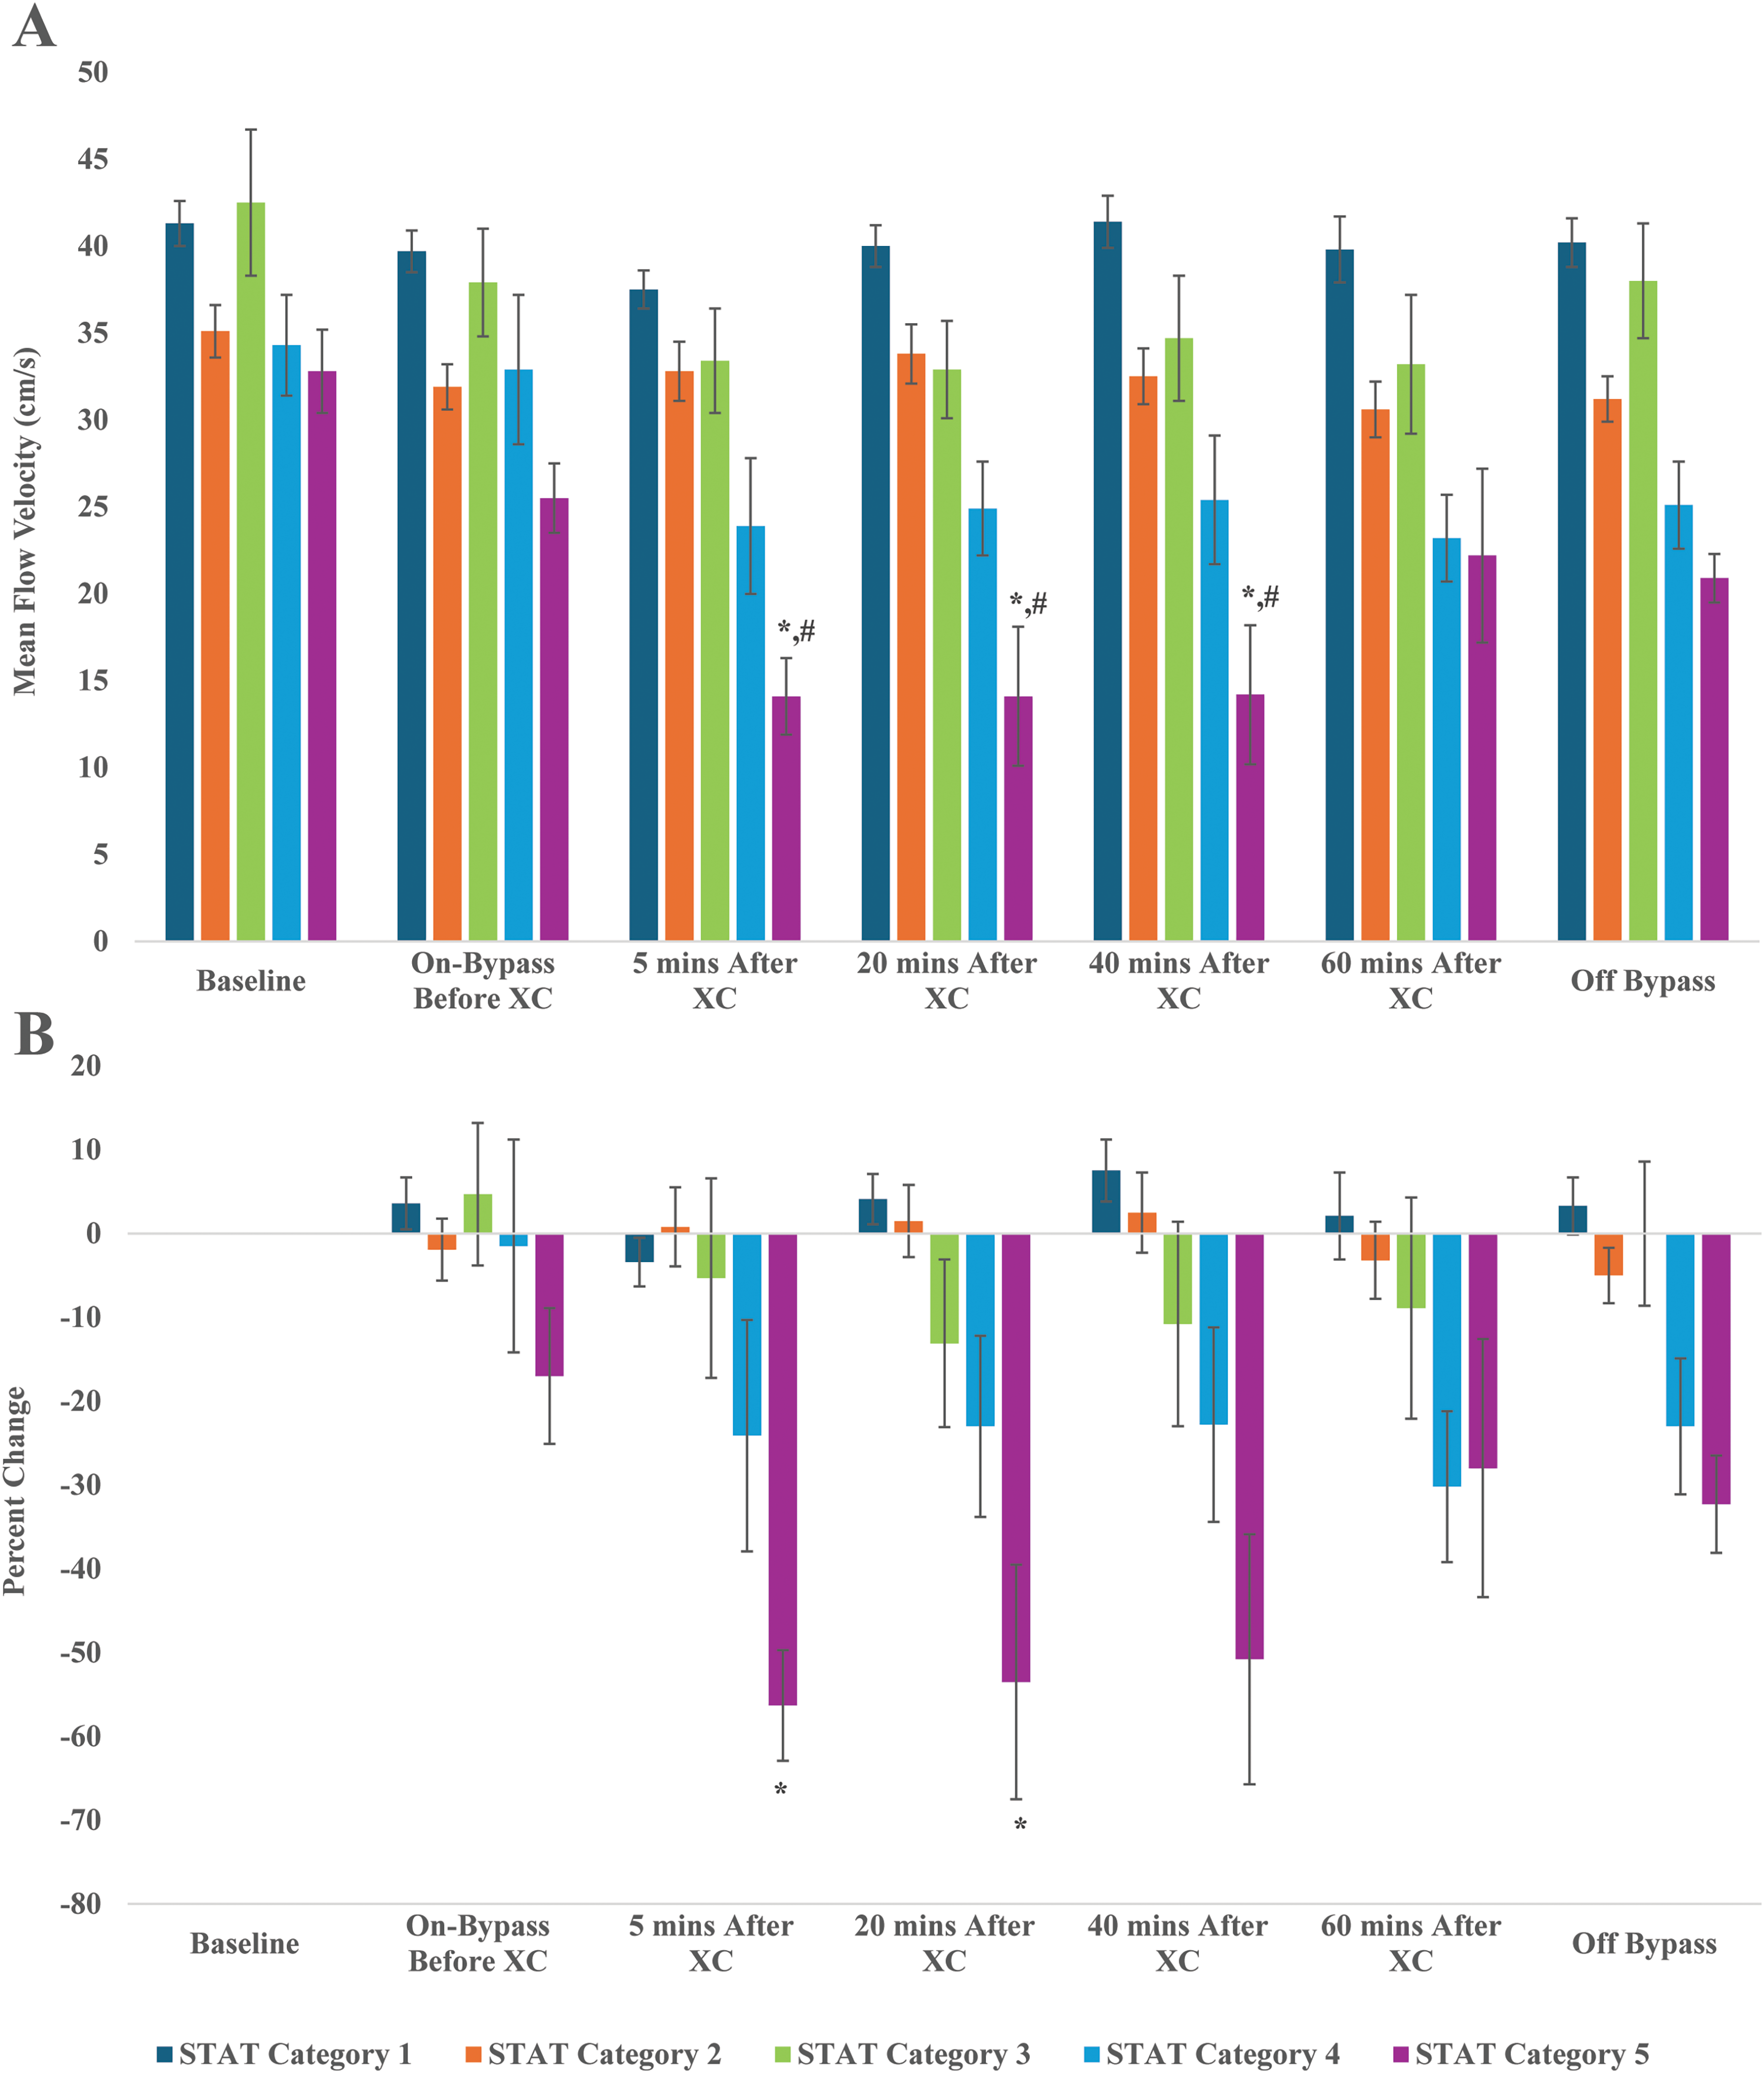
(A) Mean blood flow velocity at the right middle cerebral artery by STAT mortality category. *P < .05, significantly lower than STAT category 1 at given timepoint. #P < .05, significantly lower than respective baseline value. (B) Percent change in mean flow velocity at the right middle cerebral artery at various time points stratified by STAT mortality category. *P < .05, significantly greater percent change compared to before XC at given timepoint. Abbreviation: XC, cross-clamp.
Demographics and Cardiopulmonary Bypass Characteristics for All Neonatal/Pediatric Patients Stratified Based on STAT Mortality Category (Mean ± SD) and Median (25th and 75th Percentiles).
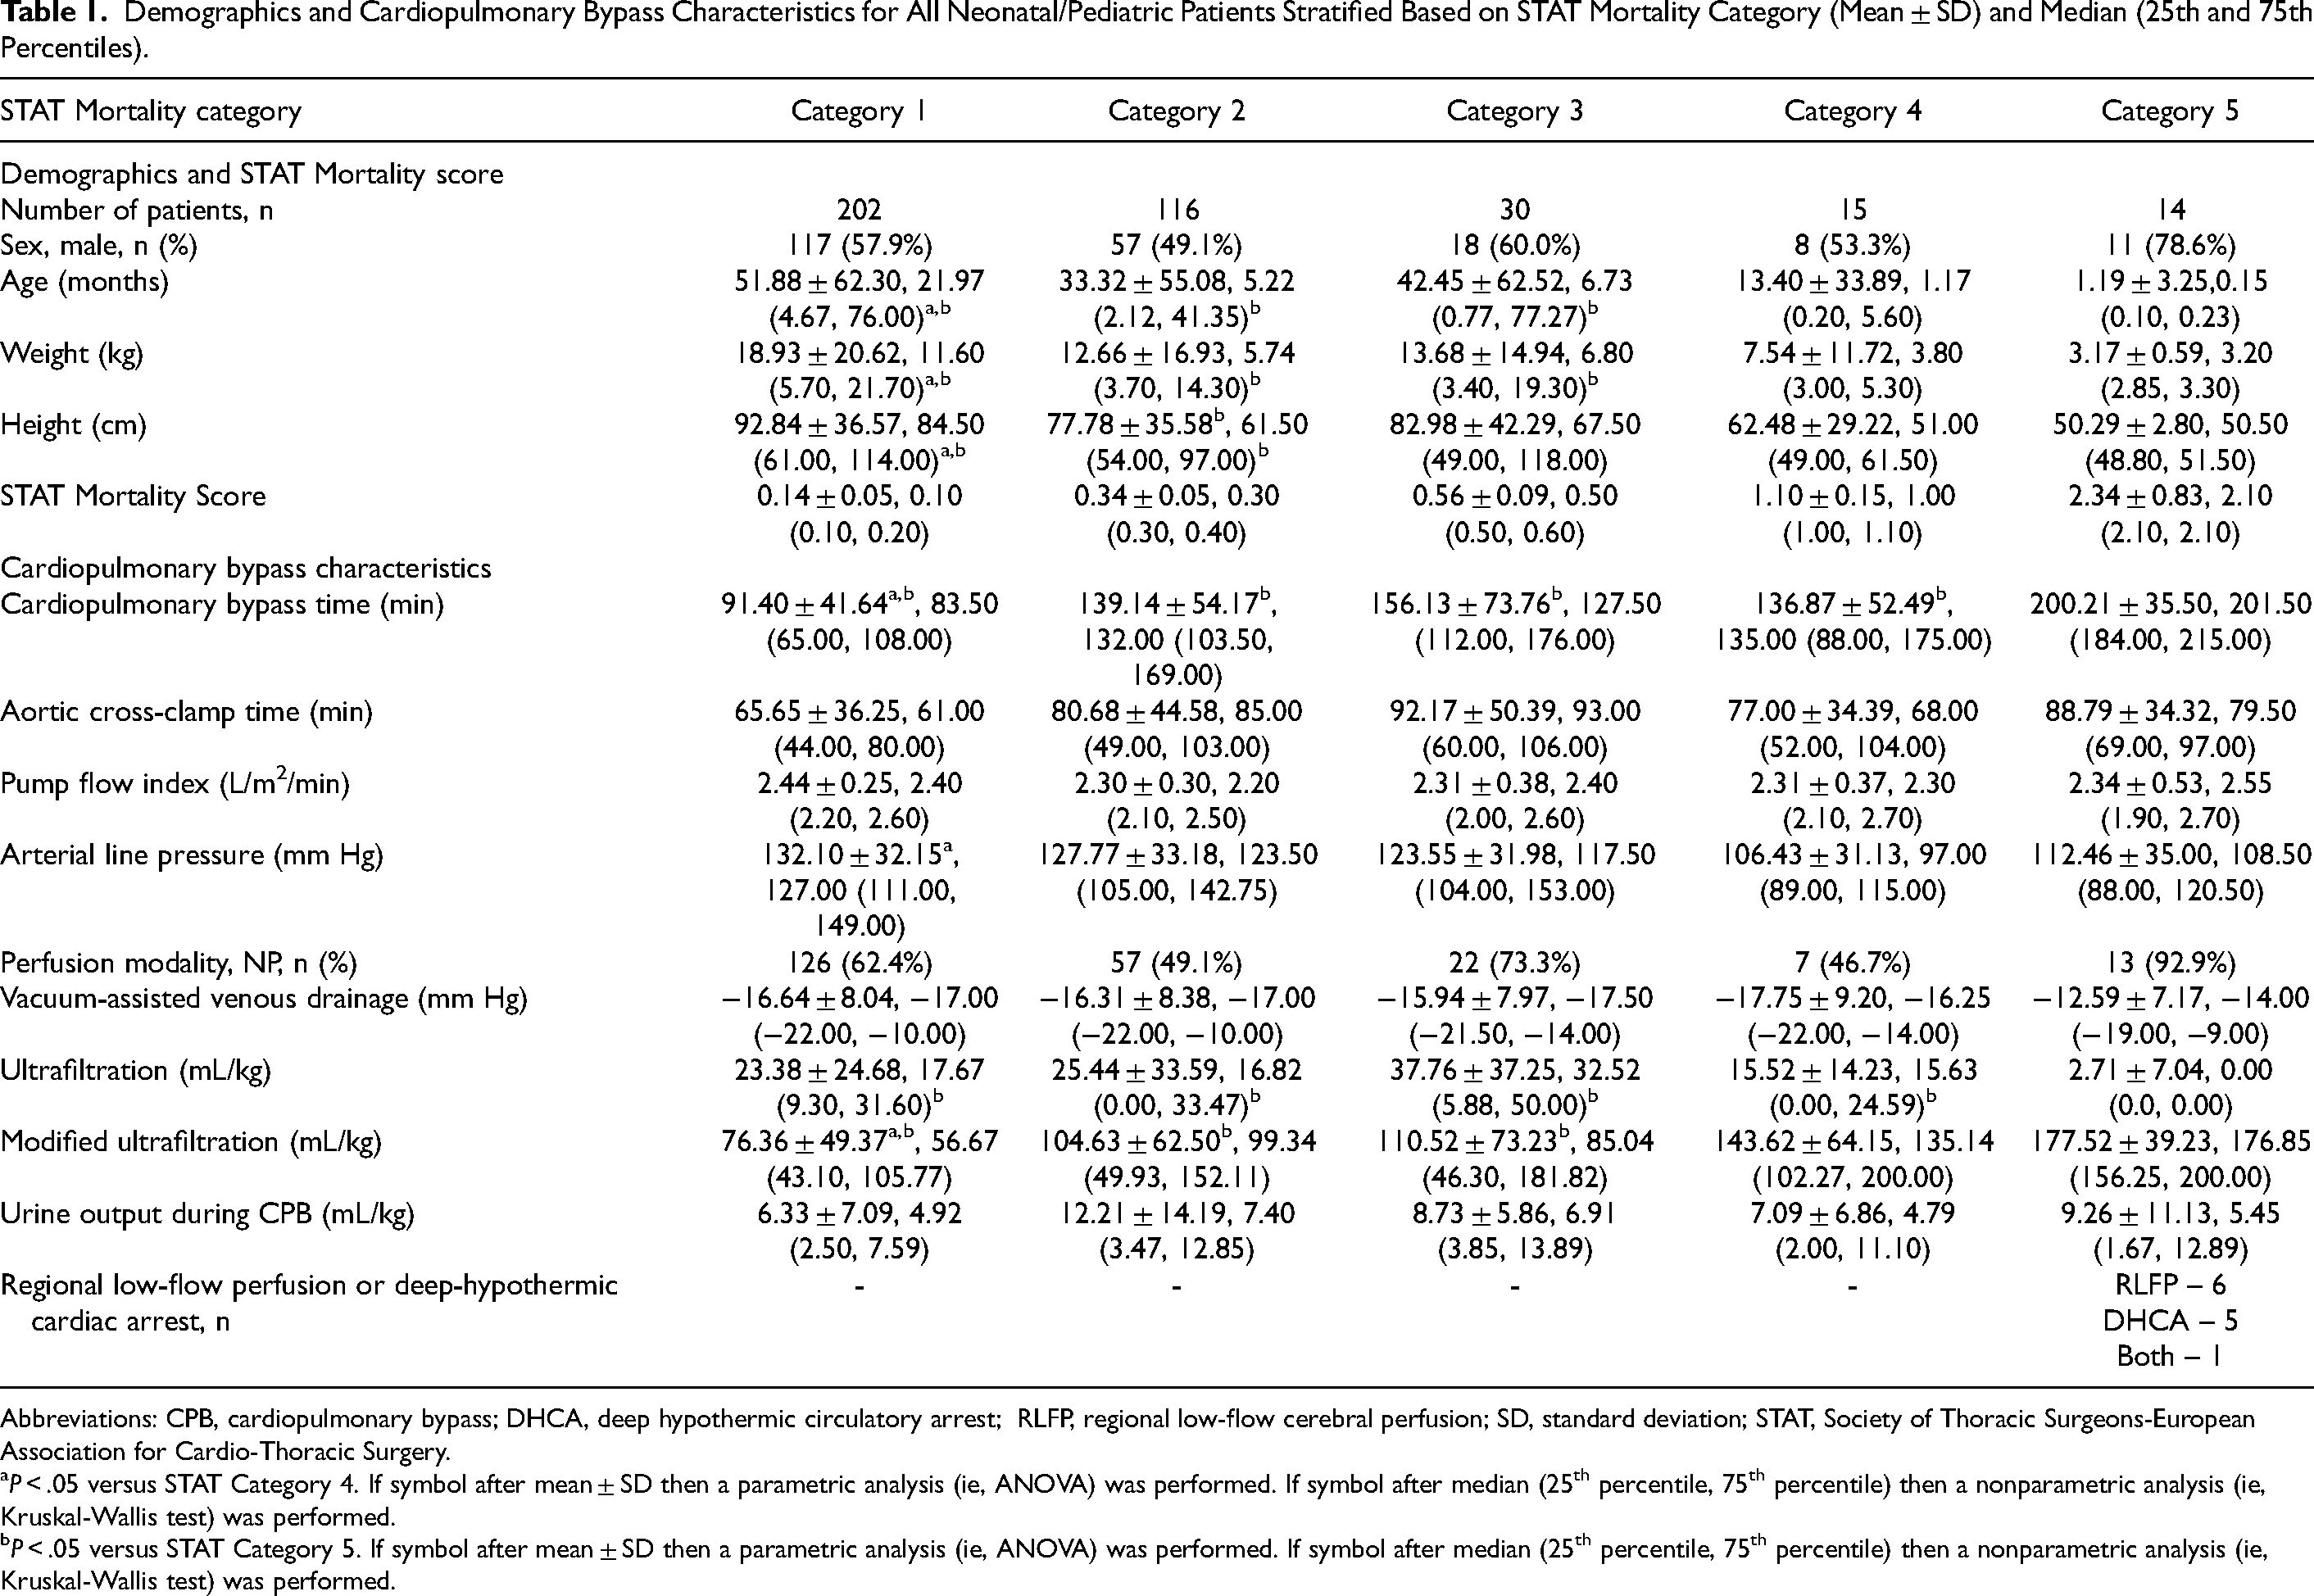
Abbreviations: CPB, cardiopulmonary bypass; DHCA, deep hypothermic circulatory arrest; RLFP, regional low-flow cerebral perfusion; SD, standard deviation; STAT, Society of Thoracic Surgeons-European Association for Cardio-Thoracic Surgery.
P < .05 versus STAT Category 4. If symbol after mean ± SD then a parametric analysis (ie, ANOVA) was performed. If symbol after median (25th percentile, 75th percentile) then a nonparametric analysis (ie, Kruskal-Wallis test) was performed.
P < .05 versus STAT Category 5. If symbol after mean ± SD then a parametric analysis (ie, ANOVA) was performed. If symbol after median (25th percentile, 75th percentile) then a nonparametric analysis (ie, Kruskal-Wallis test) was performed.
Demographics and Cardiopulmonary Bypass Characteristics for All Neonatal/Pediatric Patients Stratified Based on Cyanotic Versus Acyanotic CHD (Mean ± SD) and Median (25th and 75th Percentiles).
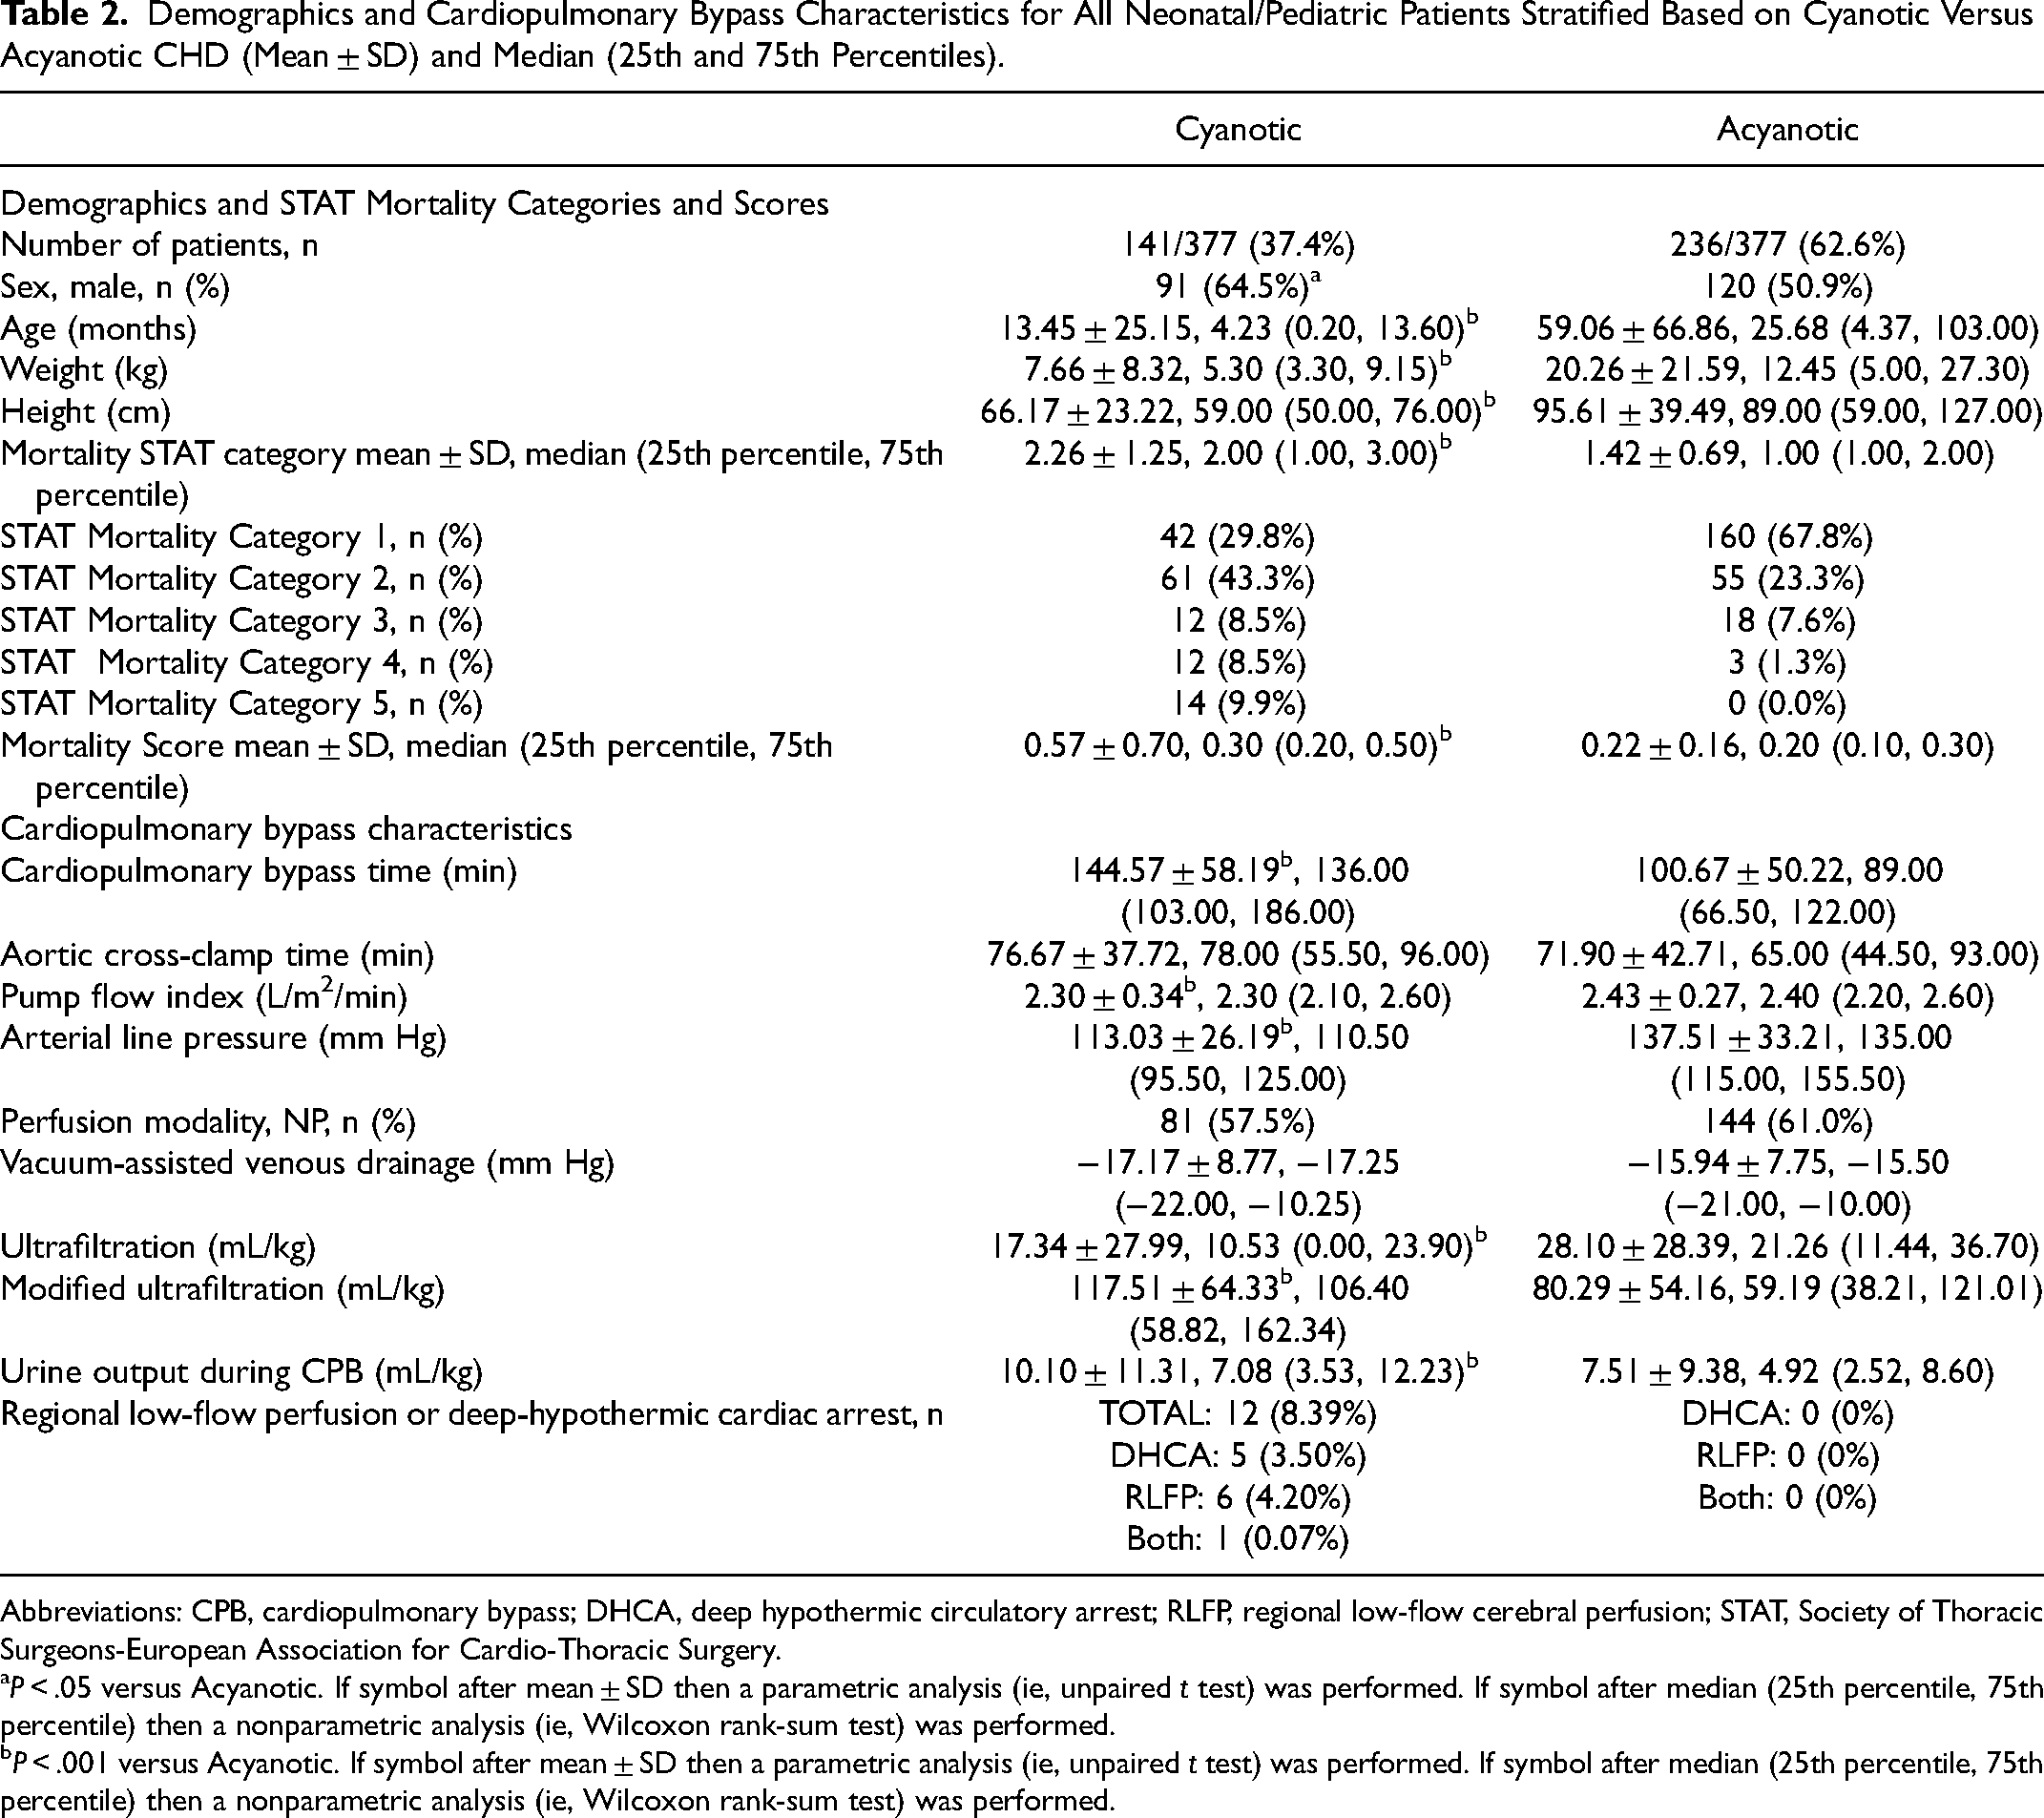
Abbreviations: CPB, cardiopulmonary bypass; DHCA, deep hypothermic circulatory arrest; RLFP, regional low-flow cerebral perfusion; STAT, Society of Thoracic Surgeons-European Association for Cardio-Thoracic Surgery.
P < .05 versus Acyanotic. If symbol after mean ± SD then a parametric analysis (ie, unpaired t test) was performed. If symbol after median (25th percentile, 75th percentile) then a nonparametric analysis (ie, Wilcoxon rank-sum test) was performed.
P < .001 versus Acyanotic. If symbol after mean ± SD then a parametric analysis (ie, unpaired t test) was performed. If symbol after median (25th percentile, 75th percentile) then a nonparametric analysis (ie, Wilcoxon rank-sum test) was performed.
Cerebral Hemodynamics
Data collected using TCD and NIRS are presented in Figures 1 to 4. Transcranial doppler results revealed that STAT category 5 patients demonstrated significantly lower mean flow velocities at the right MCA compared with patients in STAT mortality category 1 at 5, 20, and 40 min following cross-clamp (Figure 1A). Furthermore, the mean flow velocities of STAT category 5 patients decreased significantly (as low as 56%) from their respective baseline values after cross-clamp application and failed to return to baseline values after CPB termination (down to 32%) (Figure 1B), despite the patients being back to their baseline temperature (Supplemental Figure 1A). Cyanotic patients were found to have lower mean flow velocities compared to acyanotic at all time points, including baseline values (Figure 2A). Mean flow velocity percent changes were all negative and were also significantly decreased from pre-cross-clamp at 5 and 20 min after cross-clamp (Figure 2B; P < .001).
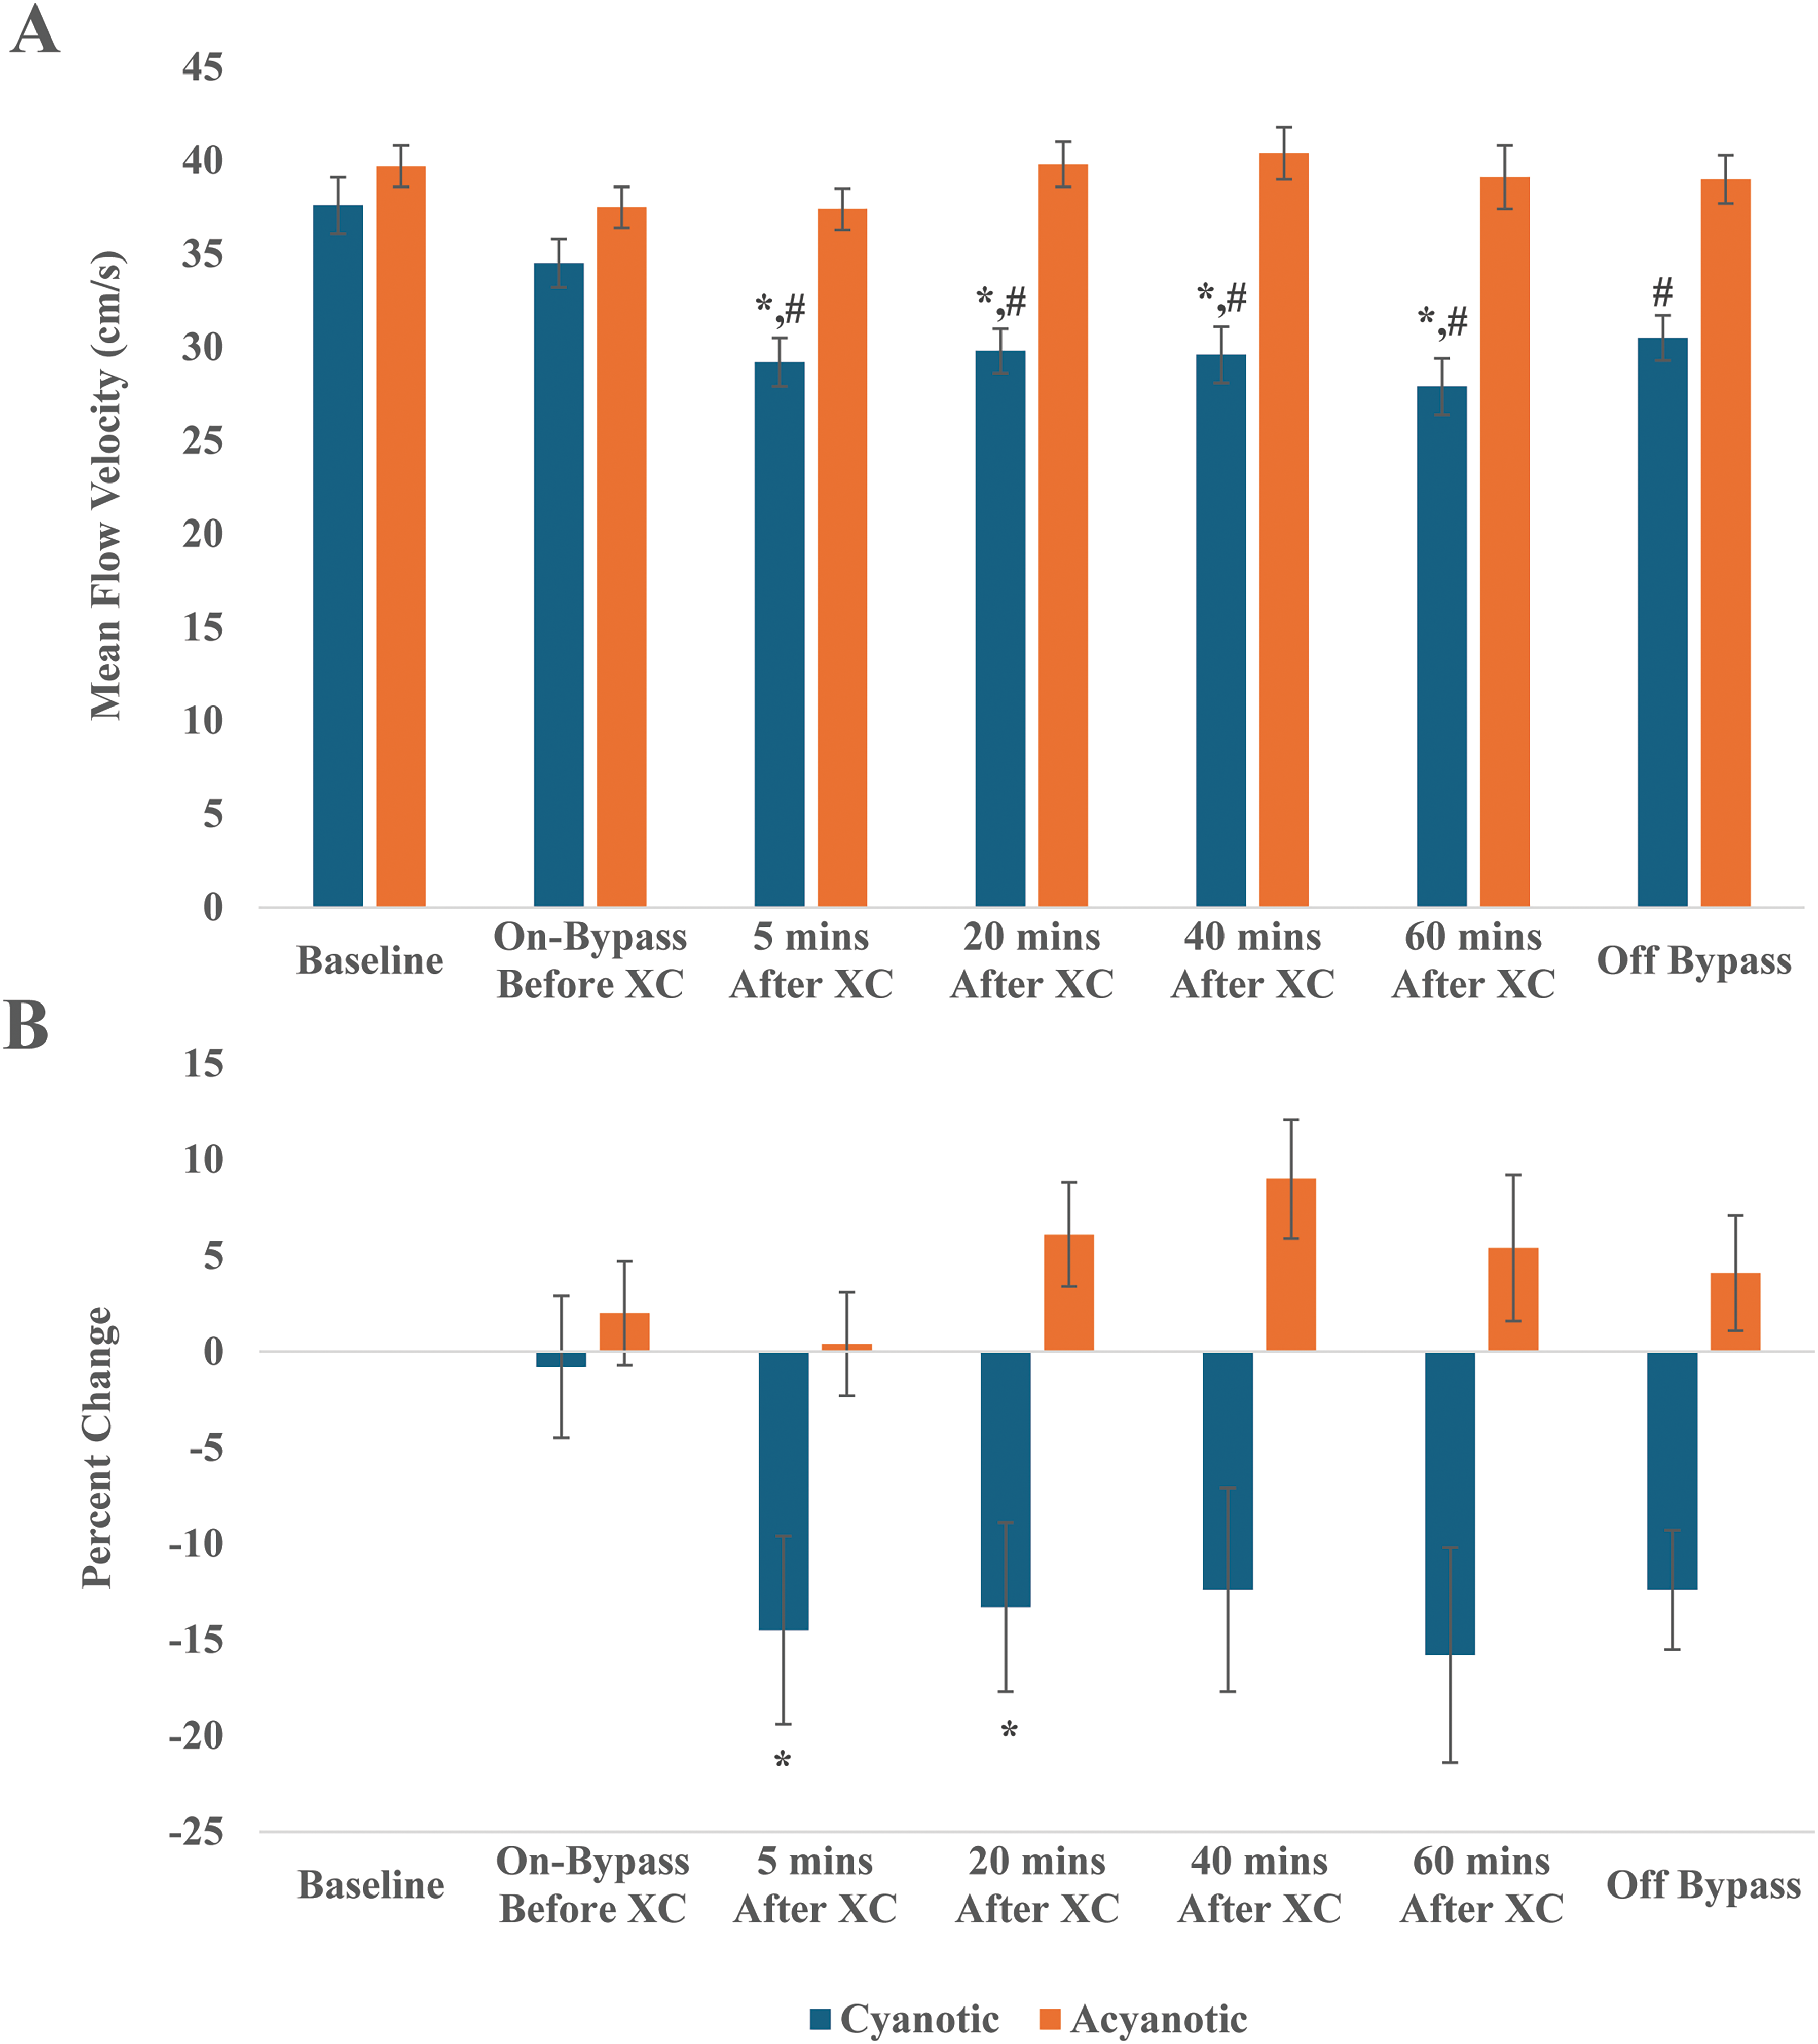
(A) Mean blood flow velocity at the right middle cerebral artery stratified by cyanotic or acyanotic CHD. *P < .05, significantly lower than acyanotic value at given timepoint. #P < .001, significantly lower than baseline value. (B) Percent change in mean flow velocity at the right middle cerebral artery at various time points stratified by cyanotic or acyanotic CHD. *P < .001, significantly greater percent change compared with before XC at given timepoint. Abbreviations: CHD, congenital heart disease; XC, cross-clamp.
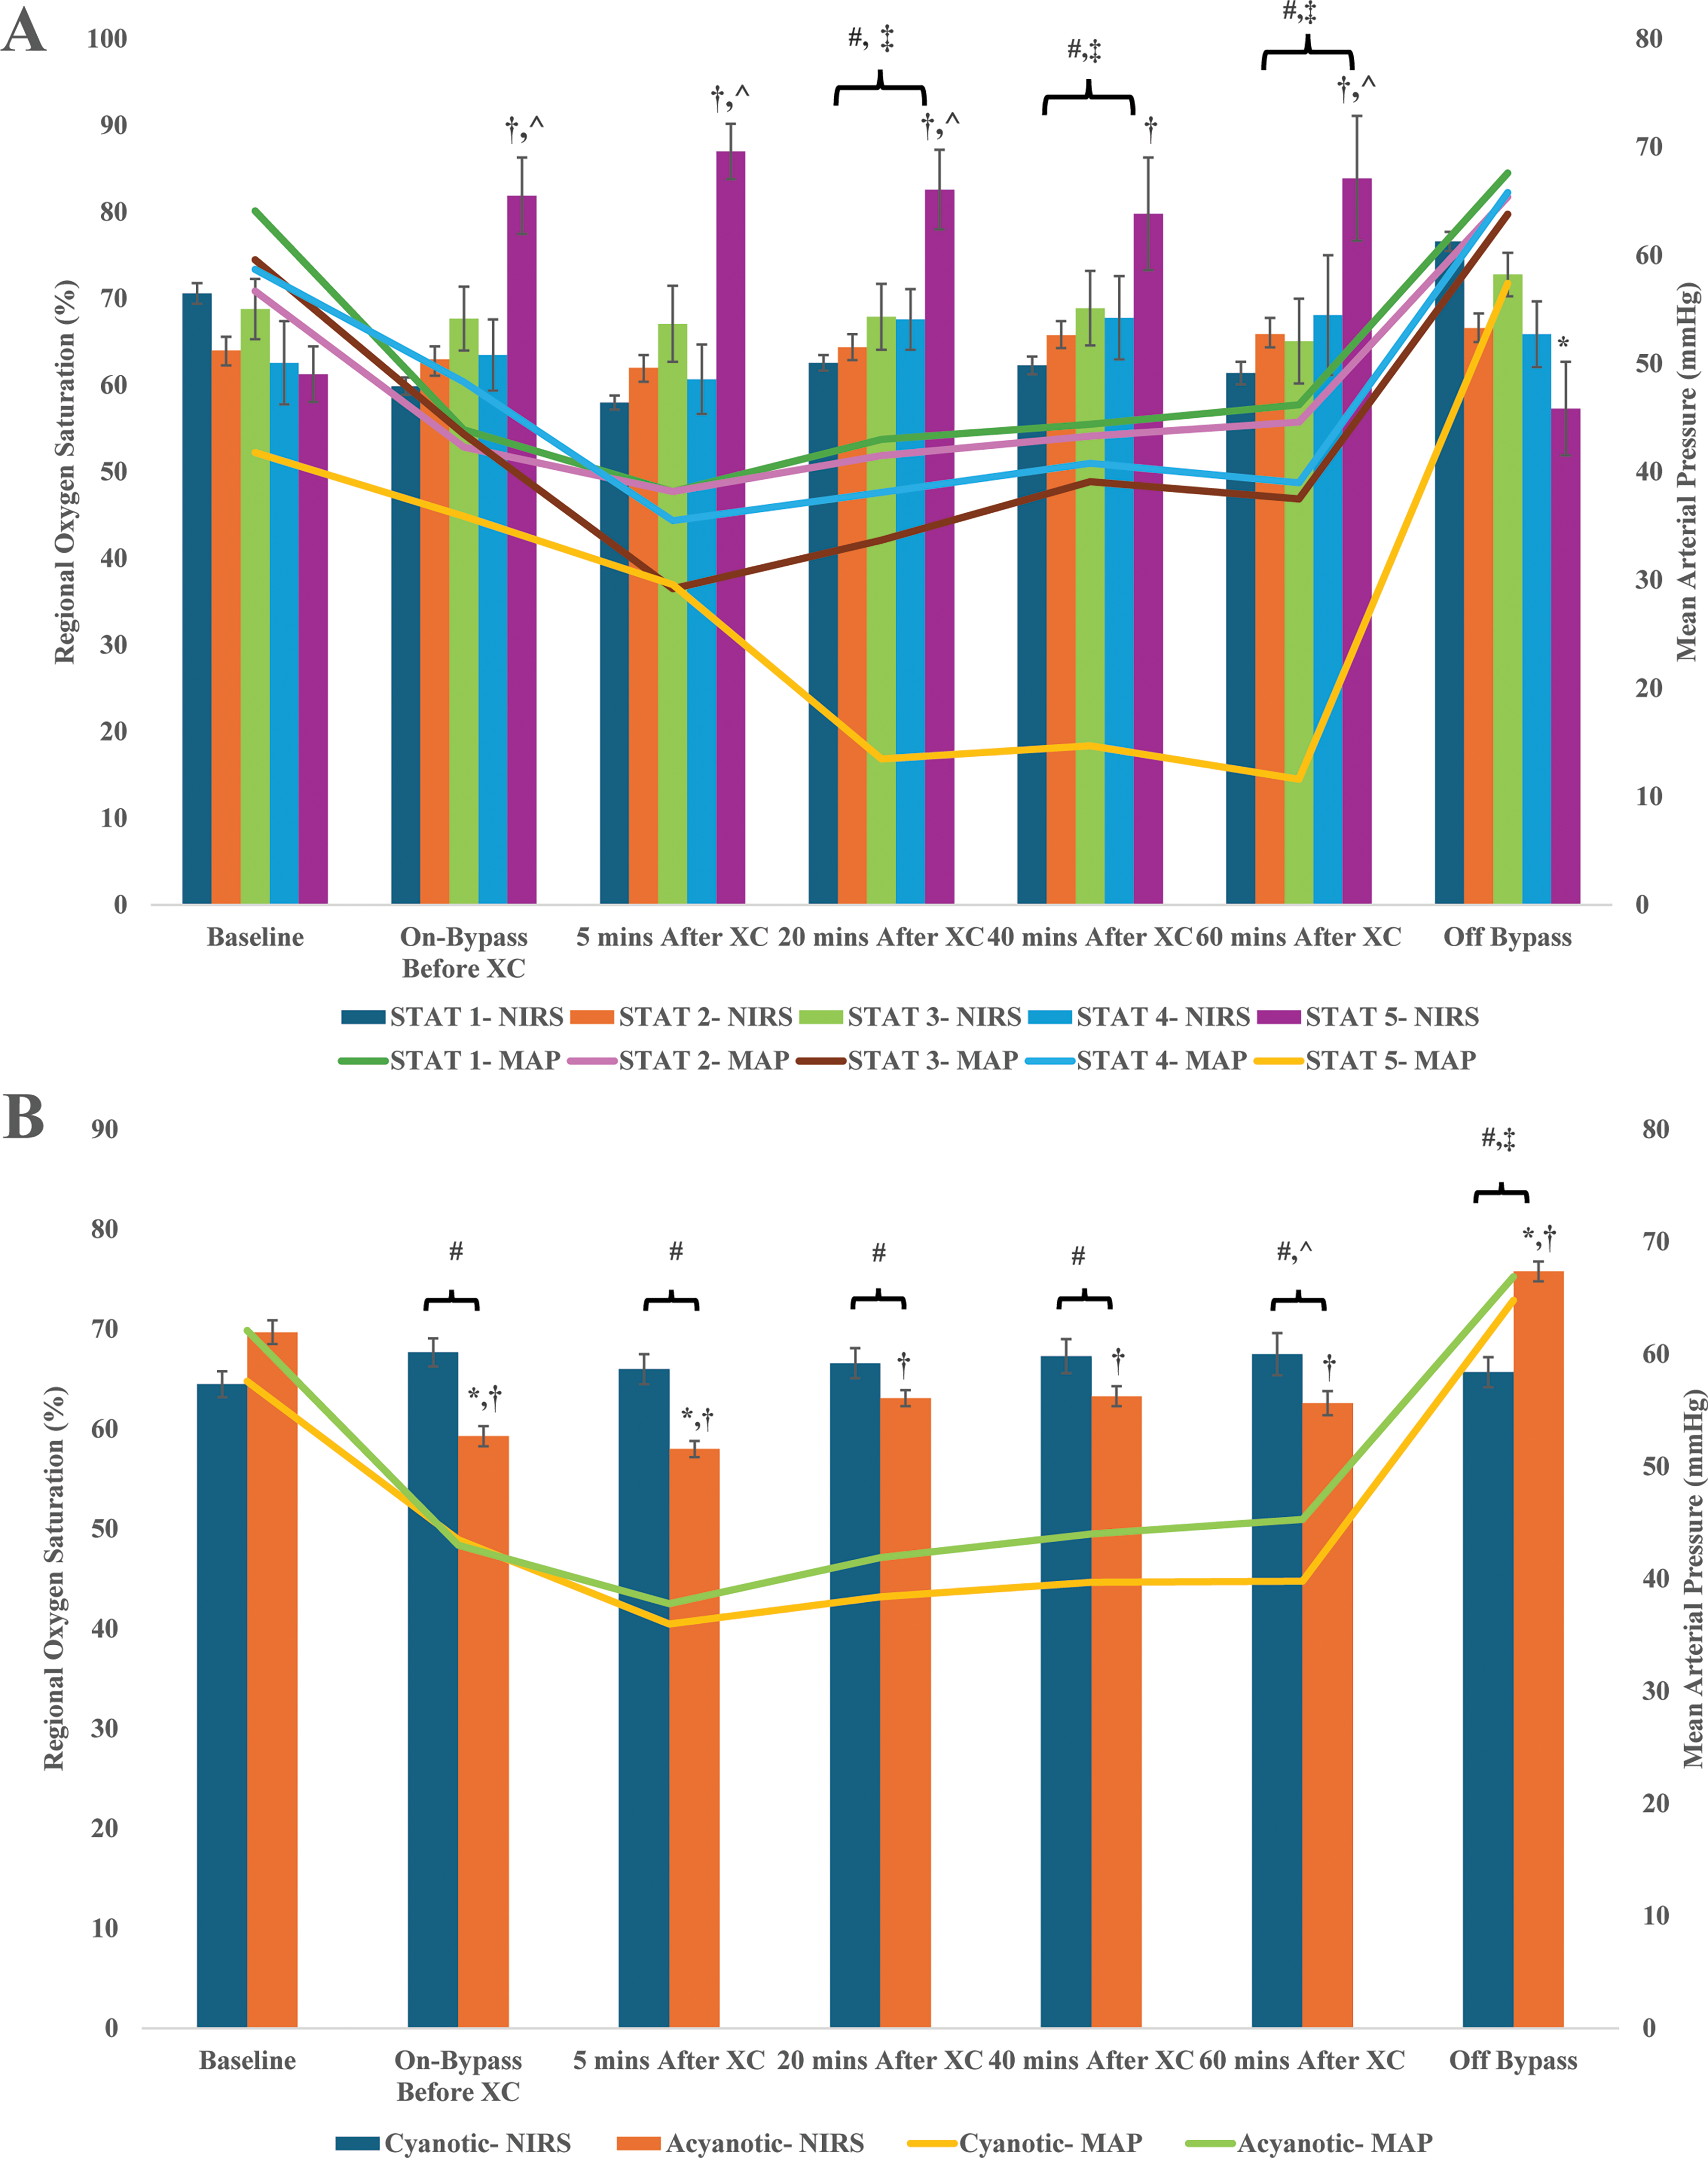
(A) Left cerebral oxygen saturation measured using near infrared spectroscopy (NIRS) and mean arterial pressures at various time points stratified by STAT mortality category. †P < .001, significantly greater cerebral oxygen saturation than baseline value. *P < .005, significantly lower cerebral oxygen saturation in STAT category 5 at given timepoint than all timepoints while on bypass. ^P ≤ .05, significantly greater cerebral oxygen saturation thanT STA category 1 at given timepoint. #P < .001, significantly lower mean arterial pressure in STAT category 5 at given timepoint than baseline value. ‡P < .001, significantly lower mean arterial pressure in STAT category 5 than in categories 1 to 4 at given timepoint. (B) Left cerebral oxygen saturation measured using NIRS and mean arterial pressures at various time points stratified by cyanotic or acyanotic CHD. †P < .001, significantly different cerebral oxygen saturation in acyanotic patients than baseline. *P < .05, significantly different cerebral oxygen saturation between cyanotic and acyanotic patients at given time point. #P < .001, significantly different mean arterial pressure for cyanotic and acyanotic patients than respective baseline values at given time point. ^P < .05, significantly lower mean arterial pressure for cyanotic patients than acyanotic patients. ‡P < .001, significantly greater mean arterial pressures for cyanotic and acyanotic patients than all other timepoints. Abbreviation: CHD, congenital heart disease; STAT, Society of Thoracic Surgeons-European Association for Cardio-thoracic Surgery; XC, cross-clamp.
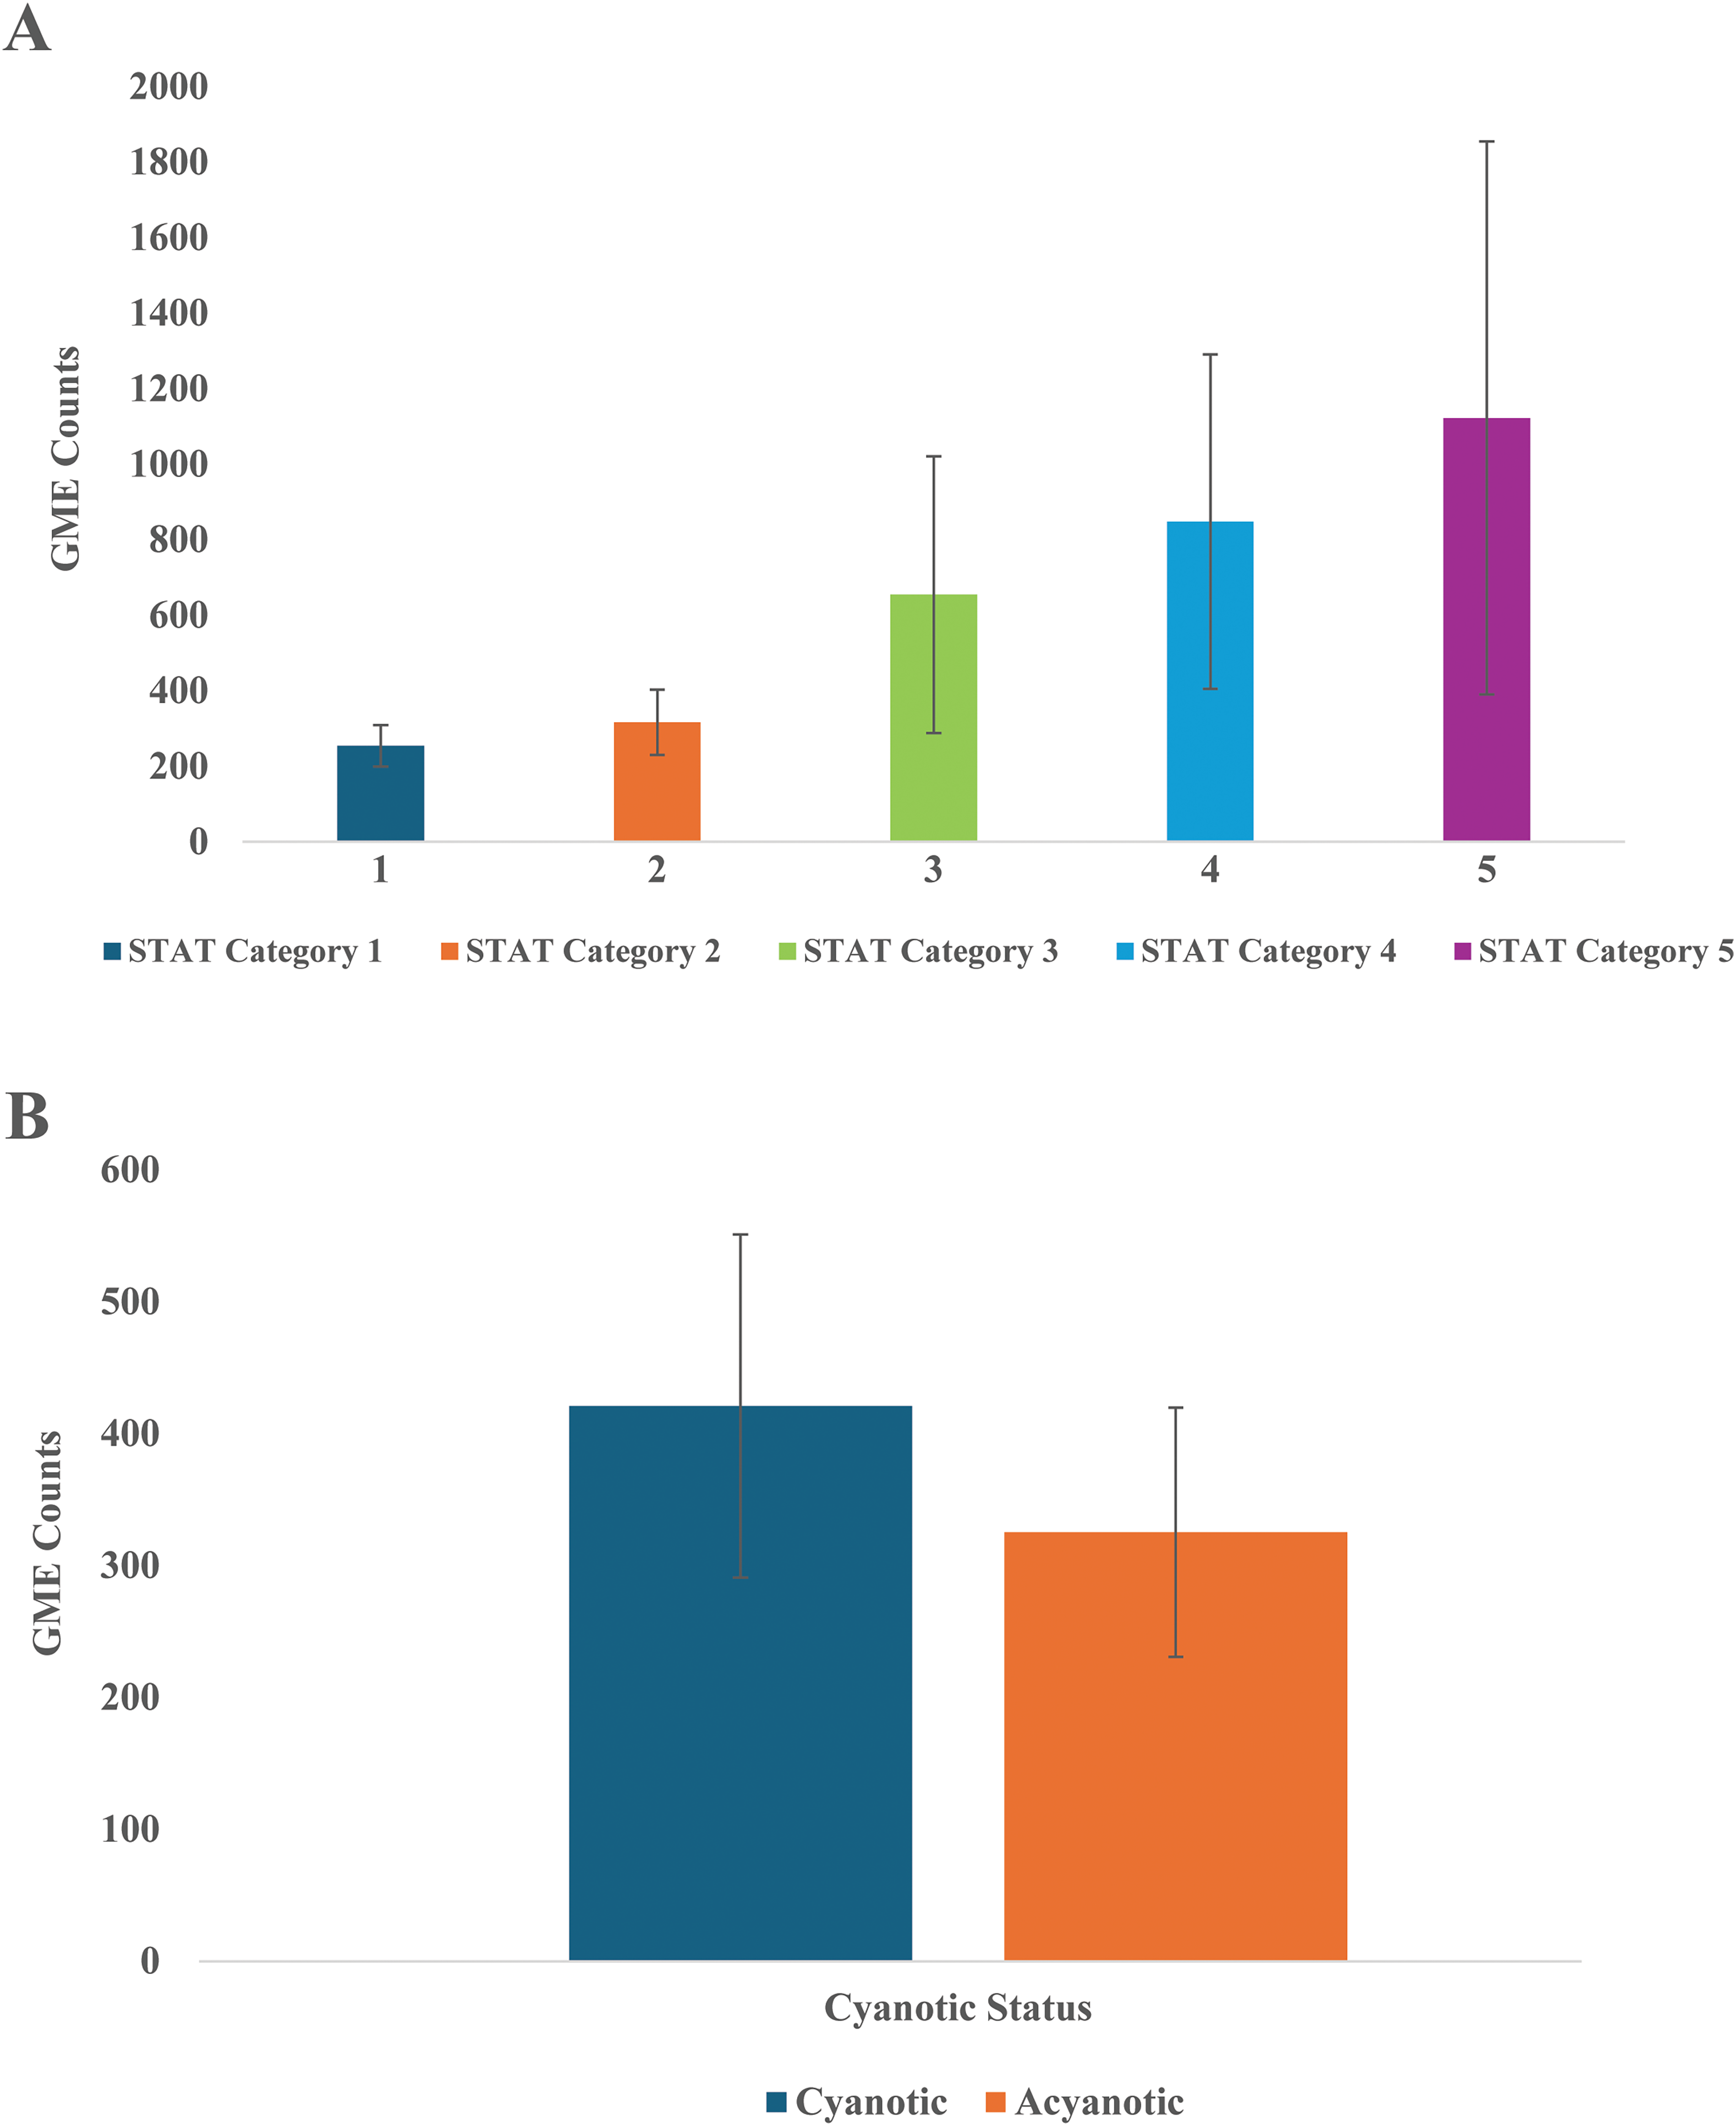
(A) Mean gaseous microemboli count at the right middle cerebral artery by STAT mortality category. (B) Mean gaseous microemboli count at the right middle cerebral artery by cyanotic or acyanotic CHD. Abbreviation: GME, gaseous microemboli; STAT, Society of Thoracic Surgeons-European Association for Cardio-thoracic Surgery.
Cerebral rSO2 levels were significantly higher for STAT category 5 patients during CPB (except 40 min after cross-clamp) compared with saturation levels for STAT category 1 patients (Figure 3A). Additionally, cerebral rSO2 levels were significantly higher for STAT category 5 patients during CPB compared with their baseline cerebral saturation levels. After termination of CPB, cerebral rSO2 levels for STAT category 5 patients dropped significantly compared with values during CPB. Mean arterial pressures were significantly lower for STAT category 5 patients during CPB at 20, 40, and 60 min after aortic cross-clamping compared with mean arterial pressures of patients from all other mortality categories. Furthermore, mean arterial pressures of STAT category 5 patients also decreased significantly during CPB at 20, 40, and 60 min after aortic cross-clamping compared with their baseline mean arterial pressures. After CPB termination, mean arterial pressures remained lower for STAT category 5 patients compared with patients in other mortality categories.
Similar trends were seen in the cyanotic analysis with higher cerebral rSO2 levels for cyanotic patients during CPB compared with saturation levels for acyanotic patients (Figure 3B). Levels were increased from cyanotic baseline rSO2 levels and decreased off bypass. The opposite findings were seen in the acyanotic group with rSO2 levels dropping from baseline during bypass and rising above baseline levels after bypass was terminated. Mean arterial pressure levels were lower for cyanotic patients at all timepoints except on bypass before aortic cross-clamping.
Stratified by mortality categories, the number of GME counts increased with each STAT mortality category increase (Figure 4A). When classified by cyanosis, cyanotic groups appeared to have greater total mean GME counts than acyanotic groups (Figure 4B). However, GME counts were only weakly correlated with mean flow velocity and rSO2 for patients in all mortality categories and of both cyanotic and acyanotic heart disease (|r| < 0.3). Statistically significant moderate correlation (P < .05, 0.3 < r < 0.5) between GME counts and mean flow velocity occurred while on bypass before XC and 20 and 60 min following XC for STAT category 3 patients (Supplemental Table 1). Refer to Supplemental Table 1 for further correlational data of GME counts versus mean flow velocity and rSO2.
Clinical Outcomes Stratified by STAT Mortality Category and Cyanotic Versus Acyanotic Congenital Heart Disease
As expected, patients in mortality STAT category 5 had significantly longer intubation durations compared with patients in all other categories (Table 3). Additionally, patients in STAT category 4 experienced significantly longer ICU and hospital LOS compared with patients in STATcategory 1, and patients in STAT category 5 experienced significantly longer ICU and hospital LOS compared with patients in all other categories. While mortality rates within 180 days steadily increased with increasing mortality categories, statistical significance was only noted between patients in STAT categories 1 and 5 (Table 3). Causes of mortality included but were not limited to arrhythmia, heart failure with hemodynamic instability, and cardiac arrest.
Clinical Outcomes for Patients Stratified by STAT Mortality Category and Cyanotic Versus Acyanotic CHD (Mean ± SD) and Median (25th and 75th Percentiles).
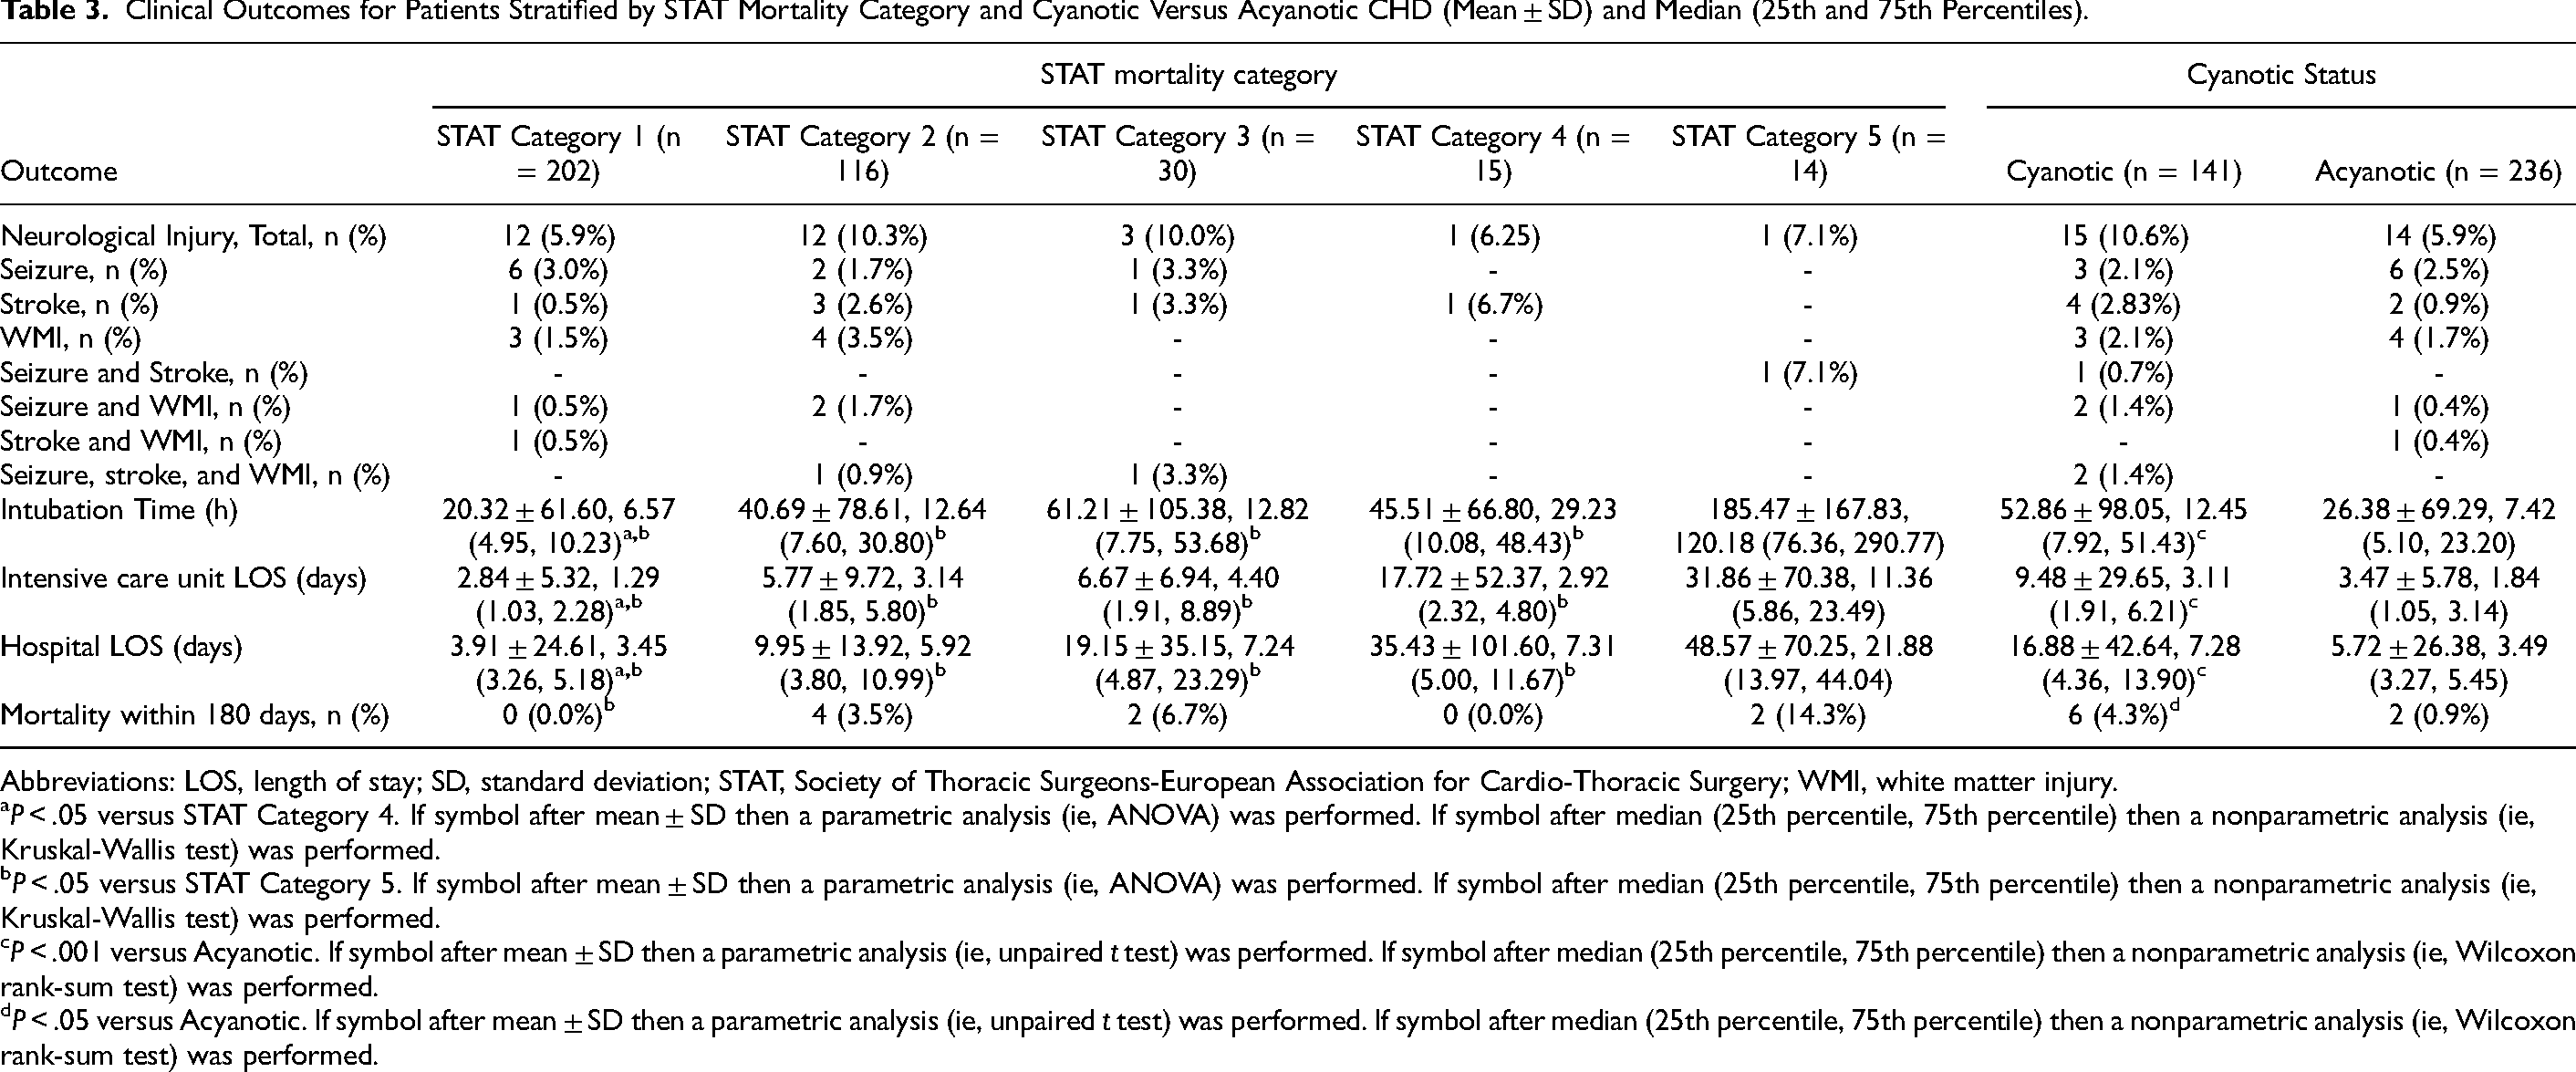
Abbreviations: LOS, length of stay; SD, standard deviation; STAT, Society of Thoracic Surgeons-European Association for Cardio-Thoracic Surgery; WMI, white matter injury.
P < .05 versus STAT Category 4. If symbol after mean ± SD then a parametric analysis (ie, ANOVA) was performed. If symbol after median (25th percentile, 75th percentile) then a nonparametric analysis (ie, Kruskal-Wallis test) was performed.
P < .05 versus STAT Category 5. If symbol after mean ± SD then a parametric analysis (ie, ANOVA) was performed. If symbol after median (25th percentile, 75th percentile) then a nonparametric analysis (ie, Kruskal-Wallis test) was performed.
P < .001 versus Acyanotic. If symbol after mean ± SD then a parametric analysis (ie, unpaired t test) was performed. If symbol after median (25th percentile, 75th percentile) then a nonparametric analysis (ie, Wilcoxon rank-sum test) was performed.
P < .05 versus Acyanotic. If symbol after mean ± SD then a parametric analysis (ie, unpaired t test) was performed. If symbol after median (25th percentile, 75th percentile) then a nonparametric analysis (ie, Wilcoxon rank-sum test) was performed.
Out of the 14 STAT Category 5 patients, only 12 underwent DHCA (5), RLFP (6), or both (1). Two out of the 14 patients did not undergo DHCA or RLFP. One of these patients underwent an emergent repair of an obstructed infracardiac total anomalous pulmonary venous return with the creation of a left-modified Blalock-Taussig-Thomas (BTT) shunt and patent ductus arteriosus ligation. The patient was cooled to 22°, and the cross-clamp time was 40 min. The other patient underwent a Damus-Kaye-Stansel connection procedure with atrial septectomy and right-modified BTT shunt. The patient was cooled to 25°, and the cross-clamp time was 69 min. However, both are considered STAT category 5 patients. All patients who underwent DHCA or RLFP were cyanotic.
As expected, patients in the cyanotic group experienced significantly longer intubation times, longer ICU LOS, and longer hospital LOS compared with acyanotic patients. Mortality within 180 days was higher in the cyanotic group (6/141 patients (4.3%)) versus the acyanotic group (2/236 patients (0.9%)) (Table 3).
Neurological Injury and Mortality
Twenty-nine patients experienced postoperative neurological injury as defined by episodes of seizure (n = 9), stroke (n = 6), WMI (n = 7), or a combination of the three (seizure and stroke: n = 1; seizure and WMI: n = 3; stroke and WMI: n = 1; all three: n = 2) (Table 3). Instances of neurological injury were experienced by patients from all five STAT Mortality Categories (Category 1: n = 12/202 (5.94%); Category 2: n = 12/116 (10.34%); Category 3: n = 3/30 (10.00%); Category 4: n = 1/15 (6.67%); Category 5: n = 1/14 (7.14%)) and both cyanotic and acyanotic conditions (cyanotic: n = 15/141 (10.64%); acyanotic: n = 14/236 (5.93%)). However, GME counts did not show any correlation with neural injury (r = −0.05 for all patients) or with patients in all mortality categories or cyanotic or acyanotic CHD. Additionally, GME counts did not show any correlation with 180-day mortality (r = 0.03 for all patients) or with patients in all mortality categories or cyanotic or acyanotic CHD.
Comment
We made the following notable observations regarding cerebral hemodynamics, GME counts, and clinical outcomes using multimodality neuromonitoring intraoperatively in congenital heart surgery patients with different STAT mortality categories and cyanotic or acyanotic CHD. First, mean cerebral blood flow velocity in high-risk and cyanotic patients with TCD was significantly lower even though the rSO2 levels with NIRS were higher in the same patient populations. Second, GME counts were 1.3- to 4.4-fold higher in the STAT Mortality Category 5 patients and 1.3-fold higher in cyanotic patients compared with other patients in the lower risk categories and acyanotic patients, respectively. Last, GME counts do not correlate with neurological injury for both risk-stratified and cyanotic patients.
The most compelling finding of the current study is the trend noted in mean cerebral flow velocities during CPB when patients are stratified based on mortality categories. Results collected using intraoperative TCD ultrasound revealed that mean cerebral blood flow velocities at the right middle cerebral artery in patients from STAT mortality category 5 were consistently and significantly lower during CPB than those in patients from all other mortality categories. Even more importantly, while mean flow velocities of patients in mortality categories 1 to 4 returned to their respective baseline values after termination of CPB, mean flow velocities of patients in STAT mortality category 5 remained significantly lower than their baseline values, despite normothermia. This finding suggests that cerebral perfusion may remain compromised in the most high-risk patients even after CPB has been terminated. The same finding is noted in cyanotic patients where cerebral blood flow did not return to baseline and remained significantly lower despite normothermia, with temperatures even higher off bypass in the cyanotic group compared to the acyanotic group. However, we are unsure whether a hysteresis effect played a role in the persistent decrease in cerebral blood flow velocities among STAT Category 5 and cyanotic patients after rewarming, as we could not directly measure the brain parenchymal temperature.
Interestingly, rSO2 data collected using intraoperative NIRS showed that despite the significant decline in mean cerebral flow velocities, and the cerebral rSO2 levels were significantly higher in STAT mortality category 5 patients. This disparity is most likely observed because a significant percentage of category 5 patients underwent RLFP with deep hypothermia (18 °C). With significant cooling, cerebral metabolism and oxygen demand decrease.
While NIRS is the most widely utilized neuromonitoring modality, these findings suggest that it may not represent the full picture regarding cerebral perfusion, such as the cerebral blood flow velocity measured using TCD devices, emphasizing the need for multimodality neuromonitoring during CPB. This is likely playing a factor in our findings for cyanotic patients, as this cohort contained the entire group of patients that underwent RLFP and DHCA.
Another crucial trend identified in this study is between GME counts, mortality categories, and cyanotic status. Gaseous microemboli counts measured using intraoperative TCD ultrasound consistently increased with rising the STAT mortality risk. The GME counts were 1.3- to 4.4-fold higher in the STAT Mortality Category 5 patients than those in the lower risk categories and 1.3 fold higher in cyanotic patients than acyanotic patients. These are most likely due to the increased CPB times that higher risk patients undergo, allowing them to experience higher number of overall GME counts. In this study, we could not differentiate between the gaseous and particulate microemboli due to the limited algorithms of the TCD system used. Furthermore, though the delivery of microemboli was quantified via HITS, the TCD system used was unable to characterize HITS beyond that they were greater than 40 microns. This restriction in volume and size detection limited our ability to determine the severity of the various GME counts from intravascular sources. In a prior study, 17 the Emboli Detection and Classification (EDAC) Quantifier was used to detect extracorporeal sources of microemboli in the venous and arterial lines. The EDAC was able to distinguish emboli as small as 10 microns and categorize them based on size and volume. The results from this study showed that the major source of microemboli originated in the venous line prior to the initiation of bypass. Additionally, though the CPB circuit was able to purge most of the emboli at the start of bypass, a significantly greater number of emboli, compared to during bypass, reached the arterial line and was transmitted to the patient. Moreover, most emboli in the arterial line were sized below the detection limit of the traditional TCD system (93% were <40 microns), implying that emboli exposure may be greater than initially thought. While these results prompted a modification in our own CPB protocol to include deairing of the venous line prior to bypass, they also emphasize the necessity for more sophisticated TCD devices and algorithms to further categorize and analyze microemboli formation type (gaseous vs particulate) and size during CPB.21–24
A final critical finding in this study is the increasing trend of GME counts in patients from STAT Category 1 to Category 5 and from acyanotic to cyanotic patients and its relationship to neurological injury. Twenty-nine patients from all five STAT Mortality Categories and both cyanotic and acyanotic conditions experienced a postoperative outcome of neurological injury as defined by seizure, stroke, WMI, or a combination of two or three. The study found that increased microemboli delivery to cerebral vasculature in higher risk and cyanotic patients did not correlate with a rise in neurological complications. To better understand the effects of CPB on neurological deficits beyond what was measured in this study, further study is necessary. Our lab is currently conducting an analysis of the presence of protein biomarkers known to be associated with neurological injury, which may be a viable method for determining perioperative adverse events beyond the imaging and EEG that were used in this study.
In this retrospective observational study, we recognize that not all 377 patients underwent postoperative EEG or MRI, which presents an opportunity for further investigation. Notably, we identified 29 cases of postoperative neurological injury among these patients. This included nine instances of seizures, six of strokes, seven of WMI, and several combinations thereof; for example, there were patients who experienced both seizures and strokes (one patient), or seizures alongside WMI (three patients), and others who faced all three challenges (two patients).
It is encouraging to see that our findings reflect a diverse range of experiences across all five STAT Mortality Categories: Category 1 (12 patients, 5.94%), Category 2 (12 patients, 10.34%), Category 3 (3 patients, 10.00%), Category 4 (1 patient, 6.67%), and Category 5 (1 patient, 7.14%). Additionally, the data include patients with both cyanotic (15 patients, 10.64%) and acyanotic conditions (14 patients, 5.93%). This information will guide us as we work toward enhancing outcomes in future studies and interventions.
While our findings indicate that there is no direct correlation between changes in TCD data and neurological outcomes, it is important to recognize the significant alterations we have observed. These changes deserve our thoughtful consideration, especially as they reflect the complexities of patient care. Figures 1B and 2B reveal notable shifts in cerebral blood flow velocities among different STAT categories, with reductions reaching as high as 56%. Furthermore, the differences we observe between cyanotic and acyanotic patients highlight important distinctions in their experiences. The trends in GME counts within the middle cerebral artery, captured in Figure 4A and B, offer additional insights into these dynamics. Although we did not find a correlation with neurological injury among the individuals studied (n = 29), the variations seen through TCD remain significant and should be approached with the attention and compassion that our patients deserve.
The results of this retrospective observational study should not be generalized to all congenital heart surgery patients undergoing CPB. Specifically, the cyanotic group included all DHCA and RLFP patients in our cohort, while the acyanotic group had a lower risk stratification and mortality score. To conduct a thorough analysis of all 377 patients in this retrospective observational study, we employed the STAT 2020 risk stratification and mortality scores, along with the type of heart disease. The data collected from patients who underwent RLFP and DHCA represent the most significant findings in our manuscript. Excluding this specific group from the second part of the analysis while including it in the first could introduce bias. Therefore, we chose not to exclude any patients from either part of the analysis to remain consistent with our original objectives.
Conclusions
In the present study, we identified intraoperative utilization of the TCD, in addition to the routine use of NIRS, which can help to pinpoint changes in cerebral hemodynamics in terms of mean cerebral blood flow velocity and GME count in congenital heart surgery patients with different STAT mortality and different cyanosis categorization during CPB. The patients undergoing congenital cardiac operations with high mortality risk and with a cyanotic diagnosis on CPB are at a greater risk of experiencing reduced intraoperative cerebral blood flow velocity during and after CPB, increased intraoperative GME transmission, longer intubation times, and longer ICU/hospital LOS compared with patients undergoing operations with low mortality risk. Although this study failed to show any correlation between GME counts and neurological injury, these findings still emphasize the importance of utilizing dual intraoperative neuromonitoring techniques to respond in real time to adverse neuromonitoring feedback. Because low-risk patients (STAT Mortality Categories 1 and 2 and acyanotic CHD) are still at risk for neurological injury, it is essential to rapidly address any change in cerebral hemodynamics. Furthermore, the future development of novel cerebral protection strategies and more sophisticated TCD devices is crucial to increase intraoperative cerebral blood flow velocity and reduce GME delivery. Currently, it must be noted that only a few institutions are able to routinely use multimodality neuromonitoring intraoperatively. Therefore, more data from other centers are necessary to correlate with the results of the present study, assess the utility of intraoperative neuromonitoring, and further improve clinical outcomes in congenital cardiac surgery.
Supplemental Material
sj-docx-1-pch-10.1177_21501351251322112 - Supplemental material for Cerebral Hemodynamic Monitoring via Transcranial Doppler Ultrasound and Near-Infrared Spectroscopy for Risk-Stratified Pediatric Cardiac Surgery Patients
Supplemental material, sj-docx-1-pch-10.1177_21501351251322112 for Cerebral Hemodynamic Monitoring via Transcranial Doppler Ultrasound and Near-Infrared Spectroscopy for Risk-Stratified Pediatric Cardiac Surgery Patients by Krishna Patel, Marc J. Lussier, Yongwook Dan, Natalie Gurevich, Allen R. Kunselman, Tracie K. Lin, Jason R. Imundo, John L. Myers and Akif Ündar in World Journal for Pediatric and Congenital Heart Surgery
Footnotes
Acknowledgments
The authors acknowledge and thank the following individuals: Lilly Su, MD, Ryan M. Holcomb, DO, Estelle A. Green, MD, John Philip Le, BS, Sisi Tang, BS, Mahpara Hasan, BS, Annette Appiah, BS, Joseph B. Clark, MD, neuromonitoring technicians, perfusionists, and clinical research nurses at Penn State Health Children's Hospital for their contributions.
Declaration of Conflicting Interests
The author(s) declared no potential conflicts of interest with respect to the research, authorship, and/or publication of this article.
Funding
The author(s) disclosed receipt of the following financial support for the research, authorship, and/or publication of this article: This project was supported by several departmental and institutional seed funds, including Children's Miracle Network Funds and Telethon Allocation Funds.
Supplemental Material
Supplemental material for this article is available online.
Abbreviations
References
Supplementary Material
Please find the following supplemental material available below.
For Open Access articles published under a Creative Commons License, all supplemental material carries the same license as the article it is associated with.
For non-Open Access articles published, all supplemental material carries a non-exclusive license, and permission requests for re-use of supplemental material or any part of supplemental material shall be sent directly to the copyright owner as specified in the copyright notice associated with the article.