
Abstract
Keywords
Introduction
Compared with adults, children have proportionally higher asthma prevalence and emergency department (ED) utilization for asthma exacerbations, 1 making asthma an important chronic pediatric condition. Acute asthma exacerbations consistently rank as one of the most common reasons for pediatric ED visits. 2 Yet despite initiatives to reduce the prevalence of childhood asthma, ED visits for pediatric asthma increased between 12% and 18% in California from 2001 to 2012.3,4
Decreasing the burden of asthma calls for a comprehensive community health approach. Asthma is a complex disease affected by genetics, environmental and social factors, thus the strategies aimed at decreasing its burden must be multifaceted. Community coalitions that include local primary care centers and school health programs have been shown to reduce ED asthma visits.5-11 Primary care tactics that involve case management and in-home environmental remediation5,6,8 as well as, clinical asthma plans at school-based health centers can reduce asthma morbidity and decrease both ED visits and admissions.12-15 While these strategies can affect pediatric asthma health, there is little guidance on selecting the best location to implement these efforts.
Geographical information systems (GIS) technology can aid in the selection and coordination of potential community partners by examining patterns in ED utilization and determine locations with significant health disparities. While there are studies that employ GIS to depict child health inequities or clinical and community health resources, there is a paucity of literature that employs GIS technology to leverage all these elements together.16-19 This report proposes a model to be used by clinicians and child health equity advocates to strategize high-impact community health interventions. It is novel in its overall goal to demonstrate how GIS tools can integrate health care data and public databases to identify community partners to form health coalitions. The aims of this investigation were to identify the clusters of ED utilization for pediatric asthma, evaluate sociodemographic features of the population within the clusters, and identify potential primary care and school partners to create prevention programs.
Methods
Data Sources
The California Health and Human Services Open Data Portal provides data on patient visits to 450 nonmilitary EDs in California. We obtained 2012 ZIP code–level summarized counts and rates for patients younger than 18 years discharged with International Classification of Disease 9th revision code 493 for asthma conditions. Primary care office locations and the areas designated by the federal government as primary care shortages in 2010 were obtained through the Office of Statewide Health Planning and Development (OSHPD). School locations were provided through ArcGIS as a layer sourced from the California Spatial Data Clearinghouse. For simplicity of demonstration, the top 3 clusters were used for the model. ZIP codes identified within these clusters were matched to sociodemographic information obtained from the 2008-2012 American Community Survey summary file.
Spatial Data Preparation
We mapped age-adjusted ED visit rates by patient ZIP code using ArcGIS 10.2.1 and performed a spatial scan statistic in Satscan to assess the geographic distribution of ED utilization. The primary goal of the scan statistic is to identify the collection of rates least consistent with the null hypothesis, which states the ED visits for asthma are randomly distributed in geographic space and the expected rates are proportional to the population at risk. The scan statistic uses a circular window of varying sizes as it moves methodically across all locations in the study area calculating the likelihood ratio to provide a measure of how unlikely it would be to encounter the observed excess of cases. A cluster with P < .05 was considered to be statistically significant. The statistic performed 999 simulations and reported nonoverlapping clusters. This model only considered Gini clusters. We then characterized the demographic, social, and economic attributes of the cluster population. Last, we identified candidate partners by identifying schools located within 0.5- and 1-mile radii of the primary care centers.
Results
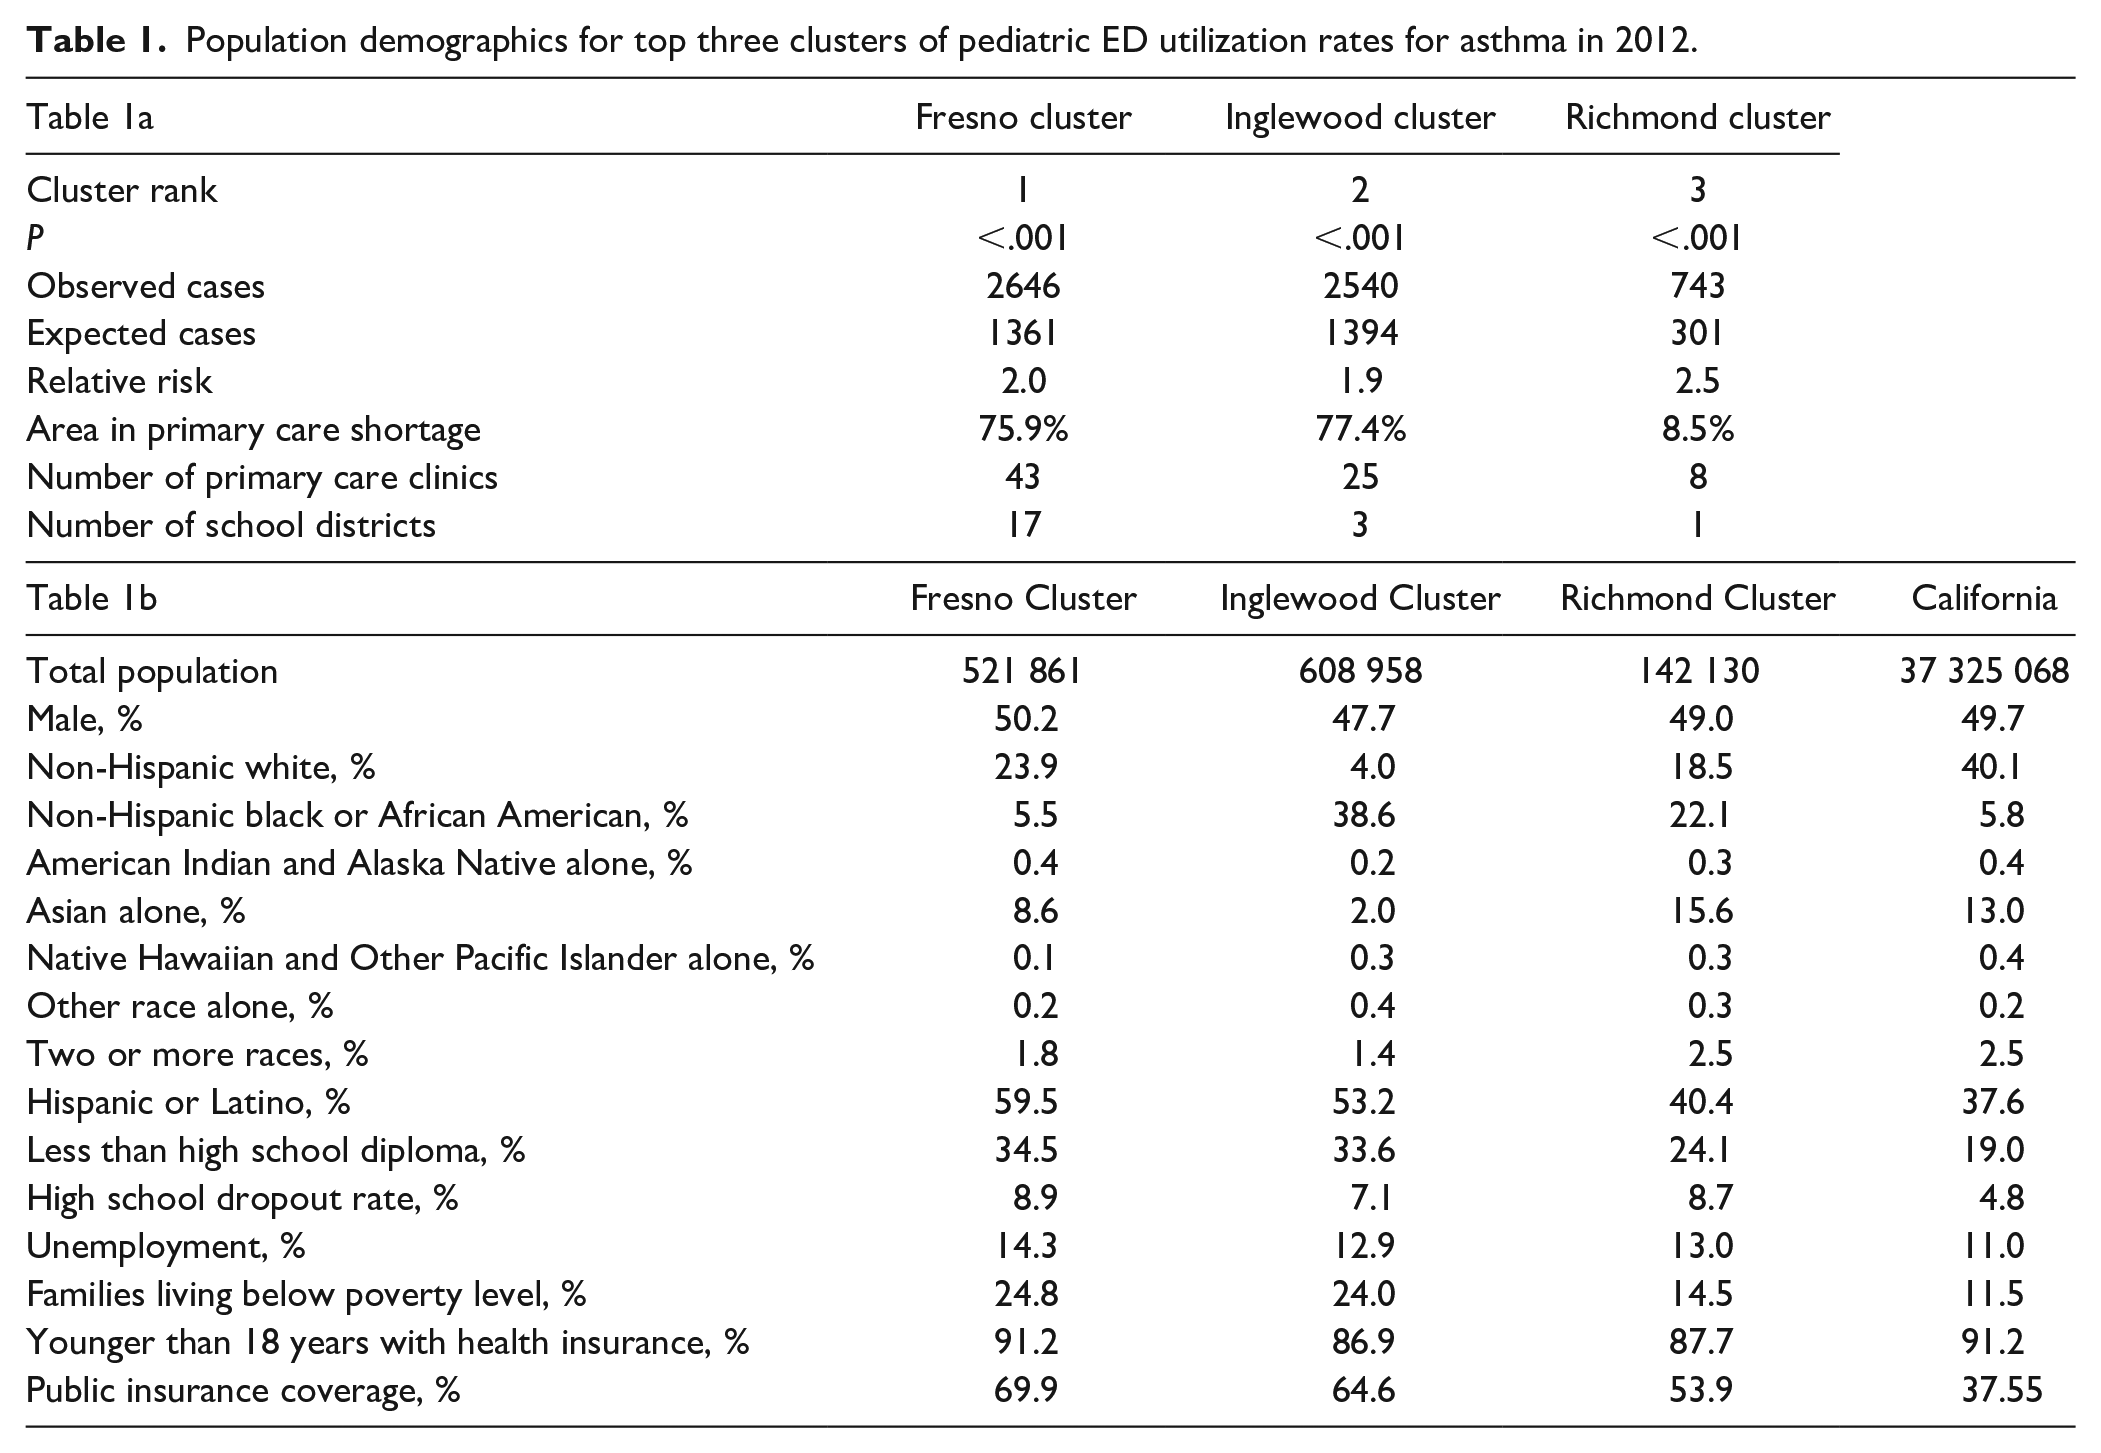
There were 181 720 ED visits for asthma for all age groups in 2012 with 70 127 visits for children younger than 18 years. The median ED visit rate across 971 reporting ZIP codes was 67 per 10 000 children younger than 18 years (95% CI 73.2-78.8 per 10 000). Spatial analysis revealed the top geographic clusters for ED utilization rates were located in Fresno, Inglewood, and Richmond City (Figure 1). The likelihood ratios (LLRs) were 486.3, 387.8, and 230.6, respectively; all 3 clusters had P < .001 (Table 1a). Populations within these clusters demonstrated high rates of unemployment and families living in poverty. In Fresno and Inglewood clusters, the population was largely Hispanic, 59.5% and 53.2%, respectively, while 22.1% of the population in Richmond City cluster were African American. Children across all clusters had high rates of insurance coverage with most children participating in public insurance (Table 1b). More than 75% of the geographic areas within Fresno and Inglewood clusters were identified as a primary care shortage area (Supplemental Figure). Schools and households located within a half-mile and a one-mile radius of a primary care clinic are depicted for each of the 3 clusters in Figure 2a-c.
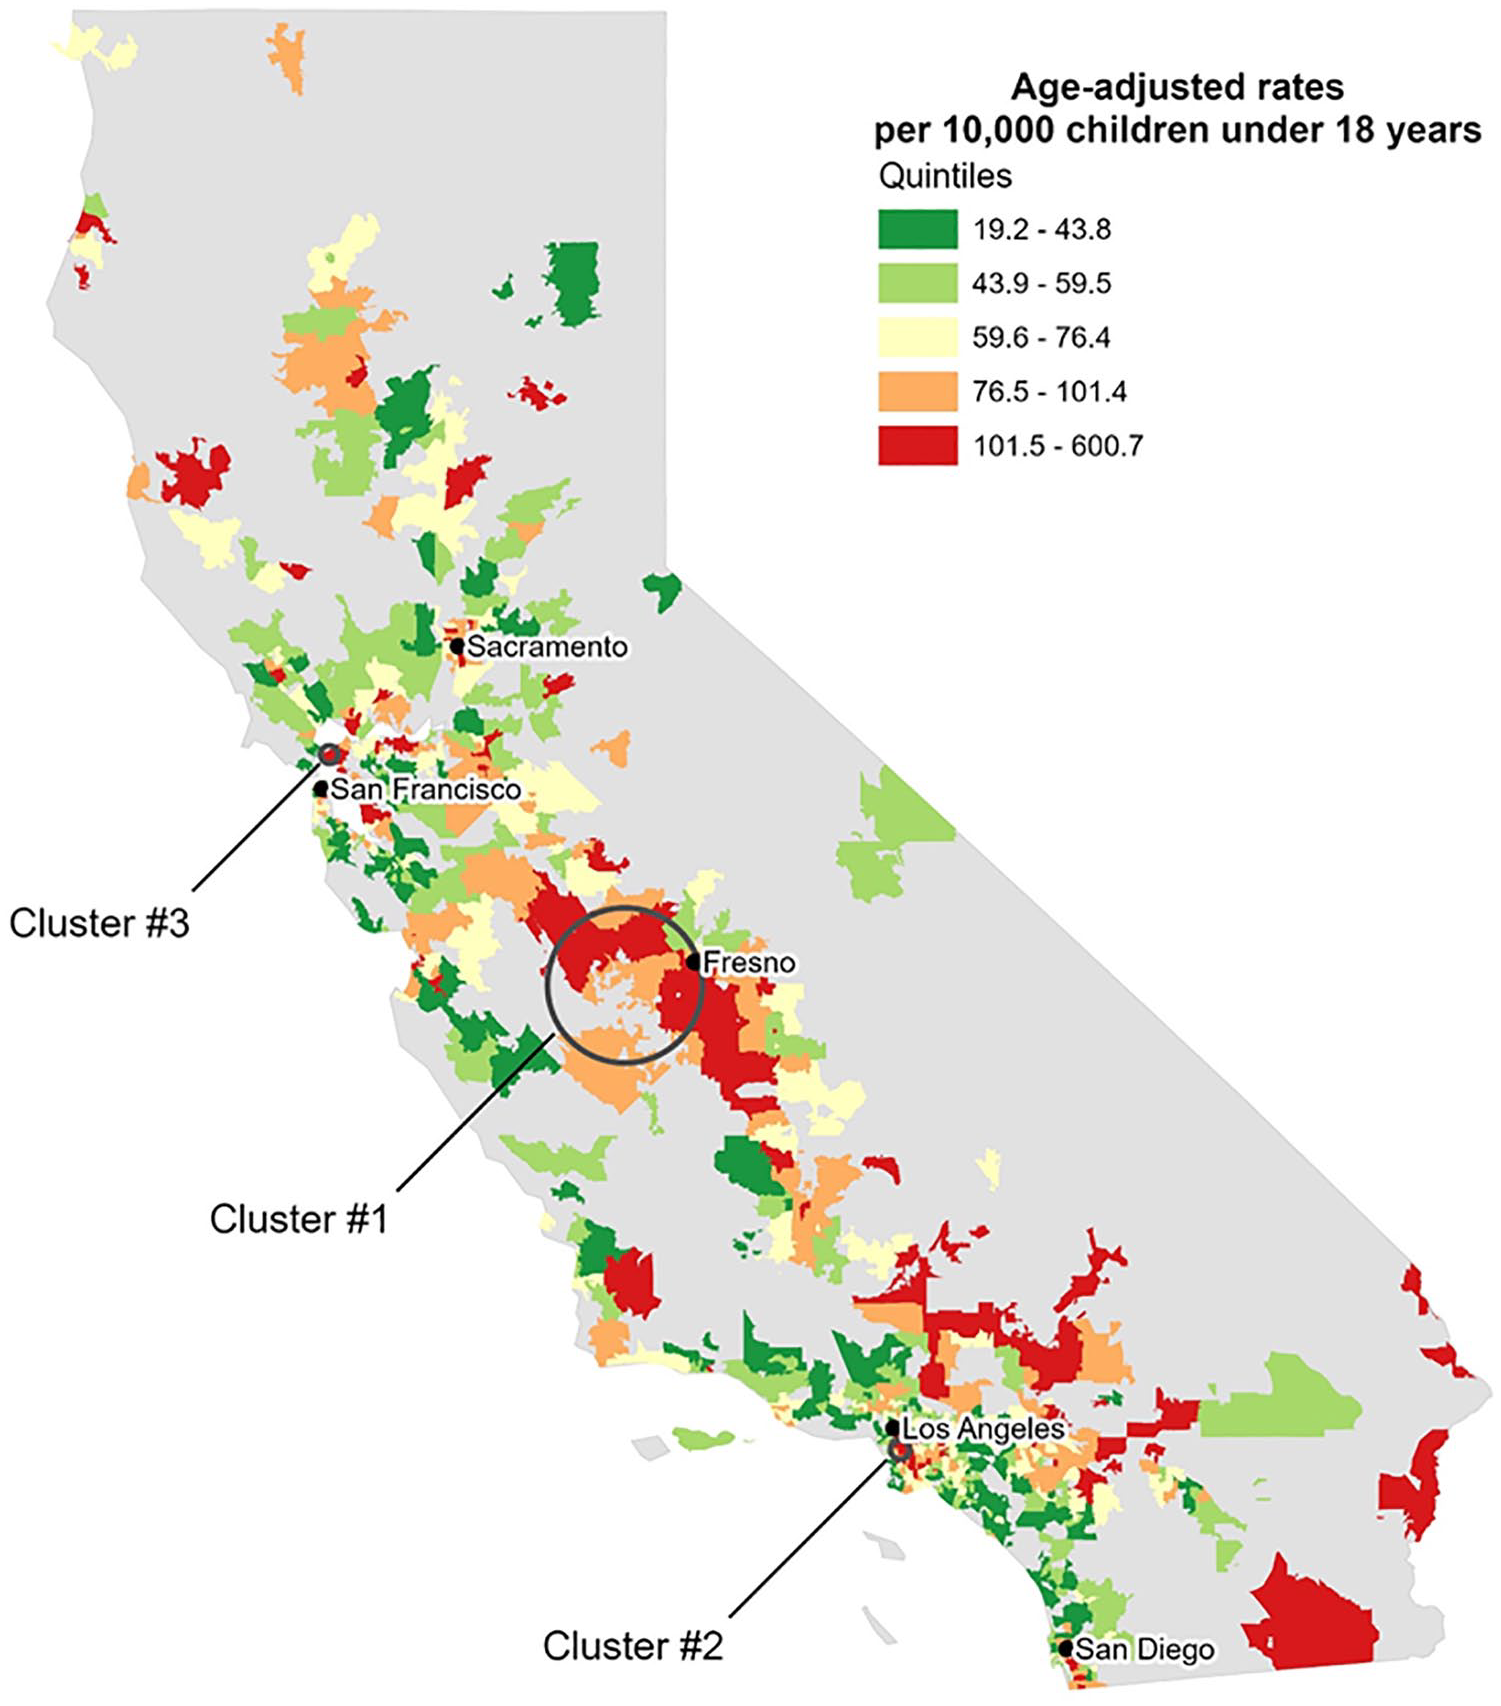
California asthma emergency department (ED) visits by ZIP code, 2012. Three clusters for pediatric ED utilization rates for asthma were located in Fresno, south of Los Angeles, and north of San Francisco.
Population demographics for top three clusters of pediatric ED utilization rates for asthma in 2012.

(a) Fresno cluster. (b) Inglewood cluster. (c) Richmond cluster.
Discussion
The purpose of this article was to increase the literature base in GIS applications in the planning of community coalitions. GIS has been essential to industries in business, marketing, and environmental assessments, but its adoption into health care has been relatively slow in comparison. 20 Its application has typically been limited to display health utilization or disease data and illustrating the locations of service provision.18,21,22 In the medical literature, it is seldom used to display these elements together on the same map. 23 Our project uniquely combines pediatric health utilization data and primary care centers with the location of potential coalition partners all on one map. This technique thus becomes an important tool for clinicians and local organizations who desire form community-based partnerships to address health disparities.24,25
GIS has provided greater understanding of child health issues ranging from gun violence, pediatric poisoning, to vaccination rates.19,26-28 One of the most impactful application of GIS in child health has been in its role in blood lead level screening. Researchers compiled surveillance data and information on the built environment to assess children’s risk for lead poisoning. These efforts have resulted in geographically targeted, specific intervention measures to reduce children’s exposure to lead.17,29,30
Understanding where health disparities exist is an important first steps in developing strong community coalitions. While traditional statistical methods seek the central tendency of the data without regard to geography, spatial analysis is different as it takes location into account to identify the outliers of data. This aspect makes it a powerful tool for improving health equity. Moreover, this method can also provide measures by which coalitions might gauge their impact. In this case, data on ED asthma visits could be compared before and after implementing interventions.
Limitations
This investigation has important limitations. The 2012 health care utilization data used here may not be useful in forming present-day coalitions; however, the methods demonstrated here could be applied to do so. Additionally, California’s OSHPD provides public information regarding California’s health care infrastructure. This robust database may not be available in other states. This model might advocate for similar investments in such data infrastructure to improve overall health equity. Our model does not incorporate qualitative methods to ensure successful community collaboratives.22,31,32 Qualitative methods are recommended to further develop the understanding of health care access and provision 20 and to validate the geospatial model. 33
In terms of cluster identification, there exist several spatial analysis techniques with no single technique identified as the gold standard. While the spatial scan technique is widely accepted, one might choose to apply an additional spatial technique to confirm cluster identification. Moreover, the spatial scan technique presumes clusters are circular; if there are gaps within the cluster, this technique will not demonstrate it. Despite these limitations, the spatial scan statistic can be applied to any disease process to generate information vital to improving health in local communities. Because the model only analyzed data from a single calendar year, to ensure these clusters persist over time, further iterations would include ED visit data over several years.
This model was limited to primary care and schools as community partners. Other potential candidates could include and are not limited to local youth athletic clubs, faith-based organizations and even local businesses.
Conclusion
This study demonstrates a model to help clinicians understand how GIS can aid in the selection and creation of coalition building. This is a potentially powerful tool in the addressing child health disparities.
Supplemental Material
SupplementalFigures_2020 – Supplemental material for Aligning Partners in Pediatric Health: Using Geographical Information Systems to Plan Community Coalitions
Supplemental material, SupplementalFigures_2020 for Aligning Partners in Pediatric Health: Using Geographical Information Systems to Plan Community Coalitions by Margaret B. Nguyen in Journal of Primary Care & Community Health
Footnotes
Declaration of Conflicting Interests
The author declared no potential conflicts of interest with respect to the research, authorship, and/or publication of this article.
Funding
The author received no financial support for the research, authorship, and/or publication of this article.
Supplemental Material
Supplemental material for this article is available online.
References
Supplementary Material
Please find the following supplemental material available below.
For Open Access articles published under a Creative Commons License, all supplemental material carries the same license as the article it is associated with.
For non-Open Access articles published, all supplemental material carries a non-exclusive license, and permission requests for re-use of supplemental material or any part of supplemental material shall be sent directly to the copyright owner as specified in the copyright notice associated with the article.