
Abstract
Introduction
Robust primary care systems are associated with lower overall mortality, lower health care costs, better health care quality, and less health inequity.1-5 Primary care occurs in the context of a health care ecosystem and requires care coordination across the full spectrum of health care service delivery and the socio-ecologic infrastructure of communities and populations. Understanding the impact of care coordination on the health of people and populations can inform best practices for design of physician networks and health care systems.
One aspect of this complex system includes networks of primary care and specialist physicians caring for patients. Coordinated care between primary care and specialist clinicians supports good health outcomes for patients with chronic illnesses.6-9 Additionally, specialty referral networks characterized by fewer, more deliberate connections with more frequent contacts have lower costs and better quality. 10 However, few studies have explored network characteristics of health care providers 11 and even fewer have focused on networks of primary and specialty providers in outpatient clinical settings, where a majority of health care occurs. 12 One study of Medicare provider networks found inconsistent relationships between the physician network characteristics and quality of care and costs; in this study, however, they did not address primary/specialty care networks. 13
The purpose of this study was to measure the impact of primary and specialty physician network infrastructure on health outcomes for patients with ambulatory care sensitive chronic diseases through a social network analysis. Specifically, we sought a mechanism to measure the impact of care coordination on patients with chronic illnesses in primary care. We focused on the network of primary care and specialty physicians caring for adult Medicaid beneficiaries with chronic ambulatory care sensitive conditions (ACSCs) 14 in Texas in 2009. Our analysis is the first to quantify care coordination networks of primary care physicians (PCPs) and specialist physicians via the network characteristics of their patient sharing patterns and assess these network measures in predicting health care utilization outcomes among PCP panels of Medicaid beneficiaries with ACSCs. This work can inform structuring of primary care and specialty physician networks, and resulting network interactions, to facilitate improvement in health outcomes in state Medicaid programs and the broader health care system.
Methods
Overview and Data Source
We used 2009 Texas Medicaid Analytic eXtract (MAX) files to conduct a cross-sectional network analysis that measured the impact of physician network characteristics on emergency department (ED) utilization. Networks are characterized by nodes and connections between them. Social Network Analysis (SNA) is a methodological tool that quantifies and describes the configuration of these nodes and the pattern of connections between them. MAX files include information on Medicaid eligibility, health care utilization, and payments in a common data format. This study used outpatient files, inpatient files, and personal summary files linked by a common identifier. We used the National Physician Identifier (NPI) linked with the National Plan and Provider Enumeration System (NPPES) database to identify physicians as primary care or specialty providers. (See Appendix A for a listing of provider taxonomies.)
Texas was chosen for its relatively large physician network, high rate of continuity of care for Medicaid beneficiaries with ACSC based and a relatively random patient assignment across PCPs on exploratory analysis of our 29 state MAX file data. Specifically, starting from February 2007, Texas Medicaid introduced a county-level mandate that required its disabled Medicaid beneficiaries to switch from public to private plans, which created a quasi-random assignment of patients in later years. 15 Each eligible patient was assigned to a unique PCP. A patient-sharing network was constructed where PCPs and specialists were connected if they had cared for common patients. Finally, we estimated the association between ED utilization of primary care patients and standard network measures at the PCP level. This analysis was conducted through a data use agreement with Centers for Medicare and Medicaid Services and received institutional review board approval.
Identification of Eligible Patients
We applied the following inclusion criteria for patients: (1) age 18 to 64 years; (2) nondual eligible; (3) at least 3 chronic ACSC related visits to a PCP in a 12-month period (ACSC listed as first or second diagnosis code for claim); (4) at least 2 visits with the most seen PCP for ACSC; (5) at least 50% of total PCP visits for ACSC were with the most seen PCP; and (6) continuously enrolled in Medicaid during 2009. ACSC were identified using International Classification of Diseases, Ninth Revision, Clinical Modification codes and are available in Appendix B. A patient was considered to have a chronic ACSC if they had at least 2 outpatient claims or 1 inpatient claim for the condition in a 12-month period. The selection of ACSC conditions were based on a list of conditions defined by the National Academies of Medicine. 14 We included chronic conditions that could be managed via chronic disease management in primary care or specialty outpatient setting.
Assigning Eligible Patients to PCPs
To enable fair performance evaluation of PCPs for care coordination, each eligible patient was assigned to a PCP if the patient had at least 2 ACSC related visits to the PCP and the PCP accounted for at least half of the patient’s total PCP visits in 2009. We restricted the analysis to chronic ACSCs because better primary care leads to lower adverse outcomes for these conditions.16,17 We excluded patients without continuity for chronic disease management, as PCPs would have minimal opportunities to coordinate care with specialists for these patients. As such, we only included patients who met our criteria for having continuity of care for chronic disease management and thus had adequate primary care access in the study sample.
Construction of the Physician Network
We constructed a bipartite graph between PCPs and specialists, where the connections were defined by common patients, and weighted by the number of these common patients. 18 If a patient visited a specialist, the PCP of this patient would be connected to the specialist in the network. The graph identified was undirected.
Measures of Interest
Patient and physician network information were aggregated to the PCP level. The final sample contained observations from the set
Statistical Analysis
Descriptive statistics were generated and a 2-sample t-test compared the characteristics of PCPs who provided solo care to their ACSC patient panels to those who coordinated care for ACSC panels with specialists. A negative binomial regression model was constructed to show the association between patient-sharing network characteristics and the number of ED visits per patient in a PCP’s panel of ACSC. We estimated the following model:

where
All P values were 2-sided and a P value <.05 was considered statistically significant. SAS version 9.4 (SAS Institute, Inc) was used to perform all analyses except for the community detection algorithm, which was conducted using the R programming language.
Results
There were 5687 PCPs providing continuity of care for ACSC to 42 493 adult Texas Medicaid beneficiaries with chronic ACSCs. These PCP coordinated care for these patients with 11 660 specialists. Figure 1 outlines the detailed inclusion criteria and final sample counts. The final sample accounts for 31% of the total Texas Medicaid patients in 2009. In all, 32% of the Texas Medicaid patients with ACSCs met our criteria for interpersonal continuity of care for chronic disease management with a PCP.

Patient inclusion criteria and cascade used to identify continuity primary care physician (PCP) panels of adult Medicaid beneficiaries in Texas in 2009 with chronic ambulatory care sensitive conditions (ACSCs).
Table 1 presents descriptive statistics and definitions of network characteristics, for ease of interpretation. Separate statistics are calculated for patients with and without visits to specialists in 2009 because the dependent variable responded differently to network characteristics in the subgroups characterized by those PCPs who did not share any ACSC patients with specialists and those PCPs who coordinated care for ACSC patients with specialists.
Description of the Social Network Characteristics of Primary Care Physicians (PCPs) and their Panels of Adult Medicaid Beneficiaries with Chronic Ambulatory Care Sensitive Conditions (ACSCs) in Texas, 2009 (n = 5687 PCPs).
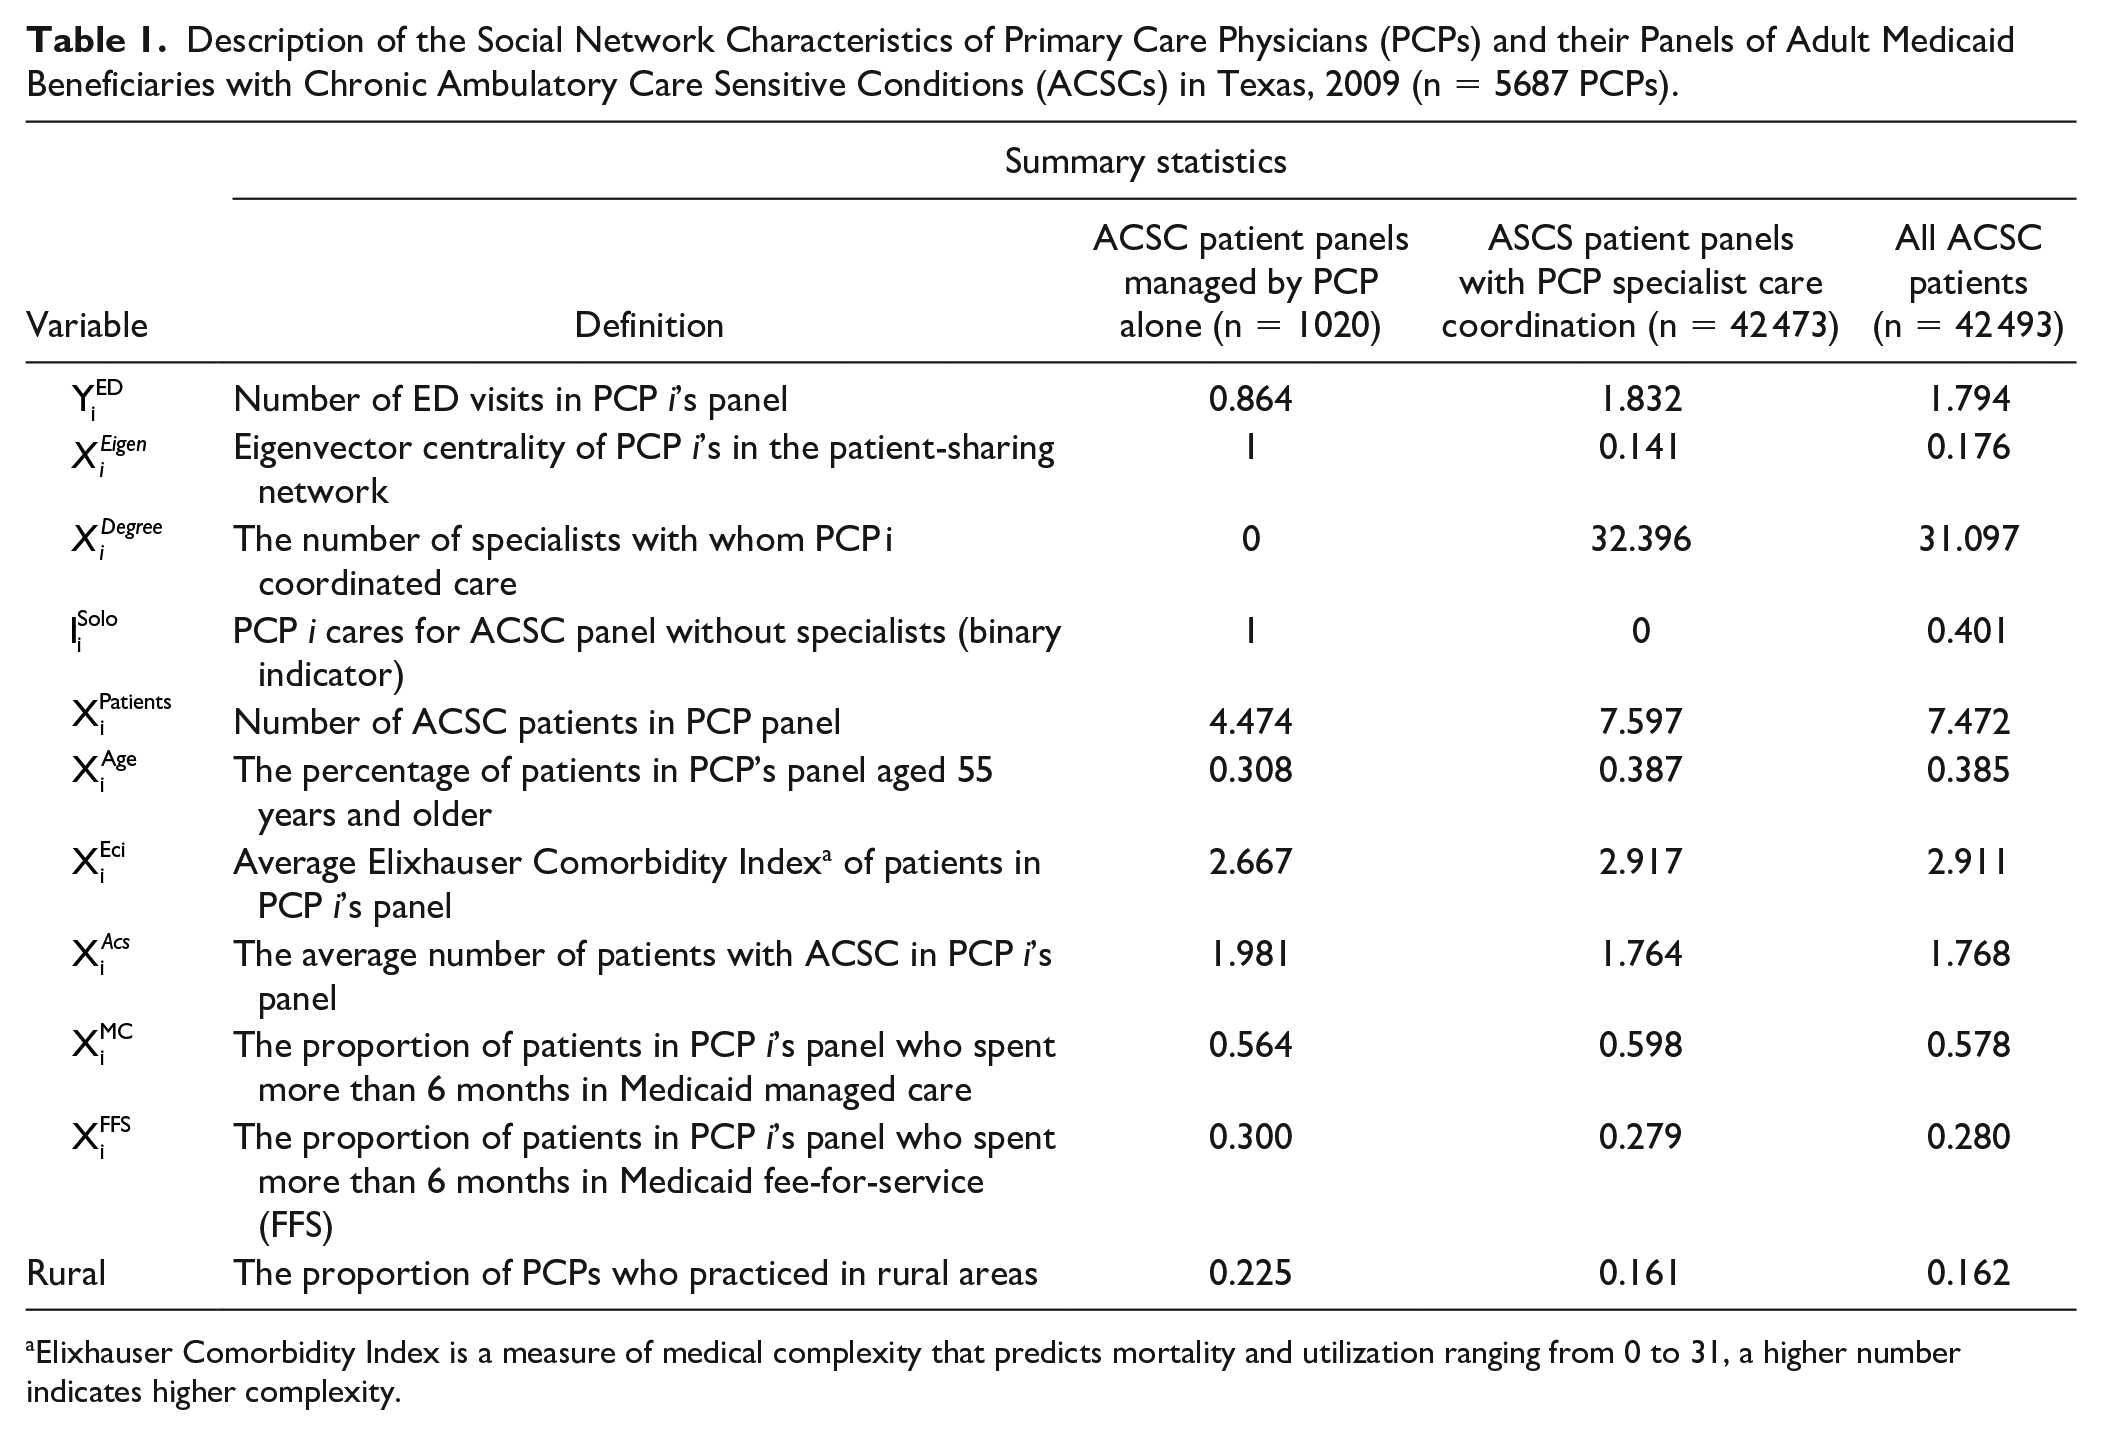
Elixhauser Comorbidity Index is a measure of medical complexity that predicts mortality and utilization ranging from 0 to 31, a higher number indicates higher complexity.
Table 2 shows the gender ratio and practice locations of PCPs and specialists. The PCP group had more females and more practices in rural and health professional shortage areas (HPSAs) than the specialist group. Figure 2 draws 2 connected components of the constructed patient sharing networks. Panel B illustrates the community detection algorithm. The algorithm partitions this component into 5 independent components (labeled by different colors), where edges between different components are essentially deleted. Panel A shows the largest component identified by the community detection algorithm, where red and blue vertex represent PCPs and specialists, respectively.
Characteristics of Primary Care Physicians (PCPs) and Specialists caring for Adult Medicaid Beneficiaries With Chronic Ambulatory Care Sensitive Conditions in Texas, 2009.

Abbreviation: HPSA, health professional shortage area.

Connected components of the patient-sharing networks of primary and specialty physicians caring for adult Medicaid beneficiaries with ambulatory care sensitive conditions with primary care continuity in Texas, 2009. Panel A: Representation of the entire network of primary care (red dots) and specialist physicians (blue dots) connected by shared patients (gray lines). Panel B: Illustration of the community detection algorithm. The algorithm partitions this component into 5 independent components (labeled by different colors).
Estimation results from the negative binomial regression model are presented in Table 3. PCPs who were the sole health care providers of their patients tend to have lower patient panel ED rates. Specifically, if a PCP provided comprehensive care for ACSC patients, this PCP would have 86% lower patient panel ED rates than a similar PCP who coordinated care with specialists (we calculated the incidence of ED visit rate ratio equal to 1 − exp[−1.98]). Among PCPs with patients who saw specialists, those who had a higher number of specialist collaborators and those who had a high degree of eigenvector centrality (“high quality” hubs connected with “high quality” specialist collaborators) had lower patient panel ED rates. Eigenvector centrality is a measure of the level of influence of a node in a social network, it is based on not only the number of connections to other nodes but also how influential those nodes are in the network. In this case, we can think of a PCP with high eigenvector centrality as being a hub connected to influential specialists, or those that also share patients with other PCPs in the network.
24
There was an interaction effect between centrality and the number of specialists. PCPs with higher eigen centrality did not necessarily have lower ED rates in their patient panels. If a PCP collaborated with a limited number of specialists (
Results of Multivariable Regression Model Showing the Association Between the Characteristics of Care Coordination Networks of Primary Care and Specialist Physicians on the Rate of Emergency Department Visits per Patient in Primary Care Physician Chronic Ambulatory Care Sensitive Condition Patient Panels in Texas Medicaid, 2009.
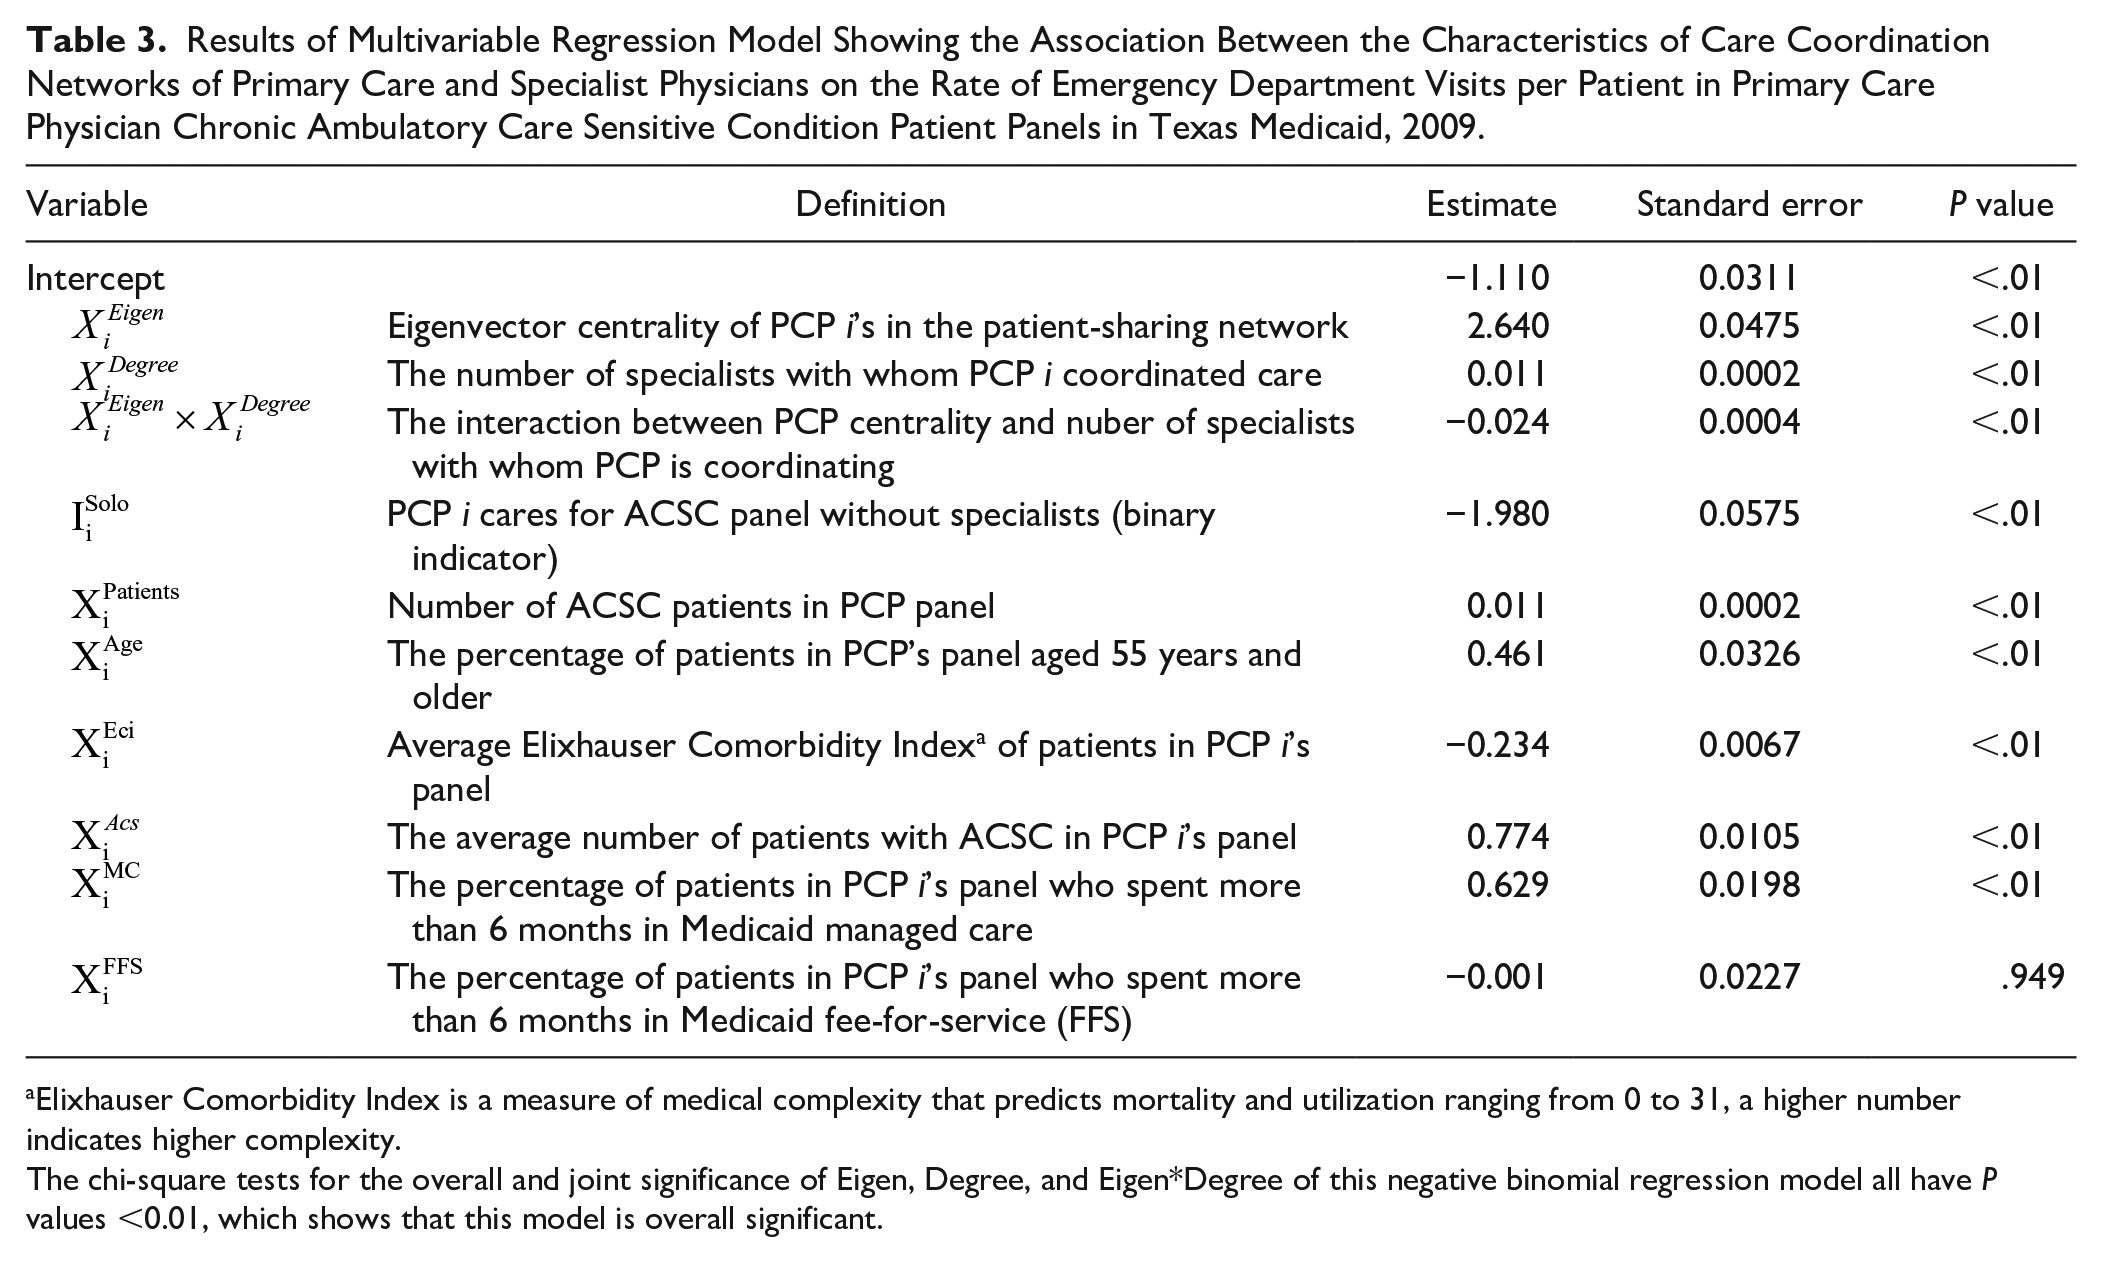
Elixhauser Comorbidity Index is a measure of medical complexity that predicts mortality and utilization ranging from 0 to 31, a higher number indicates higher complexity.
The chi-square tests for the overall and joint significance of Eigen, Degree, and Eigen*Degree of this negative binomial regression model all have P values <0.01, which shows that this model is overall significant.
Discussion
We found Texas PCPs providing solo care for Medicaid patients with ACSCs without specialist collaboration had the lowest rates of ED utilization. PCPs with adequate specialist networks available and a high degree of centrality, which can be thought of as robust opportunity for care coordination with specialists who were influential in the network, in their provider networks also had lower ED utilization rates. The rightness of fit between primary care centrality or the influence of the PCP and their collaborating specialist colleagues and the robustness of the specialist networks available was an important driver of ED utilization.
One unique aspect of this analysis was our assignment of patients with chronic conditions to a PCP if they had continuity for their chronic disease management and met a minimum number of visits per year for clinically adequate chronic disease management. This step allowed us to identify networks of physicians who were caring for distinct panels of patients and ensured that the PCP was reasonably able to coordinate care and communicate formally or informally about the patients identified in their panel.
PCPs who were the sole practitioners caring for patients with ACSCs had significantly lower ED utilization among their ACSC patient panels. This implies these physicians were providing comprehensive care to these patients, which has been associated with improved health outcomes and lower health care costs. 25 In contrast, the narrow specialty networks available to Medicaid beneficiaries might also influence this result. Solo PCPs were more likely to be in rural or medically underserved areas; thus, limiting the PCP’s connections to specialists and the availability or proximity of emergency care to rural patients.
PCPs who had a high degree of care coordination for ACSC patients and a robust specialist network available had lower ED utilization for ACSCs in their panels. However, PCPs coordinating care for ACSC patients with many specialists did not necessarily reduce ED utilization, especially if they had a low degree of centrality, or were less influential themselves in the network or connected to less influential specialists. Formal information sharing might occur through shared electronic health records, shared patient notes, a phone call, or asynchronous messaging between providers.26,27 Informal information sharing might include information shared by patients between providers or informal interactions that lead to discussions about shared patients or types of patients. 28 Similarly, PCPs with a high centrality, or those who had more robust opportunities to share information with influential specialists in the network, did not necessarily have lower ED utilization in their ACSC patient panels. This was especially true when PCPs had connections to a limited number of specialists. This scenario may have specific implications for physician networks caring for Medicaid beneficiaries, as specialty networks available to PCPs and beneficiaries are narrow in Medicaid plans.29-31 These results show the importance of balancing the rightness-of-fit between comprehensiveness of care, robust care coordination (high centrality), and an adequate supply specialists available to Medicaid beneficiaries with chronic conditions requiring specialist consultation.
The finding that care coordination and the number of connected specialists work together to influence ED visits for patients with chronic ACSCs provides greater nuance to a recent study that noted 28% of ED visits were attributable to specialists. 32 Additionally, our results would suggest prior findings associating higher rates of physician office visits with higher rates of multiple ED visits are incomplete without a consideration of physician-specialist networks, along with patient characteristics. 33 This study shows network analysis can serve as a valuable tool to measure the impact of core primary care functions like comprehensiveness of care and care coordination.
Future endeavors to improve chronic disease management should address the intersection of a PCP’s centrality in the provider network and specialist connectedness together. These results are especially important in Medicaid networks, which serve a disproportionately poor, minority, and medically underserved population with high rates of chronic illness and well documented health inequities. The impact of physician participation in Medicaid networks has been linked to racial and socioeconomic health disparities in this population. 34 These results could inform structuring of PCP and specialist care networks to optimize health outcomes among Medicaid enrollees with chronic conditions and could potentially reduce health inequities.
This study has several limitations. First and foremost, this is a cross-sectional study on the association between PCP network characteristics and patient health outcomes (ED rates). The results of this study should not be interpreted causally, and thus this study does not serve as a prescriptive evaluation of the existing PCP networks. Nonetheless, we believe that this empirical fact is worth documenting for future research to study the underlying mechanism of PCP networks. Second, this study is restricted to Texas Medicaid patients with high primary care continuity who have a diagnosis of a chronic ACSC and may not be representative of other states or physician networks in other health care coverage plans. Beneficiaries in the sample who did not meet criteria for primary care continuity for chronic disease management of their conditions were excluded from this study. The availability of provider NPI number in only a single year of our data (2009) was a restrictive factor. Our measure of comprehensiveness does not capture involvement in care of PCPs or specialists outside the management of chronic ACSCs. This study is subject to the known limitations of analysis using claims data, which is reliant on the coding and claims submitted by providers that may be inaccurate or incomplete. Finally, physicians may have additional connections outside those included.
A natural extension of this study is to understand the mechanism behind patient-sharing network formations. This question is particularly relevant to the design and evaluation of new payment models such as accountable care organizations, which are reimbursed under pay-for-performance. Understanding how patient sharing networks differ among racial/ethnic sub-populations within Medicaid is important. Future work is needed to determine the applicability of our findings to other states and other types of health care coverage. Additionally, social network analysis only measures potential opportunities for information sharing and care coordination between PCPs and specialists. Further work is needed to understand how dyads of PCPs and specialists interact around chronic disease management for patients with chronic ACSC.
Conclusions
In this first of its kind social network analysis of primary care and specialty physician networks caring for Medicaid beneficiaries with ACSC, we found it is necessary to balance the role of PCP centrality in a network with the availability of specialists in the network to reduce ED utilization among patients with chronic ACSC. The right fit between primary care comprehensiveness, potential opportunities for care coordination, and adequate capacity of specialty networks is needed to drive outcomes. We also found that PCPs providing comprehensive care to patients with ACSC without specialist consultation have lower ED utilization. These findings can guide the construction of future primary and specialty provider networks. Additionally, this approach could be applied to evaluate the impact of social network effects of other groups of clinicians caring for a specific patient population. Finally, we want to emphasize that the main purpose of this study is not to evaluate the impact of existing PCP networks on ED utilization rates in PCP panels. Instead, the main contribution of this study is to show that the patient sharing patterns between PCPs and specialist clinicians can be quantified using social network analysis, and we demonstrate that this quantification can capture the impact of coordinated care on chronic disease management.
Footnotes
Appendix
International Classification of Diseases, Ninth Revision, Clinical Modification (ICD-9-CM) codes for Chronic Ambulatory Care Sensitive Conditions.

| Condition | ICD-9-CM codes |
|---|---|
|
|
345, 780.3 |
|
|
491, 492, 494, 496 |
|
|
493 |
|
|
428, 402.01, 402.11, 402.91, 518.4 |
|
|
401.0, 401.9, 402.00, 402.10, 402.90 |
|
|
411.1, 411.8, 413 |
|
|
250.1, 250.2, 250.3, 250.8, 250.9, 250.0 |
|
|
251.2 |
Acknowledgements
We would like to acknowledge Mr Junjun Xu and Dr George Rust for their intellectual contributions to the formative stages of work.
Declaration of Conflicting Interests
The author(s) declared no potential conflicts of interest with respect to the research, authorship, and/or publication of this article.
Funding
The author(s) disclosed receipt of the following financial support for the research, authorship, and/or publication of this article: This work was partially supported by the National Institutes of Health, National Institute on Minority Health and Health Disparities (Grant No. P20 1P20MD006881-02), and the Research Centers in Minority Institutions (Grant No. U54 8U54MD007588).