
Abstract
Introduction:
Carcinoembryonic antigen (CEA) is a blood biomarker with significance in cancer monitoring and prognosis prediction. Despite not being a primary diagnostic tumor marker, it is frequently measured in clinical practice and health check-ups in primary care services, often prompting extensive investigations due to its non-specific nature. This study investigated the integration of CEA levels with a clinical risk scoring system to enhance cancer prediction in individuals with elevated CEA.
Methods:
We retrospectively reviewed records, focusing on people who participated in general health check-up programs. Participants with elevated CEA levels (≥5 ng/mL) and no previous cancer diagnosis were selected. A multivariable logistic regression model was employed to establish the risk scoring system, which was then evaluated using Receiver Operating Characteristic (ROC) analysis.
Results:
Among 17 859 participants, 310 had elevated CEA levels, with 7.40% subsequently diagnosed with cancer, primarily colorectal cancer. Combining the clinical risk scoring system with CEA levels significantly improved cancer prediction, with an Area under the ROC curve of 0.918, compared to 0.825 for CEA levels alone.
Conclusion:
CEA, alongside clinical risk prediction, shows promise in predicting cancer among individuals with high CEA levels. This integrated approach can optimize early cancer detection strategies and improve patient outcomes.
Background
Routine health check-ups, a key component of the primary care mission to promote health and prevent disease, frequently incorporate cancer screening strategies, acknowledging the well-established benefits of early detection in improving treatment outcomes, particularly during the pre-symptomatic phase of malignancy. 1 Effective treatment outcomes are notably higher during the asymptomatic stage of cancer, preceding symptom onset. Non-invasive and cost-effective, blood biomarker tests represent a viable option. For clinical utility, biomarker tests necessitate high predictive accuracy, ease of measurement, reproducibility, and acceptance among patients and healthcare providers.2,3
Carcinoembryonic antigen (CEA) is a glycoprotein biomarker with limited expression in healthy adult tissues. While CEA demonstrates value in monitoring treatment response and prognostication, particularly in colorectal cancer, 4 it lacks the requisite sensitivity and specificity for primary cancer diagnosis. Nonetheless, CEA remains a frequently measured analyte in clinical practice and health check-ups. Employing CEA alone (with a threshold of >5 ng/mL) as a cancer screening tool is not recommended due to its limitations. 5 Notably, CEA elevations can occur in various non-cancerous conditions (eg, liver disease and inflammatory bowel disease), potentially leading to false-positive results and prompting unwarranted investigations.4,6-10
Elevated CEA levels in the clinical setting often necessitate extensive diagnostic workups, which may include imaging studies and endoscopies. While reasonable in some cases, this approach can induce significant patient anxiety and tax healthcare resources if initiated without a carefully considered clinical rationale. The development of robust risk prediction tools is essential to optimize decision-making regarding further investigations in individuals presenting with elevated CEA.
Although CEA is widely used in clinical practice, elevated CEA levels are not specific to colorectal cancer and may be influenced by a range of demographic, metabolic, and lifestyle-related factors, many of which are also associated with increased cancer risk through shared pathophysiological pathways involving chronic inflammation, metabolic dysregulation, and carcinogenesis. Integrating these routinely collected clinical variables with biomarker data may therefore enhance the clinical interpretability, predictive performance, and real-world applicability of cancer risk prediction models among individuals with elevated CEA levels. Accordingly, this study aims to investigate the potential of integrating CEA levels with clinical risk factors to enhance cancer prediction among individuals with CEA elevation. We hypothesize that this combined approach will improve predictive accuracy, enabling more targeted interventions. Using a retrospective analysis of health records, we aim to develop a clinical risk scoring model that can be used alongside CEA measurements to more accurately stratify individuals based on their cancer risk.
Methods
Study Design and Setting
We conducted a retrospective study analyzing medical records from individuals enrolled in general health check-up programs at Sriphat Medical Center, Chiang Mai University between January 2016 and March 2021. This study was conducted under review and approval from the Institutional Research Ethics Committee of the Faculty of Medicine, Chiang Mai University (IRB number 8136/2564). All methods were carried out in accordance with relevant institutional guidelines and regulations. Informed consent was waived by the Institutional Research Ethics Committee of the Faculty of Medicine, Chiang Mai University, due to the retrospective nature of the study and the use of anonymous clinical data for analysis.
Participants
Participants who were included in the study were adults aged 18 years and over who had undergone CEA testing as part of their routine health check-up, exhibiting elevated CEA levels (≥5 ng/mL) without a prior cancer diagnosis. We excluded participants with incomplete medical records, those lost to follow-up within a year, and individuals with a history of cancer.
Data Collection
Data extracted from medical records included demographic information (age and sex), CEA levels, current smoking and alcohol drinking status, body mass index (BMI), comorbidities such as diabetes and hypertension, and outcomes of subsequent cancer diagnosis within 1 year of elevated CEA levels. To confirm whether a case is cancerous or benign, we employ a comprehensive diagnostic approach that includes chest X-ray, abdominal radiologic imaging, and endoscopy. In instances where all tests yield negative results, a follow-up period of at least 1 year is mandated to ensure no cancer is detected. CEA levels in blood were quantified using the Beckman Coulter Dxl 800 system (Beckman Coulter, USA).
Clinical Risk Scoring System Development
Clinical variables were selected based on established evidence linking these factors to an increased risk of colorectal cancer, their pathophysiological relevance to CEA elevation and malignancy, and their routine availability in real-life clinical practice, thereby enhancing both clinical plausibility and translational applicability. The variables included age, 11 sex, 12 diabetes, 13 hypertension, 14 smoking and alcohol consumption, 15 and BMI, 16 We utilized a multivariable logistic regression model to discern significant predictors of cancer within our cohort. This model incorporated clinical risk factors alongside CEA levels to evaluate their collective predictive strength for cancer diagnosis. The derived coefficients from this model informed the construction of a clinical risk score, with points assigned to predictors in proportion to their logistic regression coefficients.
Statistical Analysis
The Statistical software for data science STATA 16 (StataCorp, Texas, USA) was used for all statistical analyses. Descriptive statistics were employed to summarize the data, where continuous variables were presented as mean and standard deviation for normally distributed data, and median and interquartile range for non-normally distributed data. Categorical variables were expressed as frequency and percentage. In the univariable analysis aimed at assessing the association between factors and cancer diagnosis, the Fisher exact test was utilized for categorical data, the Student’s t-test was applied for normally distributed data, and the Mann-Whitney U test was used for non-normally distributed data. Statistical significance was determined at P < 0.05.
Receiver Operating Characteristic (ROC) analysis was conducted to determine the predictive performance of CEA levels for cancer, with sensitivity, specificity, and likelihood ratios reported. To develop a clinical scoring system in addition to CEA levels, all clinical features were included in a multivariable logistic regression model. Subsequently, backward elimination was performed by removing predictors with a P-value greater than .2 and odds ratios closer to 1. Weighted scores were assigned to each predictor in the final model based on their logit coefficient, with the predictor having the lowest logit coefficient receiving a score of 1. The sum score of the dataset was then evaluated for its predictive performance, and the Area under the Receiver Operating Characteristic curve (AuROC) was estimated, with sensitivity, specificity, positive predictive value (PPV), negative predictive value (NPV), and likelihood ratios reported once again. Model discrimination was evaluated using the area under the AuROC. To internally validate the model and account for potential overfitting, bootstrap resampling was performed. Multiple bootstrap samples were generated with replacement from the original dataset, and the AuROC was estimated for each resample. The bootstrap-based standard error and 95% confidence interval were derived from the distribution of AuROC estimates. Model calibration was evaluated using both the Hosmer-Lemeshow goodness-of-fit test and calibration plots. The Hosmer-Lemeshow goodness-of-fit test indicated acceptable calibration (P > .05). This combined approach allowed assessment of statistical agreement as well as visual inspection of predicted versus observed risks across deciles of predicted probability. Additionally, sex-stratified analyses were performed to evaluate model performance across clinically relevant subgroups.
Results
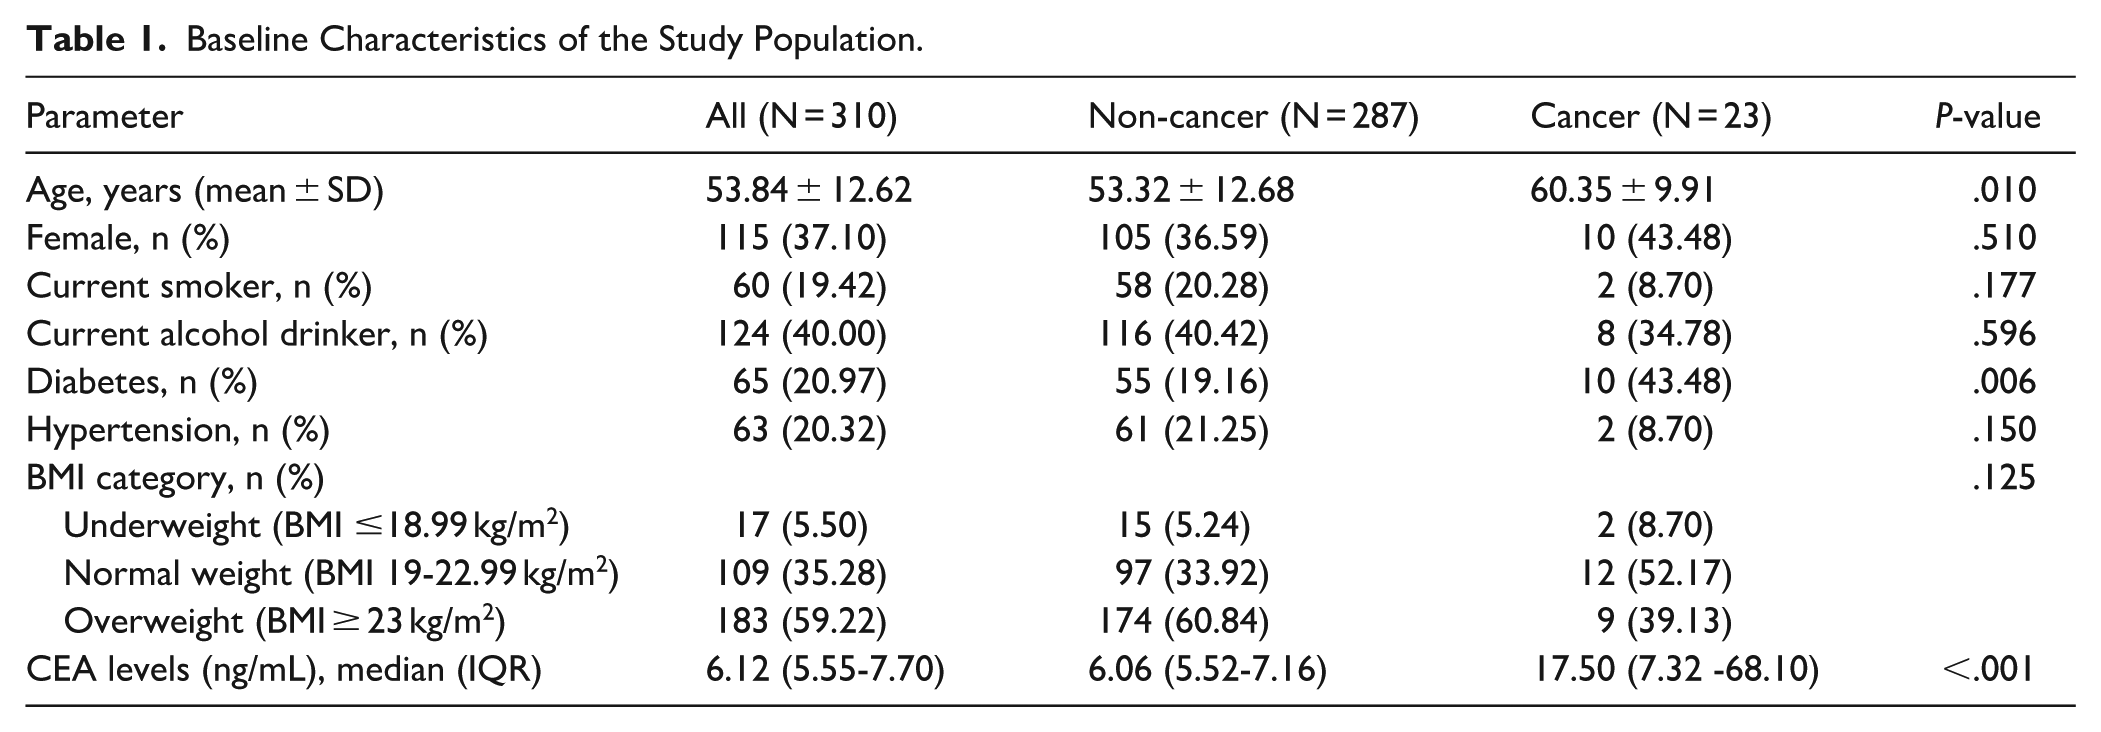
Of 17 859 records of individuals who underwent CEA screening, 310 cases had elevated CEA levels (Figure 1). Among these number of cases, 23 individuals (7.40%) had definite diagnosis of malignancy and 287 (92.60%) were without malignancy. Demographic data of all individuals are shown in Table 1. Cancer patients showed older age (P = .010) and higher percentage of diabetes (P = .006). The median of CEA levels of the overall population was 6.12 (IQR: 5.55-7.70) and they were significantly higher in the cancer group than in the non-cancer group (P < .001).

Flow diaphragm of study protocol.
Baseline Characteristics of the Study Population.
Among those diagnosed with cancer, the details of demographic data and cancer type were shown in Table 2. The most common cancers were colorectal cancer (35%), followed by hepatobiliary cancer (18%), lung cancer (17%), gynecologic cancer (17%), gastric cancer (9%), and other cancers (4%).
Details of Patients Diagnosed With Cancers With Elevated CEA Level.

The AuROC was as high as 0.825 in the ROC analysis performed to examine the ability of CEA to discriminate cancers among the CEA-elevated population. The ROC curve was shown in Figure 2. CEA level at 7.25 ng/mL demonstrated a sensitivity of 78.26%, specificity of 75.61%, PPV 20.5%, and NPV 97.7% and CEA level of 11.00 ng/mL showed a specificity 95%, sensitivity 56.52%, PPV 48.1%, and NPV 96.5%. The false-positive rates decrease in CEA cut off 7.25 and 11 ng/mL.

Comparative validation in terms of discrimination performance.
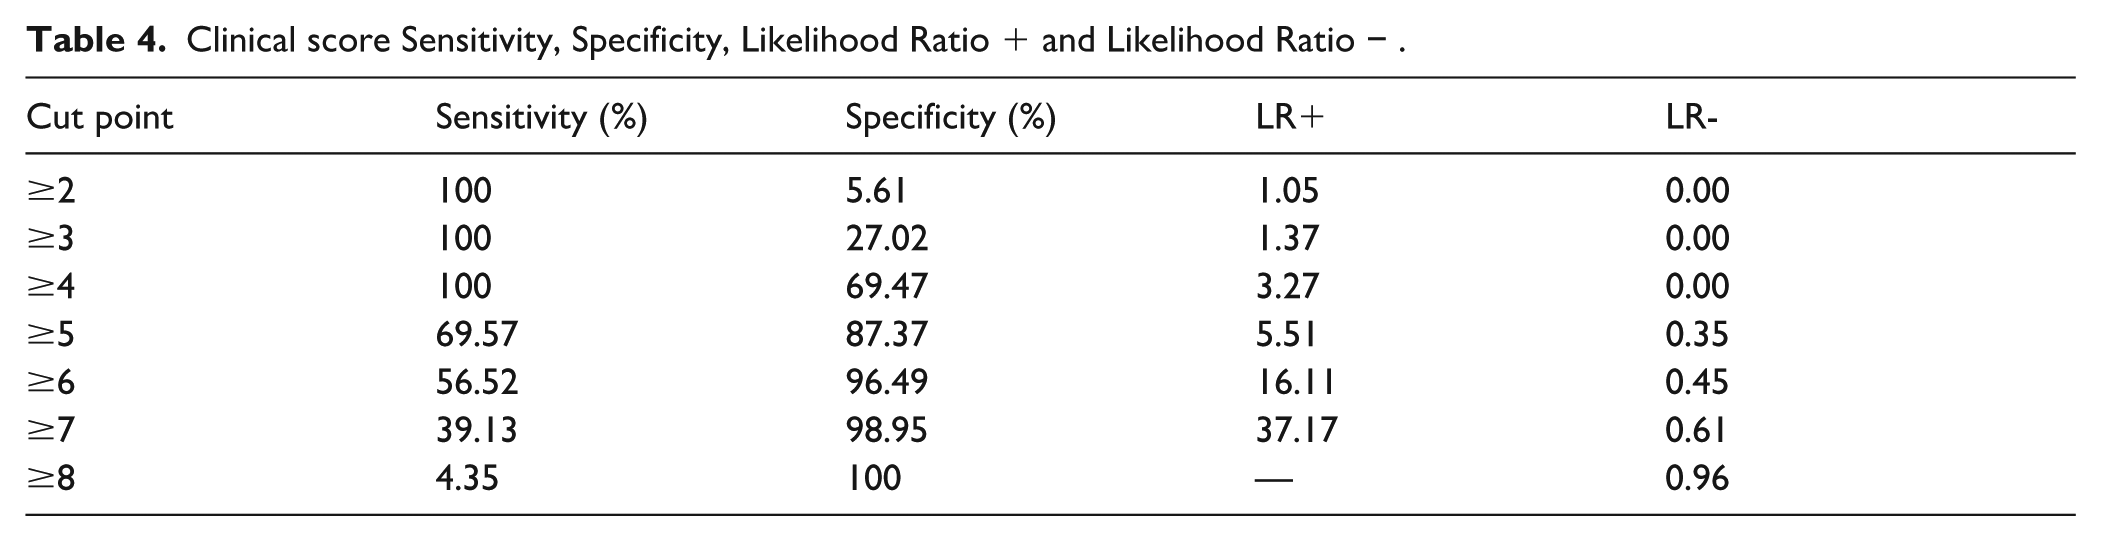
After performing backward elimination to remove non-significant predictors from the multivariable logistic regression model, we identified the following factors as significant predictors for cancer among individuals with high CEA levels: age, history of hypertension, history of diabetes, smoking status, and weight status (Table 3). Sensitivity, specificity, and likelihood ratios at each cut off point were shown in Table 4. This presents the diagnostic performance of the risk score across a range of cut-off points, allowing clinicians to select thresholds according to different clinical triage objectives. The comparative validation regarding discrimination performance between using CEA alone and using the clinical score plus CEA is illustrated in Figure 2. The addition of the clinical score to CEA increased the AuROC significantly compared to using CEA alone (0.918 vs 0.825, P = .023).
Odds Ratio, 95% CI, Coefficient, and Scores of Significant Predictors (Final Multivariable Regression Analysis Model).

Clinical score Sensitivity, Specificity, Likelihood Ratio + and Likelihood Ratio − .
Internal validation using bootstrap resampling showed consistent performance, yielding a bootstrap-estimated AuROC of 0.918 with a 95% confidence interval of 0.878 to 0.948. Regarding score calibration, the Hosmer-Lemeshow goodness-of-fit statistics indicated no statistical evidence of lack-of-fit (P = .327). Calibration assessment further demonstrated good agreement between predicted and observed cancer risk. As illustrated in the calibration plot (Figure 3), the observed probabilities closely followed the ideal reference line across the range of predicted risk, with only minor deviations at intermediate and higher probability levels. In addition, in sex-stratified analyses as shown in Figure 4, the model retained good discriminative performance in both males and females with slightly higher performance observed in males (AuROC 0.942 vs 0.872).

Calibration plot of the proposed prediction model.

ROC curves stratified by sex: (A) males and (B) females.
Discussion
Our study reported that 7.40% of individuals with high CEA had definite diagnosis of malignancy. The median CEA levels of the overall population was around 6. We found that when using the CEA levels to predict cancer, the predictive performance was high at 0.825 and even higher when integrated with the clinical score concerning age, history of hypertension, history of diabetes, smoking status, and weight status. Our novel clinical risk scoring system significantly improved predictive accuracy (AuROC increasing from 0.825 to 0.918), emphasizing the importance of comprehensive clinical evaluation when interpreting CEA levels.
While CEA levels in blood has limitations as a general cancer screening test due to its non-specificity and potential elevation in non-cancerous conditions (such as liver disease and inflammatory bowel disease), our findings highlight its potential ability to discriminate cancers when combined with clinical factors in individuals with elevated levels. When using CEA alone to predict cancer, in our study, at CEA levels above 11.00 ng/mL, the false-positive rate is less common (50.00%). As in previous studies, levels exceeding 10 ng/mL or trending upwards raise concern for malignancy,17-19 while levels above 20 ng/mL may suggest metastasis.20-22 Comparing to the result from Korea, the author suggested that false-positive results when CEA levels are above 20 ng/mL are less common. 7 Therefore, we would agree on suggesting extensive screening for cancer when CEA is above 20 ng/mL and it can be considered starting from 11 ng/mL. At this point, the clinical score can be used in addition to CEA levels, which includes the integration of variables such as age, history of hypertension, history of diabetes, smoking status, and weight status. To our knowledge, this is the first study that developed a clinical risk score for predicting cancer in addition to CEA levels, to be used in clinical decision-making for further investigation among people with high CEA. Therefore, there is no such previous study to compare the results with.
Our findings support the value of elevated CEA levels in predicting cancer risk among asymptomatic individuals with CEA elevation. Rather than defining a single optimal threshold, we present multiple cut-off points to reflect real-world clinical decision-making, where the balance between sensitivity and specificity may vary according to clinical context. In this regard, based on the sensitivity and specificity analysis, a cutoff point of 4 might be a reasonable threshold to consider for clinical triage, particularly when the goal is to prioritize individuals for urgent and comprehensive diagnostic evaluation, such as radiologic imaging, endoscopy, and gynecologic examination for females. This cut-off demonstrated high sensitivity (100%) while maintaining acceptable specificity (69.47%), supporting its potential role in identifying individuals at higher risk who may benefit from prompt investigation, while allowing clinical judgment to guide management in intermediate- and lower-risk groups.
Additionally, the variables included in the scoring system highlight the importance of interpreting CEA levels, which requires careful consideration in certain conditions. When having a history of current smoking and obesity, which have been known to influence CEA levels, it may lead to false-positive elevations. Obesity, in particular, can be associated with fatty liver, which can also contribute to elevated CEA, 10 while smoking itself can be associated with elevated CEA, as mentioned earlier.9,23 Thus, among non-smokers and non-obese individuals with high CEA levels, it appears to be associated with a higher cancer risk. Physicians should pay attention to these populations. Interestingly, while hypertension is linked to cancer risk, its relationship with CEA levels remains unclear in our study. The findings from our study suggest that clinicians should be more cautious when interpreting elevated CEA in the non-hypertensive individuals compared with those with underlying hypertension, although further study should be conducted to explain this observation.
From a biological and clinical perspective, markedly elevated CEA levels are more commonly observed in association with malignant processes than with nonspecific physiological variation. Previous evidence indicates that CEA expression is upregulated during colorectal carcinogenesis and is associated with tumor differentiation, cellular adhesion, and invasive potential. 24 Clinically, higher circulating CEA concentrations have been shown to correlate with advanced disease stage, greater tumor burden, metastatic involvement, and poorer prognosis in gastrointestinal malignancies. 4 Consistent with this biological rationale, our findings demonstrate that individuals with CEA levels exceeding 11 ng/mL exhibited a substantially higher odds of cancer compared with other clinical predictors included in the model. This observation supports the discriminatory value of pronounced CEA elevation and aligns with prior evidence suggesting that higher CEA thresholds are associated with increased specificity for malignancy. Accordingly, the differential weighting assigned to markedly elevated CEA levels in our scoring system reflects established biological plausibility and real-world clinical interpretation. Assigning greater weight to substantial CEA elevation enhances the model’s ability to identify individuals at higher malignancy risk, while the inclusion of additional clinical risk factors (each assigned equal weight) captures the cumulative contribution of patient-level characteristics that influence both cancer risk and CEA interpretation. This balanced approach supports clinical usability while preserving robust discriminatory performance.
The proposed model demonstrated strong and stable discriminatory performance, which was supported by internal validation using bootstrap resampling, indicating robustness of the model within the study population. Calibration assessment using a calibration plot showed good agreement between predicted and observed cancer risk across the range of predicted probabilities, with only minor deviations. In addition, sex-stratified analyses showed that the model maintained good discriminative ability in both males and females, with slightly higher performance observed in males, supporting consistency across clinically relevant subgroups. Together, these findings support the potential utility of the model for risk stratification among individuals with elevated CEA levels. However, external validation in independent cohorts is warranted prior to broader clinical application.
The present study is one of a few studies investigating the performance of CEA levels for its diagnostic accuracy in cancer, and all medical records underwent extensive review of the history, investigations, and follow-up. There are several limitations in the present study. First, the retrospective design may introduce bias related to the availability and completeness of data extracted from medical records. In addition, approximately 40% of screening visits were excluded due to loss to follow-up or follow-up duration of less than 1 year, which may have introduced selection bias, as individuals with poorer health status or lower healthcare utilization could be underrepresented. However, these exclusions were necessary to ensure accurate outcome ascertainment and to minimize outcome misclassification, thereby increasing the reliability of non-cancer diagnoses among included participants. Second, individuals with a prior history of cancer were excluded to reduce confounding by pre-existing malignancy and to improve the interpretability of associations between CEA levels, clinical predictors, and incident cancer. While this approach strengthens internal validity, it may limit generalizability to populations with recurrent or multiple malignancies. Third, this was a single-centered study, and further validation studies are needed due to potential differences in cancer prevalence in other regions. External validation using independent datasets from other settings is therefore warranted to confirm the robustness and transportability of the proposed risk prediction model. Lastly, we did not include other potentially relevant biomarkers that may need to be considered when analyzing their association with cancers.
Conclusions
While CEA alone demonstrated acceptable diagnostic performance, integrating CEA levels with routinely collected clinical risk factors, including hypertension, diabetes, smoking status, and weight status, enhanced the ability to stratify cancer risk among individuals with elevated CEA. The proposed clinical risk score has potential clinical utility as a triage tool to help prioritize individuals who may benefit from timely diagnostic evaluation, while potentially reducing unnecessary investigations in lower-risk patients. However, given the retrospective and single-center design of the study, external validation in independent populations is required before broader clinical implementation.
Footnotes
Acknowledgements
The authors would like to thank Mrs Antika Wongthanee and Miss Nuttanun Wongsarikan, Faculty of Medicine, Chiang Mai University, for the assistance with the statistical analysis.
ORCID iDs
Ethical Considerations
This study was conducted under review and approval from the Institutional Research Ethics Committee of Faculty of Medicine, Chiang Mai University (IRB number 8136/2564). All methods were carried out in accordance with relevant institutional guidelines and regulations.
Consent to Participate
Informed consent was waived by the Institutional Research Ethics Committee of Faculty of Medicine, Chiang Mai University, due to the retrospective nature of the study and the use of anonymous clinical data for analysis.
Funding
The authors received no financial support for the research, authorship, and/or publication of this article.
Declaration of Conflicting Interests
The authors declared no potential conflicts of interest with respect to the research, authorship, and/or publication of this article.
Data Availability Statement
The datasets used and/or analyzed during the current study are available from the corresponding author* on reasonable request (contact KPP).