
Abstract
Background:
The COVID-19 pandemic highlighted significant health disparities across the United States, with Texas ranking among the lowest in healthcare quality. This study explores the relationship between county-level factors and COVID-19 cases in Texas daycare centers. Unlike broader studies on COVID-19 disparities, this research uniquely examines the daycare population, a critical yet understudied environment, through county-level social determinants of health.
Methods:
Using 2020-2022 Covid data from the Texas Health & Human Services Commission and the 2020 County Health Rankings, we analyzed COVID-19 case counts among children and staff in licensed daycare facilities across 225 Texas counties. We classified counties into 4 patterns: high child-high staff, high child-low staff, low child-high staff, and low child-low staff. We also examined the association between county-level determinants and pandemic patterns.
Results:
Counties with higher COVID-19 cases in daycare centers have higher proportions of racial/ethnic minorities, but with better access to primary care physicians, better socioeconomic conditions (eg, % of children in poverty and median household income) and greater urbanization (P < .05). Spatial analysis of child and staff cases show the clustered transmission areas, in which southeastern counties with more Native Indians (1.48%) have a higher number of staff affected by COVID-19 than counties with fewer Native Indians (1.21%-1.26%).
Conclusion:
These findings underscore the influence of better access to screening on the COVID-19 counts, highlighting the importance of epidemiological surveillance. Improving healthcare access, addressing economic inequalities, and tailoring mitigation strategies are key to closing the gaps in different transmission rates among daycare centers.
Introduction
The COVID-19 pandemic magnified health disparities across the United States, with Texas particularly vulnerable due to systemic healthcare challenges. Ranked 48th out of 50 states in healthcare quality, Texas faces critical issues, including a 17% uninsured rate—the highest in the nation—and limited access to preventive care. 1 Persistent disparities in maternal and child health outcomes further exacerbate these challenges. For example, Texas has 1 of the highest rates of maternal mortality in the developed world, at 18.5 deaths per 100 000 live births, and childhood immunization rates below the national average.2,3 These deficiencies heighten the state’s susceptibility to health crises, resulting in disproportionate rates of preventable illness and mortality.
In 2020, Texas reported over 47 000 COVID-19-related deaths, a stark indicator of the state’s inequitable disease burden. 4 Following Gov. Abbott’s lifting of the Texas mask mandate and push to “Open Texas 100 Percent” in 2021, the number of children infected with COVID-19 rose quickly.5,6 Daycare centers, with young, unvaccinated children and small spaces, emerged as critical, yet understudied, settings for disease transmission among children and staff. Though COVID-19 was normally a mild disease for minors, the COVID-19-associated hospitalization rate per 100 000 children and adolescents skyrocketed when the Delta variant predominated. 7 Yet, young children were initially ineligible for vaccination, never included in vaccine mandates, and typically excluded from widespread screening protocols. 8 Additionally, small-sized daycare facilities could not easily implement 6-foot distancing or have enough rooms for all children. 6 This dual vulnerability of children and staff—children due to their ineligibility for vaccination during much of the pandemic, and staff due to their close and prolonged exposure to unvaccinated children—underscores the importance of understanding local drivers of COVID-19 transmission in daycare settings. Despite these challenges, limited research has explored how county-level SDOH influences outbreak patterns in daycare facilities, despite their embeddedness within broader community contexts.
Research has shown that county-level sociodemographic, economic, and health-related factors significantly influence COVID-19 outcomes in adults. Urban areas with dense populations, crowded housing, higher air pollution levels, and larger proportions of racial/ethnic minorities and uninsured individuals reported elevated rates of COVID-19 cases and deaths. 9 In Texas, counties with a higher percentage of Black/African American residents (averaging 6.34%, with a range up to 33.8%) reported significantly elevated COVID-19 mortality rates, reaching an average of 470.83 deaths per 100 000 population. Meanwhile, counties with greater socioeconomic deprivation (eg, 16% of the population living below the poverty line and 19.48% lacking a high school diploma) experienced disproportionately high mortality rates, reinforcing the link between vulnerability and pandemic outcomes. 10 This aligns with findings that social vulnerability, encompassing factors such as income inequality, crowded housing, and limited healthcare access, was strongly correlated with increased mortality during the pandemic, particularly in areas with high proportions of racial and ethnic minority populations. 10 For instance, counties in Texas with high scores on the CDC Social Vulnerability Index (SVI; top quartile, SVI ≥ 0.75) reported COVID-19 mortality rates as high as 940 deaths per 100 000 population, nearly double the rate of counties in the bottom quartile (SVI ≤ 0.25), which averaged around 470 deaths per 100 000. 11 These findings suggest that county-level characteristics, such as social vulnerability and demographic composition, may influence COVID-19 transmission patterns in daycare centers, reflecting the socioeconomic and demographic realities of their communities.
This study aimed to investigate the relationship between county-level SDOH and COVID-19 cases in Texas daycare centers (ie, children aged 0-13 and staff caregivers) between 2020 and 2022. Unlike broader studies of COVID-19 disparities in adult populations, this research uniquely examines daycare populations through the lens of community-level sociodemographic, economic, and healthcare factors. By incorporating spatial analysis, the study also identifies geographic clusters and transmission patterns, providing actionable insights for targeted interventions. These findings have the potential to inform public health and child education strategies aimed at reducing transmission and safeguarding vulnerable populations in daycare environments during future health crises.
Methods
Data Source and Populations
The source of the COVID-19 infection counts at Texas daycare facilities is Texas HHSC from Match 2020 to December 2022. 12 HHSC routinely collects and monitors the number of COVID-19 cases for children and staff at licensed childcare centers, school-age programs, and before or after-school programs. This is self-reported data to HHSC, and HHSC may not ensure reporting accuracy. This study used the latest data with the final sum of infection cases per facility by December 2022. Also, this study only used data from licensed daycare facilities that follow Texas’s childcare regulations closely and only enrolled children aged 13 and younger.
The source of county-level SDOH data is from 2020 County Health Rankings & Roadmaps (CHR&R). 13 CHR&R is a program designed and administered by the University of Wisconsin Population Health Institute to identify differences in health within and across a state. To better support county-level efforts, it uses a model that includes 4 domains: physical environment, social & economic factors, clinical care, and health behaviors. Each domain consists of several key metrics that are easily measured and compared across multiple counties. This study selected 2020 data to examine how socioeconomic conditions in 2020 might predict the COVID-19 pandemic result in 2022. This secondary data analysis is considered non-regulatory research and does not require approval by the Institutional Review Board.
Outcome Variables
The primary outcomes of this study are (1) the average number of child cases per county and (2) the average number of staff cases per county. We first summarized the total number of child or staff cases for each county. Then, we divided the total number of infection cases by the total number of facilities to obtain the average number of cases for each county. The secondary outcome is a categorical variable of infection rates including 4 dimensions (1) high-child-high-staff, (2) low-child-high-staff, (3) high-child-low-staff, and (4) low-child-low-staff. Of 225 counties with valid data, the average number of child cases is 3.29 and the average number of staff cases is 3.24. Therefore, any county that has an average number above 3.29 for children and 3.24 for staff are classified as “high” infection rate. Conversely, any county that has both numbers under 3.29 or 3.24, respectively, is classified as “low” infection rates.
Independent Variables
For this study, we selected 7 CHR&R predictors that represented different risk factors. For “demographic” characteristics, we chose (1) % of black/African American, Asian, Hispanic, and American Indian or Alaska Native residents per county and (2) % of rural populations per county. For “socioeconomic status,” we chose (1) % of children under 18 who are in poverty, (2) % of population under 65 without health insurance, (3) % of adults aged 25 to 44 with some college or post-secondary education, (4) % of population aged 16 and older who are unemployed but seeking work, and (5) median household income value. Finally, for “clinical care” performance, we chose (1) the ratio of population to PCPs, (2) % of annual Medicare enrollees having an annual flu vaccination, and (3) the number of avoidable hospital days. The only covariate for this study is the % of individuals aged 18 and younger per county. All models were adjusted for this covariate to prevent any confounding issues.
Analysis
Descriptive analysis was conducted to describe the minimum, maximum, mean, and standard error of our primary outcomes (ie, average number of child and staff cases per county). Spatial analysis was performed to demonstrate the clustered transmission areas/zones based on the average number of child or staff cases per facility per county using a gradient from light blue (fewer cases) to dark blue (more cases) across 225 counties in Texas. A scatter plot was used to illustrate the number of counties in each of the 4 dimensions (high-high, high-low, low-high, and low-low). Finally, multinomial logistic regression was conducted to examine the relationship between the secondary outcome (4 dimensions) and each of 14 predictors while adjusting for the covariate.
Supplementary (sFigure 1) illustrates the distribution of daycare facilities within 225 counties. Of 254 counties, 29 (11.4%) do not have any daycare facilities or have less than 10 cases. The final sample included data from 225 counties. As a result, the Moran’s I test to examine geographic correlations with nearby counties and test whether transmission clusters exist is not attainable in our study. Data was cleaned and managed by Microsoft Excel. Spatial and regression analyses were performed by Python and Stata v18. Any P-value less than 0.05 is considered statistically significant.
Results
Summary Statistics of 225 Counties
Table 1 provides an overview of the key variables in the study, summarizing the number of facilities, the total number of children and staff cases, and the average number of COVID-19 cases among children and staff of 225 counties that have daycare centers. The number of facilities per county varies significantly, with a mean of 30.2 facilities and a wide standard deviation of 89.4, indicating considerable variations across counties. Similarly, the total number of children and staff also show significant variation with means of 142.8 and 102.9, respectively. The average number of child cases per facility is 3.3 (SD = 2.7), while the average number of staff cases is slightly lower at 3.2 (SD = 3.1).
Infection Statistics of 225 Counties in Texas.

Spatial Distribution of COVID-19 Cases across Texas
Figures 1 and 2 illustrate the geographic distribution of clustered transmission areas based on the average child and staff COVID-19 cases by county in Texas. The heat maps show higher concentrations of cases in certain regions, which may correlate with population density, facility density, or other SDOH. sFigure 1 illustrates the distribution of daycare facilities which is slightly close to the distribution of the COVID-19 child case map.

Average child cases per facility by county.
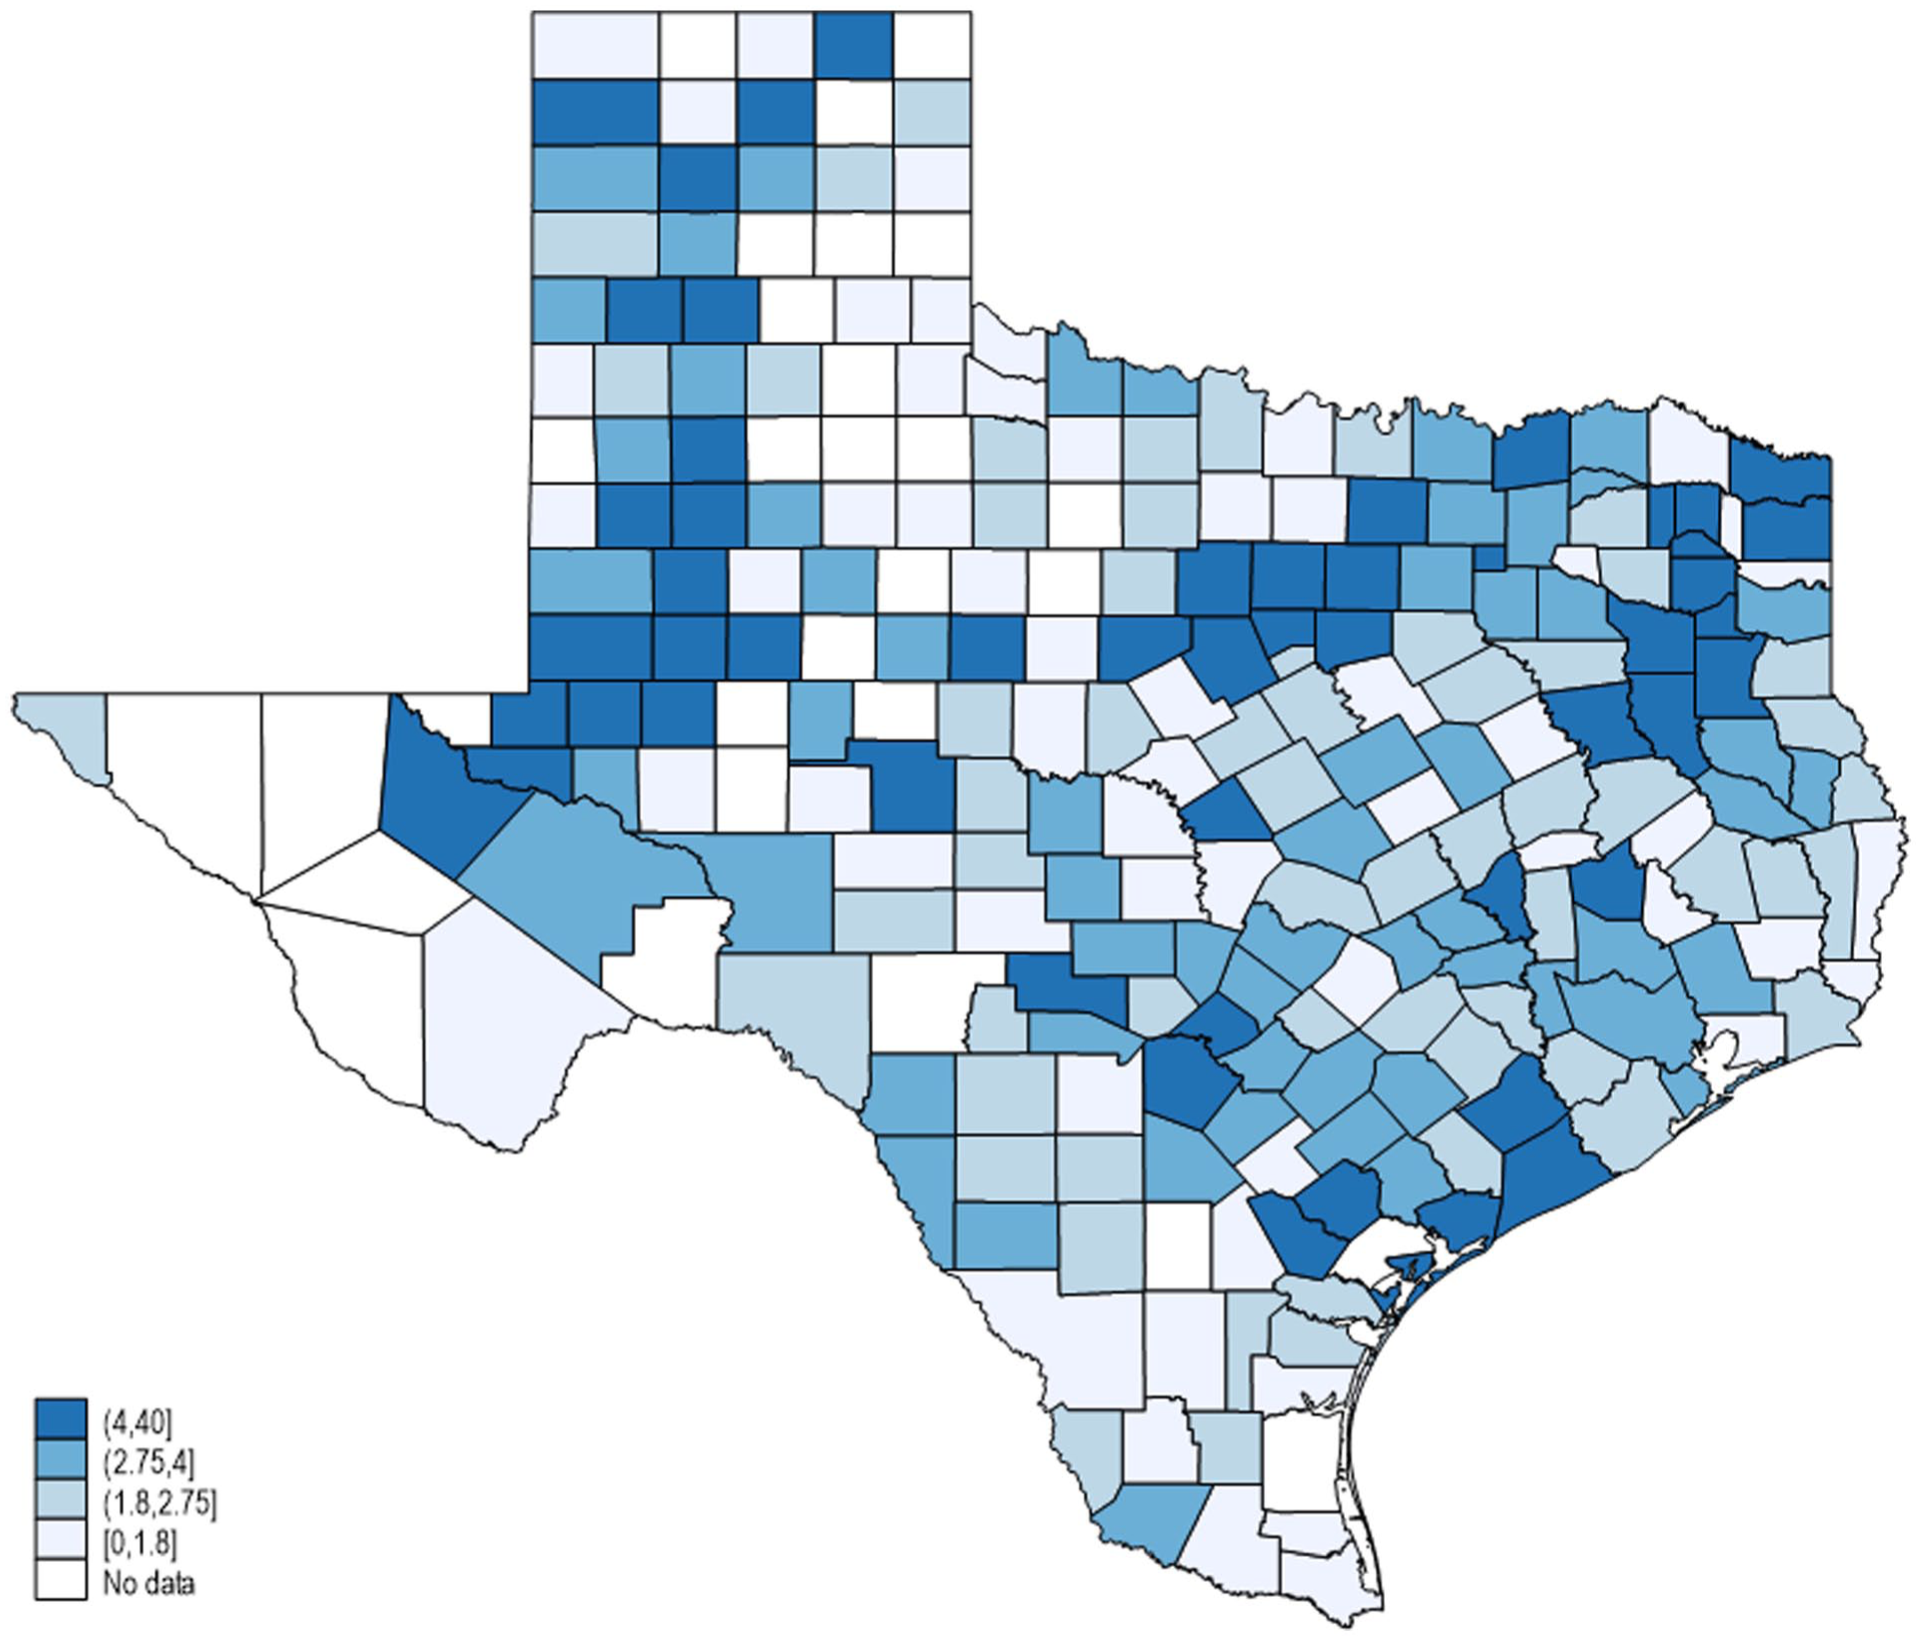
Average staff cases per facility by county.
Correlation between Children Cases and Staff Cases
Figure 3 presents a scatterplot that categorizes counties based on their child and staff COVID-19 cases. The plot visually demonstrates the distribution and clustering of counties in each scenario. Based on this classification, our secondary outcome includes 100 low-child-low-staff counties (green color, 44.4%), 35 high-child-low-staff counties (blue color, 15.6%), 25 low-child-high-staff counties (orange color, 11.1%), and 65 high-child-high-staff counties (red color, 28.9%).

Scatterplot depicting 4 scenarios of Covid-19 cases.
Social Determinants of Health Analysis
Table 2 examines the relationship between SDOH and 4 COVID-19 case scenarios across 225 counties. Counties with high child-high staff cases had a higher black population percentage (8.10%) than counties with low child-low staff cases (6.10%) (P < .05). A county with a higher % of Asian populations was more likely to have more child cases (high-child-high-staff: 2.08% > low-child-low-staff: 0.93%) and a county with a higher % of Native Americans (low-child-high-staff: 1.48% > low-child-low-staff: 1.26%) is more likely to have higher staff cases. However, there is no significant difference based on the % of Hispanic population.
Association Between Pandemic Patterns and Social Determinants of Health.
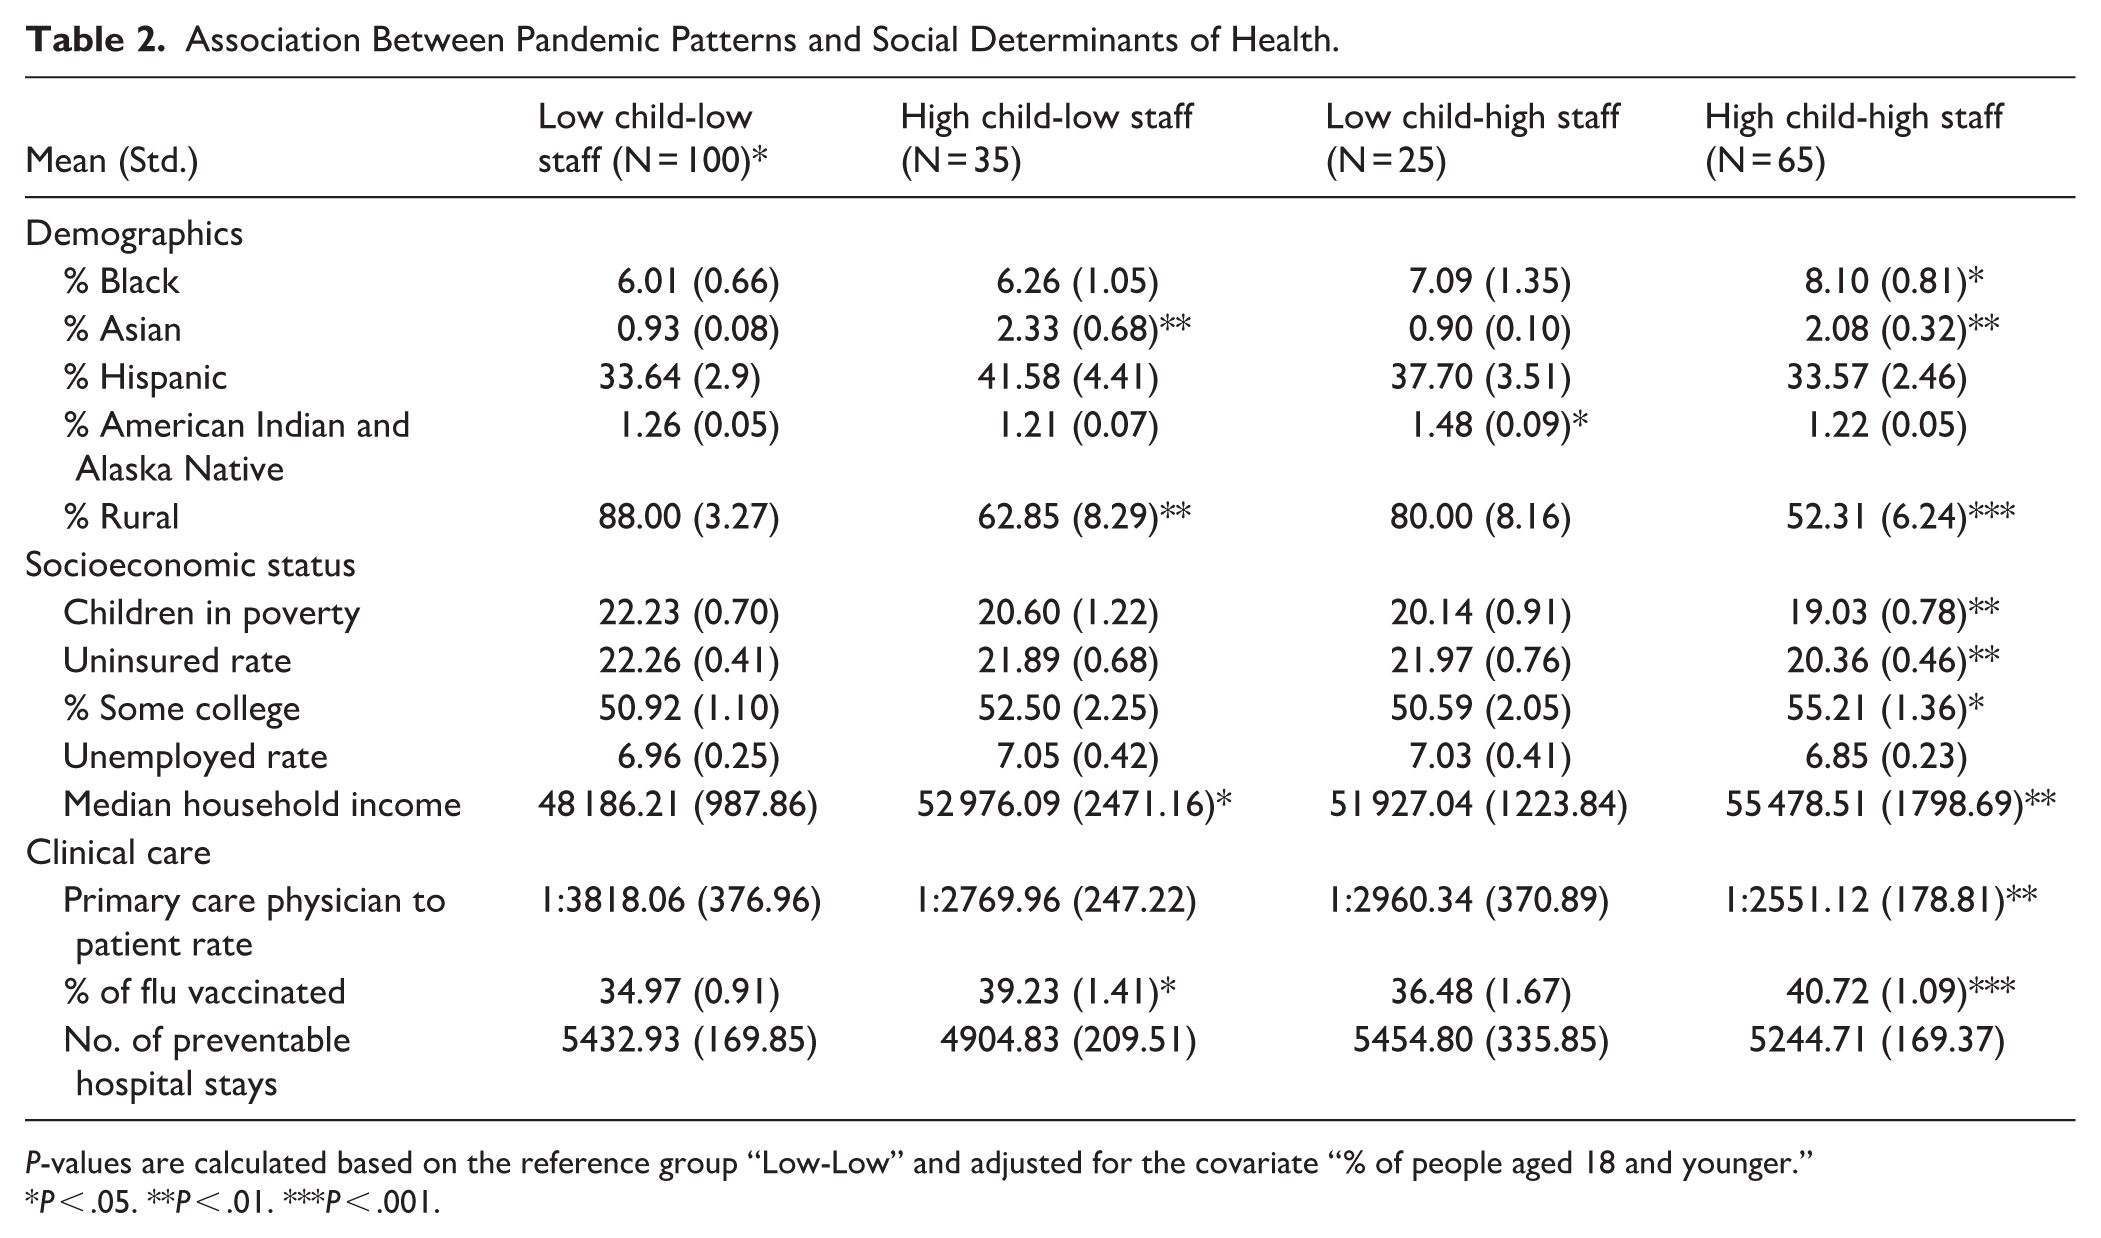
P-values are calculated based on the reference group “Low-Low” and adjusted for the covariate “% of people aged 18 and younger.”
P < .05. **P < .01. ***P < .001.
Next, a county with a lower % rural population (52.31%) (or more urbanization), lower children in poverty (19.03%), and less uninsured (20.36%) fell into the high child-high staff category. We also found that a higher percentage of some college degrees (55.21%), higher median household income ($55478.51), lower PCP to patient ratio (2551.12: 1) (or better access to PCP), and more flu shot coverage (40.72%) were significantly associated with high child-high staff cases (P < .05). Finally, no difference in unemployment rate and preventable hospital days was found.
Discussion
In comparing the December 2022 HHSC COVID case count per daycare facility to each county’s 2022 CHR&R demographic and socioeconomic reports, several trends emerged. The trends in daycare COVID distributions, measured across geographic areas, demographics, socioeconomic status, and clinical care could allow tailoring of future public health efforts to individual county needs, best utilizing limited resources.
Spatial Distributions
Figures 1 and 2, respectively, depict Texas counties heat-mapped to show case density of child and staff cases per facility. Many areas (approximately 73%) show a great deal of overlap, with concordant higher or lower transmission per facility in both child and staff rates, also indicated by the scatterplot in Figure 3. Counties with higher numbers of child and staff rates appear largely within urban and suburban areas with higher population density. 14 This is further indicated in Table 2, which shows a lower percentage of rural areas falling in these high-child, high-staff counties. These more urban daycare centers may have higher infection rates due to larger facilities, higher total census, higher risk of overcrowding, spatial limitations due to higher cost-per-area facilities, and lower social distancing within classrooms. 15
Comparing the maps, the geographic pattern in staff cases appears close to the overall distribution of COVID-19 cases in Texas, whereas the pattern in children differs from both, highlighting differing transmission patterns between children and adults. 16 Among daycare providers, transmission may be linked more to community-level transmission, rather than to working in daycare itself. 17 While adults are at a higher risk of transmission from an infected child, child-to-child transmission is relatively low.18,19 Next, Figure 3 indicates approximately 27% of counties fell with only child or staff transmission being high, while the other measure was below average. The distribution of child cases is also close to the distribution of facilities (sFigure 1), indicating the transmissions happened within daycare. Individual center and county differences could exist in terms of county guidance, masking, adherence to cleaning and sanitation efforts, and social distancing among children, staff members, and parents, which could each partially explain some of the variability here. 20 The government requested daycare workers to stay at home if tested positive or if showing any symptom, causing 25% centers to close.21,22 More evaluation is required to ascertain the level of homogeneity between these counties in absolute case numbers and factors that lead to geographic differences.
Demographic Trends
The disproportionate COVID-19 transmission and death rates among racial minority communities is established. Figures show relationships as strong as 5% increased prevalence for every 1% increase in African American population. Further, within Hispanic populations, infection risks may be up to 28 times higher, though most figures fall between 1.3 to 7.7 times higher.23,24 This study indicates a statistically significant link between having a higher percentage black population and the county falling within the high-child, high-staff quadrant (Table 2). The closure of childcare centers are concerning for parents as their kids may fall behind after the pandemic. 25 Interestingly, our results do not indicate a relationship between percent Hispanic population and pandemic pattern within the daycare setting. It is known that Hispanic communities utilize fewer daycare programs, as these communities historically have fewer childcare centers serving their areas. 26 One study found white and black households enrolled 70% of their children in daycares by age 4, while only 52.4% of Mexican-origin households were enrolled. 27 Counties with higher Asian populations were more likely to fall within the high-child, low-staff infection group. This relationship may be related to wealth distributions, as Asian populations only account for 6% of Texas population and are in aggregate less likely to have children living in poverty. In other words, families with higher median household incomes are more able to pay for daycare and live in an area falling into the high-child, low-staff infection group. Additional data to stratify the data by child and staff would be helpful to understand gaps in COVID-19 transmissions and solutions within daycare settings.
Socioeconomic Status Trends
In contrast to the literature showing how outbreak is related to poor socioeconomic conditions, our study found that high case counts were in the areas with fewer children living in poverty, fewer uninsured patients, higher percentages with some college, and higher median income levels.9-11 Possible reasons for these trends could be better financial situations where families could afford daycare for their children when the tuition was raised due to staffing shortage and limited number of centers for families to choose. 28 Further analysis of the data suggests these quadrants may have improved access to preventive and clinical care, as measured by higher PCP-to-patient and higher flu vaccination rates. Likewise, facilities in more affluent areas could have higher compliance with case reporting, leading to higher detection of case numbers, rather than a true measure of COVID prevalence. A national analysis showed higher numbers of cases in poorer and more urban counties within the first 10 weeks of the pandemic. 29 However, by later weeks, more affluent counties had overtaken disadvantaged communities in caseload prevalence despite continued higher deaths in lower-income areas. The study suggests testing availability accounts for these trends, which appear replicated within our results. Given that Texas data also show a high testing rate among African American and urban populations, more work is needed to understand the relationship between testing, availability of care, and COVID’s impact on the Texas population. 30
Limitations
Our study is unique in considering COVID-19 trends specifically within daycare children and staff. However, this method is limited by reliance on self-reported data by childcare facilities to the Texas HHSC without information on enrollment rate and staff turnover and thus may not be fully accurate. Due to budget and legal concerns, the daycare data after December 2022 was not publicly available. No facility-level covariates such as number of staff is available either. Additionally, while attempts were made to stratify data into quadrants based on child- and staff-counts, case counts varied widely, and counties falling within each quadrant are not necessarily homogeneous. The dichotomization of continuos outcomes using sample means may result in information loss and results should be interpreted with cautions. Unmeasured variability exists within counties in each quadrant, such as household crowding, parental employment status, transit dependence, and availability and acceptability of COVID-19 vaccines. Qualitative case studies of each county could provide much richer data that are not feasible within this format.
Conclusion
While vaccination remains 1 of the greatest protective measures against infection with COVID-19, recognizing and mitigating potential infection sources can improve community health factors. Our analysis demonstrates daycare centers were potential areas of high-risk for COVID-19 infections. Our data suggests higher socioeconomic status communities had higher rates of infections compared to other regions in Texas. This may be due to the increased number of minors in daycare due to parental income being able to afford the cost of daycare. Additionally, with increased access to care, these communities were more likely to engage with their PCP and increase the likelihood of covid testing and diagnosis. On the other hand, high percentages of minority populations are associated with higher infections. This possibly was a result of more minority groups serving as essential workers and placing kids in daycare rather than taking care of them at home. Further data analysis utilizing county data can be useful for identifying demographic and socioeconomic drivers of health in these counties to direct resources and targeted approaches to public health measures during future health events.
Supplemental Material
sj-docx-1-jpc-10.1177_21501319261417913 – Supplemental material for Examine COVID-19 Pandemic Patterns in Daycare Centers: How Access to Screening Matters
Supplemental material, sj-docx-1-jpc-10.1177_21501319261417913 for Examine COVID-19 Pandemic Patterns in Daycare Centers: How Access to Screening Matters by Meghana Potturu, Nova C. Phillips-Latham, Samuel Mathis and Wei-Chen Lee in Journal of Primary Care & Community Health
Footnotes
Acknowledgements
The authors would like to acknowledge Christen Walcher for editing and formatting the manuscript.
Ethical Considerations
This secondary data analysis is considered non-regulatory research by the Institutional Review Board.
Funding
The authors received no financial support for the research, authorship, and/or publication of this article.
Declaration of Conflicting Interests
The authors declared no potential conflicts of interest with respect to the research, authorship, and/or publication of this article.
Data Availability Statement
Both county level datasets are publicly available online (https://www.hhs.texas.gov/about/records-statistics/data-statistics/texas-covid-19-case-count-vaccination-data) & (![]() ).
).
Supplemental Material
Supplemental material for this article is available online.
References
Supplementary Material
Please find the following supplemental material available below.
For Open Access articles published under a Creative Commons License, all supplemental material carries the same license as the article it is associated with.
For non-Open Access articles published, all supplemental material carries a non-exclusive license, and permission requests for re-use of supplemental material or any part of supplemental material shall be sent directly to the copyright owner as specified in the copyright notice associated with the article.