
Abstract
Objective:
To estimate associations between transportation barriers and diabetes outcomes.
Methods:
Longitudinal cohort study; 86 977 adults with type 2 diabetes mellitus in community-based health centers were assessed for transportation barriers, with up to 36 months of follow-up after initial assessment. We compared scenarios in which individuals did not experience transportation barriers to scenarios in which they did, to estimate differences in mean hemoglobin a1c (HbA1c), systolic and diastolic blood pressure (SBP and DBP), and LDL cholesterol. For analysis, we used targeted minimum loss estimation at the following timepoints after initial transportation barrier assessment: 12 (primary), 6, 18, 24, 30, and 36 months. The study period was June 24, 2016 to April 30, 2023.
Results:
We estimated that if participants did not experience transportation barriers, mean HbA1c would have been 0.09% lower (95% CI = −0.14% to −0.04%, P = .0002) at 12 months, compared to a scenario in which they did experience transportation barriers. These results were similar at other time points. We also estimated that absence of transportation barriers was associated with, at 12 months, lower SBP (−0.6mm Hg, 95% CI = −1.0mm Hg to −0.2mm Hg, P = .004) and DBP (−0.3mm Hg, 95% CI = −0.5mm Hg to −0.1mm Hg, P = .02), but not LDL (−1.1mg/dL, 95% CI = −2.6 mg/dL to 0.5 mg/dL, P = .19). Results at other time points for SBP, DBP, and LDL outcomes were similar.
Conclusions:
Absence of transportation barriers was associated with slightly lower hemoglobin A1c and blood pressure, but the small magnitude of the differences suggests that also addressing other factors may be needed to improve diabetes outcomes more meaningfully.
Keywords
Introduction
Transportation barriers impede individuals’ ability to access needed medical care, go to work, or obtain goods and services necessary for daily living. These barriers are common in the U.S., and have important adverse health consequences.1 -10 Such consequences may be magnified for those with type 2 diabetes mellitus (T2DM), who are recommended to receive 2 to 4 healthcare visits a year with a primary provider, and often require other visits for specialty care, retinopathy screening, foot examinations, and lab work.11 -13 By impacting patients’ ability to receive these services, transportation barriers could worsen T2DM outcomes. In particular, if individuals cannot access needed care, it may be more difficult to control glycemia, blood pressure, and cholesterol levels, all of which are key to preventing T2DM complications.11,14
Despite these potential harms, little evidence exists to quantify what improvements in T2DM outcomes may be possible if transportation barriers were addressed. 15 Such information is critical for intervention planning. Although randomized clinical trials would help provide this knowledge, they take many years to conduct, often enroll samples that differ from the population of interest, 16 and can present ethical challenges if those in need are not offered assistance. Moreover, such trials are resource-intensive, so understanding what impacts can be expected and what sample sizes are needed helps with intervention planning. Thus, a study using observational data can be useful to help understand the potential for improvement in T2DM outcomes that addressing transportation barriers might provide.
In this observational study, we used a target trial emulation framework (described in more detail in the Methods section) 17 to estimate the potential of addressing transportation barriers to improve T2DM outcomes. Specifically, we sought to estimate whether not experiencing transportation barriers, compared with experiencing them, would be associated with better glycemic, blood pressure, and cholesterol outcomes among adults with T2DM in a network of community-based health centers.
Methods
This retrospective cohort study adapted target trial emulation methodology 18 to help understand the potential impact of addressing transportation barriers on T2DM outcomes. We used electronic health record (EHR) data from community-based health centers which share an EHR provided by OCHIN (not an acronym).19,20 Included records had dates of service between June 24, 2016 and April 30, 2023, which provided the maximum number of observations feasible for our analyses. The University of North Carolina at Chapel Hill Institutional Review Board provided human subjects research approval for this project.
Target Trial Protocol
Target trial methodology encourages investigators to design their observational study as if it were a randomized trial. Here we highlight important aspects of the study design and provide a detailed protocol (Supplemental eTable 1), comparing differences between the trial emulation and how an actual trial would be conducted.
Participants were identified as individuals who were adults (age >18 years) with T2DM 21 who had at least 1 assessment for transportation barriers during the study period. Transportation barrier data came from several health-related social need assessment tools, most commonly the Protocol for Responding to and Assessing Patient’s Assets, Risks, and Experience (PRAPARE) and the Accountable Health Communities Health-Related Social Needs Screening tool.20,22 -25 An example question was “In the past 12 months, has lack of reliable transportation kept you from medical appointments, meetings, work, or from getting things needed for daily living?”. 24 A participant who reported at least 1 positive response to a transportation barrier assessment item was considered to be experiencing a transportation barrier.
We studied 2 hypothetical intervention strategies—a strategy of preventing transportation barriers (primary strategy) and a strategy of “treating” transportation barriers once they occur (secondary strategy).
The primary strategy contrasted 2 hypothetical scenarios—1 in which individuals were “assigned” to never experience a transportation barrier during the analysis period (“no transportation barriers”), and 1 in which individuals were “assigned” to always experience a transportation barrier during the analysis period (“transportation barriers”). These analyses were intended to estimate how preventing transportation barriers may impact T2DM outcomes. Participants were considered “assigned” to a particular exposure based on their responses to their first transportation barrier assessment. Those who reported a barrier at initial assessment were considered to have been “assigned” to the “transportation barriers” exposure group, and those who reported not having a transportation barrier were considered “assigned” to the “no transportation barriers” exposure group. These “assignments” occurred based on initial transportation barrier assessment, but experiencing transportation barriers is a time-varying exposure, and so adherence to the “assigned” exposure must be taken into consideration for analysis. We discuss how we assess “adherence” to these “assigned” exposures, and how we addressed cases in which individuals stopped adhering, further below.
The secondary strategy focused on individuals who reported a transportation barrier. We contrasted a scenario (“resolved transportation barriers”) in which individuals who experienced a transportation barrier were “assigned” to stop experiencing that barrier (based on no longer reporting a transportation barrier at the next transportation barrier assessment after they first reported a transportation barrier) with a scenario (“continuing transportation barriers”) in which individuals who experienced a transportation barrier were “assigned” to continue to experience that barrier (based on still reporting a transportation barrier at their next transportation barrier assessment after they first reported a transportation barrier). These analyses were intended to estimate how “treating” transportation barriers after they occur may impact T2DM outcomes.
The primary study outcome was hemoglobin A1c (HbA1c). Secondary outcomes were blood pressure (both systolic and diastolic—SBP and DBP), and low-density lipoprotein cholesterol (LDL).
In this observational study, we needed to adjust for factors that could confound the relationship between transportation barriers and T2DM outcomes. On the basis of prior studies demonstrating such an association,1 -7, 10 we selected the following covariates for adjustment: age at first transportation barrier assessment, date of first transportation barrier assessment, sex (recognizing that the available data may not distinguish well between sex and gender), race and ethnicity (social constructs included because how individuals are categorized may affect their experience of racism), preferred language, an ICD-10 diagnostic code based comorbidity index (constructed using codes from the time of first transportation barrier assessment), 26 health insurance coverage (categorized as Medicaid, Medicare, Other Public, Private, or Uninsured), income (expressed as percentage of the federal poverty threshold, which incorporates household size and inflation), social vulnerability index calculated at the census tract level (SVI), 27 and the value of the outcome prior to transportation barrier assessment (eg, SBP prior to transportation barrier assessment for analyses where SBP was the outcome). Health insurance, SVI, and income were time-varying covariates. A directed acyclic graph (DAG) encodes the assumptions of our analyses (Supplemental eFigure 1). We did not adjust for factors that could mediate the association between transportation barriers and study outcomes such as changes in or adherence to medication regimens.
Our primary set of analyses contrasted the mean levels of the outcomes under the “no transportation barriers” and “transportation barriers” scenarios. If the conditions for causal inference (conditional exchangeability, positivity, and consistency) were met, this would represent an “average treatment effect” (ATE) estimand (an estimand is the parameter an analysis aims to estimate). However, it cannot be known whether these conditions were met in this observational study, and so we do not advocate a causal interpretation of the findings.
For the primary analyses, follow-up began at the first date of transportation barrier assessment (Supplemental eFigure 2). This represents “time zero,” the date at which an individual was deemed eligible for the study and when their exposure was first “assigned,” based on their transportation barrier status at that time. 17 Aligning eligibility, exposure assignment, and the start of follow-up helps avoid biases in this observational study. 17
A second set of analyses contrasted the mean levels of the outcomes under the “resolved transportation barriers” and “continuing transportation barriers” scenarios. For these analyses, follow-up began at the next date of transportation barrier assessment after the first positive assessment.
The primary timepoint for all analyses was 12 months after the start of follow-up. Secondary timepoints were 6, 18, 24, 30, and 36 months.
Because experiencing a transportation barrier, or not, is a time varying exposure, we needed to account for the possibility that a person may, at some point during follow-up, no longer follow their “assigned” exposure (eg, if a person who was “assigned” to experience transportation barriers subsequently reported not experiencing a transportation barrier, their data would be censored going forward).17,28 In these cases, data were censored from the point an individual stopped following their “assigned” exposure. Censoring in these cases of “cross-over” helps prevent biases that could result from either including data that was no longer consistent with the “assigned” exposure or removing participants who “cross-over” from the analysis entirely. 29 Participants were considered “lost to follow-up” if they did not complete a transportation barrier assessment at least every 2 years (needed to assess adherence to the “assigned” exposure), or if they did not have at least 1 outcome assessment within a 6-month period prior to (and including) the specific timepoint. For example, to be included in the 24-month DBP analyses, a participant must have had a DBP recorded between 18 and 24 months after index date. Censoring was specific to a particular analysis, so individuals censored for 1 outcome and timepoint could be included in analyses for other outcomes and timepoints if their data permitted.
Other missing data (ie, data not relevant for the censoring decisions described above) was handled using 50 datasets created using multiple imputation with chained equations (Supplemental eTable 2). 30
Statistical Analysis
We used a targeted minimum loss estimation (TMLE) approach because this method can account for possible confounding along with possibly informative censoring.31,32 TMLE has elements that are analogous to the g-computation formula, propensity score methods, and inverse probability of censoring weighting. It is a multiply robust analytic method that first estimates an outcome model (the relationship between the exposure and the outcomes, accounting for covariates). 33 It then fits a model estimating the probability of exposure and remaining uncensored. The estimates from this model are then used to create a covariate for a new outcome model that “updates” the estimate from the initial outcome model. This helps to reduce bias present in the initial outcome model by incorporating information about the probability of exposure and censoring given observed covariates.
Our primary analytic approach used TMLE with generalized linear models. However, TMLE can also incorporate machine learning methods using a “SuperLearner” approach that creates a weighted average of estimates from several algorithms through cross-validation. 34 Some of these methods may better account for interactions and non-linearities in the data, overall reducing the risk of model misspecification, relative to generalized linear models. However, doing this is computationally intensive, especially for large datasets and longer timepoints. For this reason, we used TMLE with SuperLearner for sensitivity analyses, to look for whether there were important differences in estimates when using the SuperLearner approach versus generalized linear models alone. The ensemble of learners used was multivariable adaptive regression splines, generalized linear models, and extreme gradient boosting. Analyses were conducted in SAS version 9.4 and R version 4.3.1. 35 Estimates were pooled across multiply imputed datasets and combined following Rubin’s rules.
Results
The main analyses included 86 977 adults with T2DM who had at least 1 assessment for transportation barriers. Mean age was 55.4 (SD = 13.6) years and mean household income was 114% of the federal poverty threshold (SD = 258%; Table 1). Participants resided in 41 states and data came from 1187 distinct organizational units within healthcare facilities. Individuals had a repeat HbA1c measured a median of every 129 days (25th percentile 79 days, 75th percentile 196 days, mean 158 days, SD = 149 days).
Demographic Characteristics of Cohort.
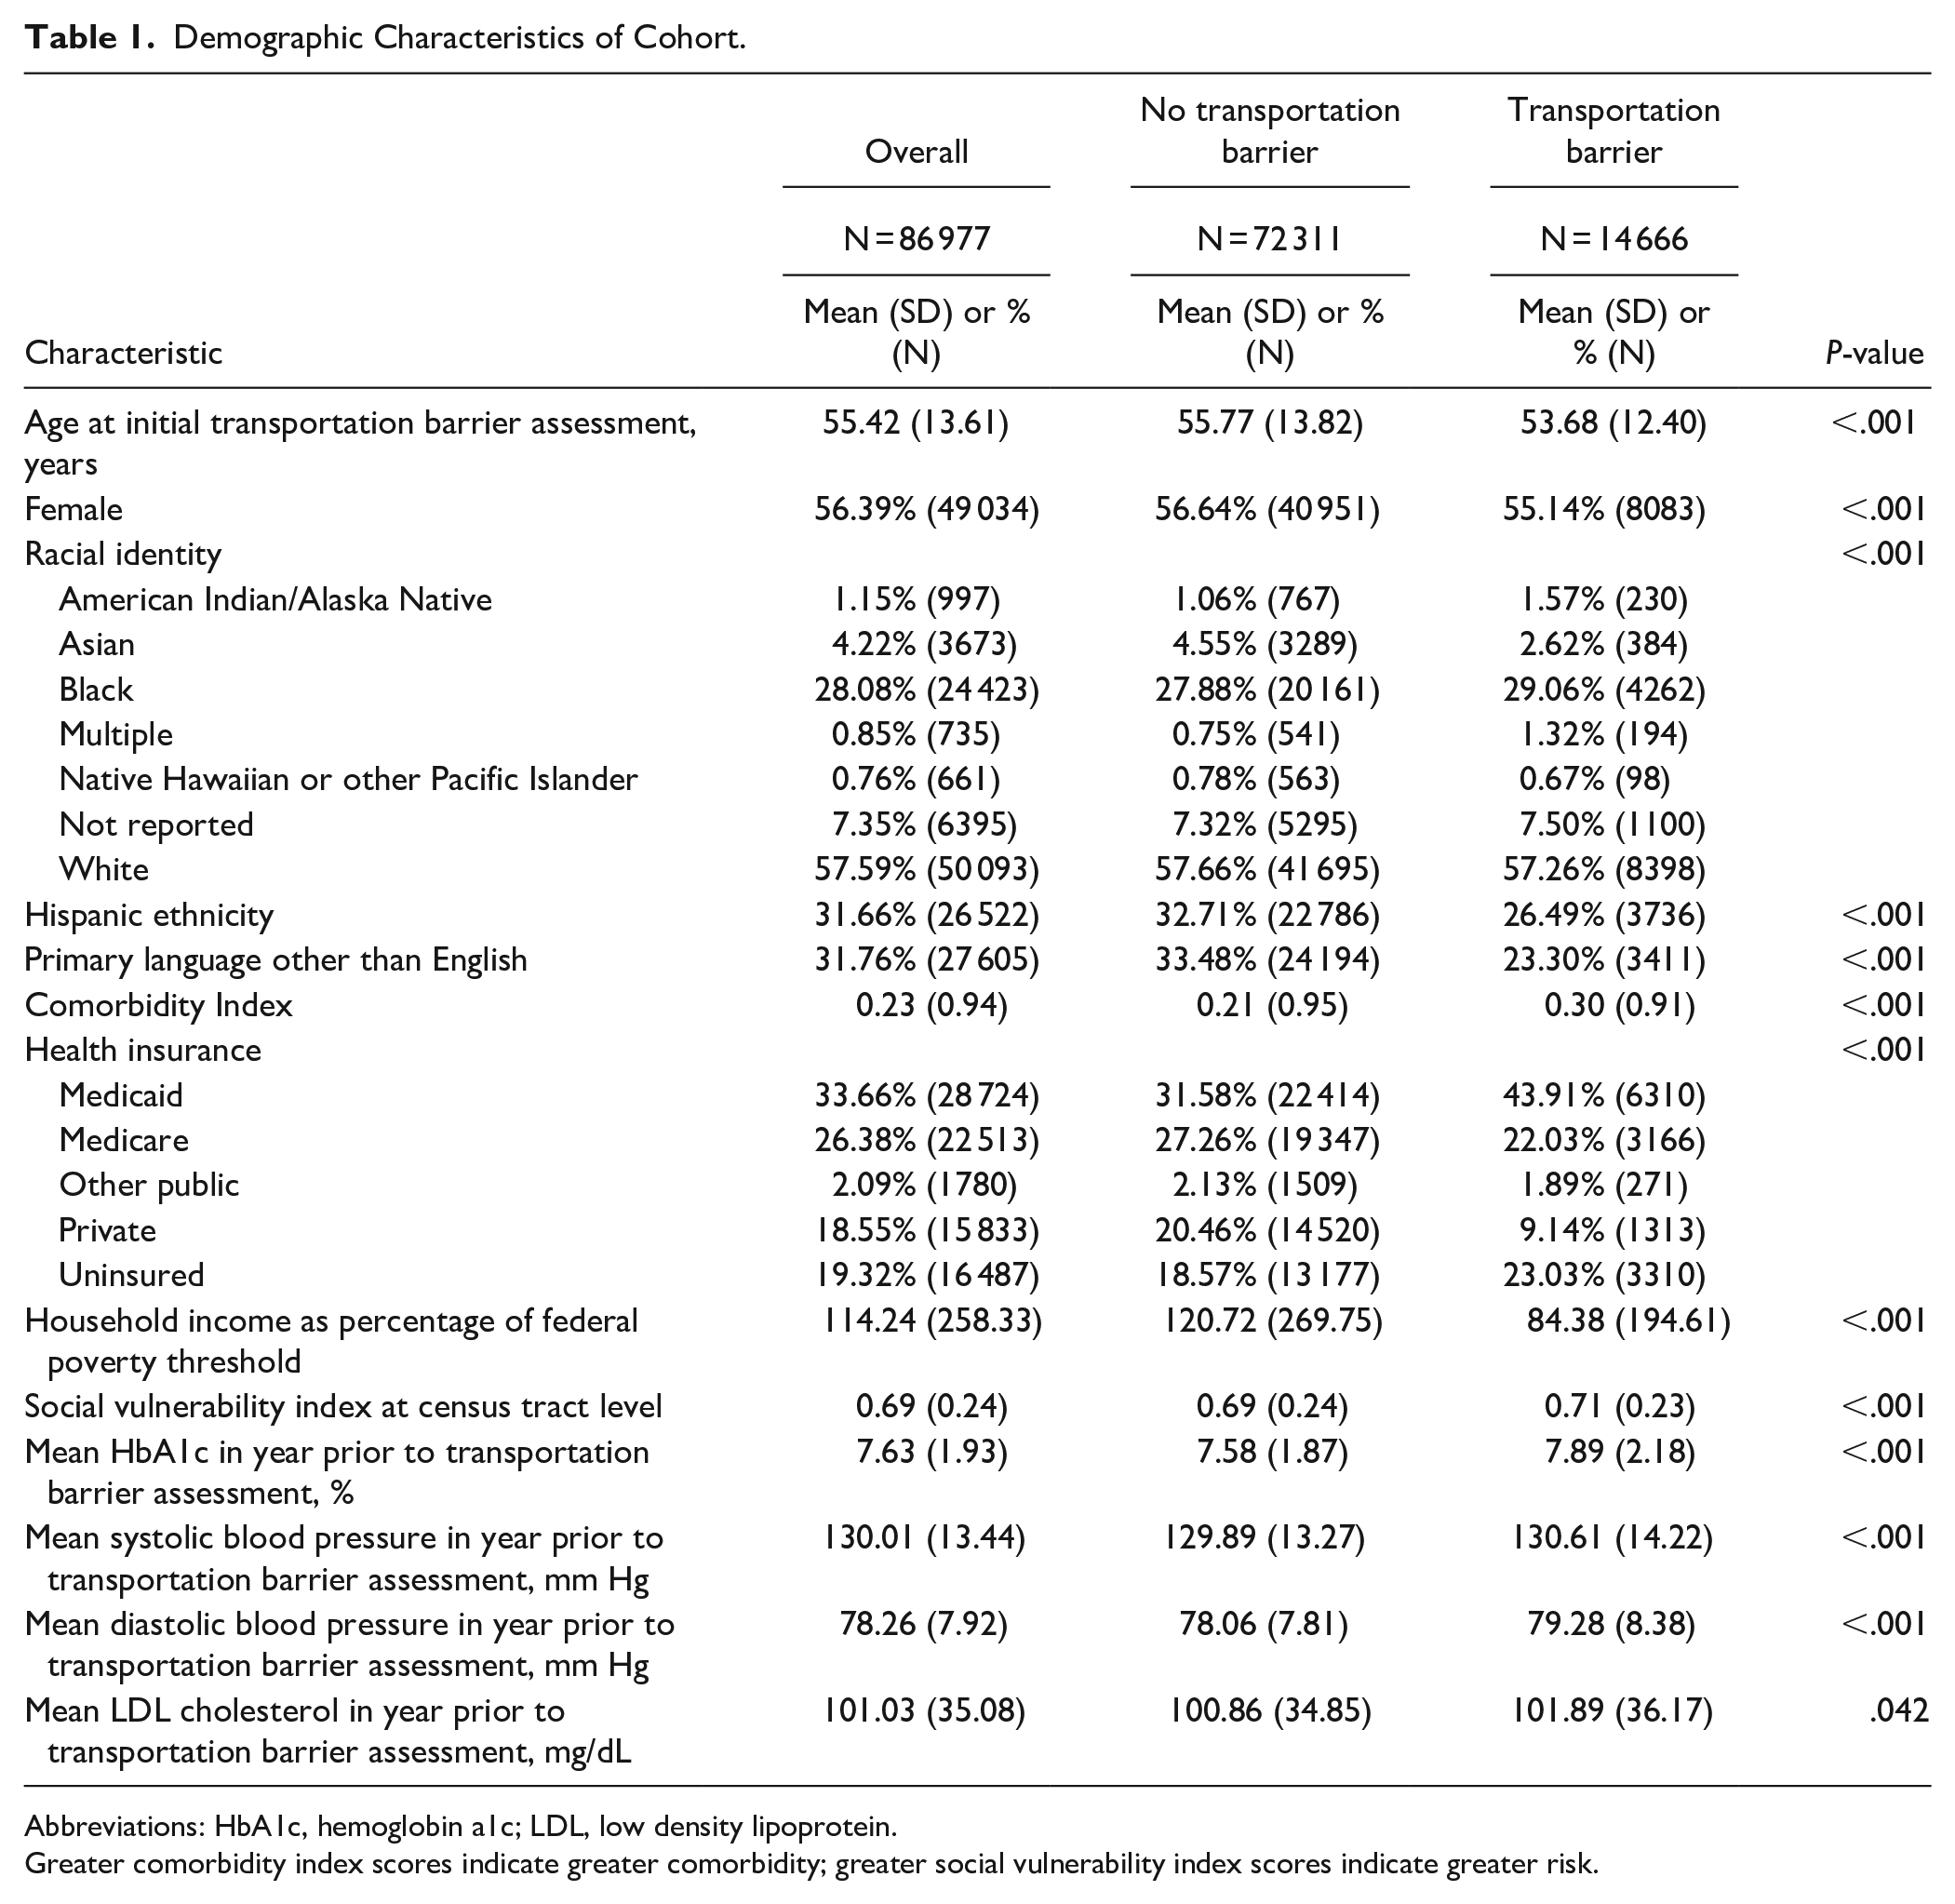
Abbreviations: HbA1c, hemoglobin a1c; LDL, low density lipoprotein.
Greater comorbidity index scores indicate greater comorbidity; greater social vulnerability index scores indicate greater risk.
In the year prior to the first transportation barrier assessment, mean HbA1c was 7.63% (SD = 1.93%). In testing the “prevention strategy,” we estimated that had no participants experienced a transportation barrier, the mean HbA1c would have been 7.58% (95% confidence interval [CI]: 7.57% to 7.60%) at 12 months. Had all participants experienced a transportation barrier, we estimated that mean HbA1c would have been 7.68% (95% CI = 7.63% to 7.72%) at 12 months. This translates to an estimated mean difference of −0.09% (95% CI = −0.14% to −0.04, P = .0002; Table 2 and Supplemental eTable 3). The differences were similar in magnitude at other studied timepoints (Figure 1). The observed HbA1c standard deviation at 12 months (1.93%) implies that an actual trial would need to have a sample size of 11 696 (n = 5848 per arm) to have 80% or greater power to detect a difference of this magnitude or greater at α = .05.
Estimated Differences in Means Under the “Prevention” Strategy.

Abbreviations: CI, confidence interval; LDL, low density lipoprotein.
Estimated difference in mean compares the estimated difference in the outcomes between counterfactual scenarios in which individuals did not versus did experience transportation barriers from the time of first assessment to the specified time point. A negative value indicates estimated benefit for preventing transportation barriers. The differences in means were estimated using a longitudinal targeted minimum loss estimation approach.
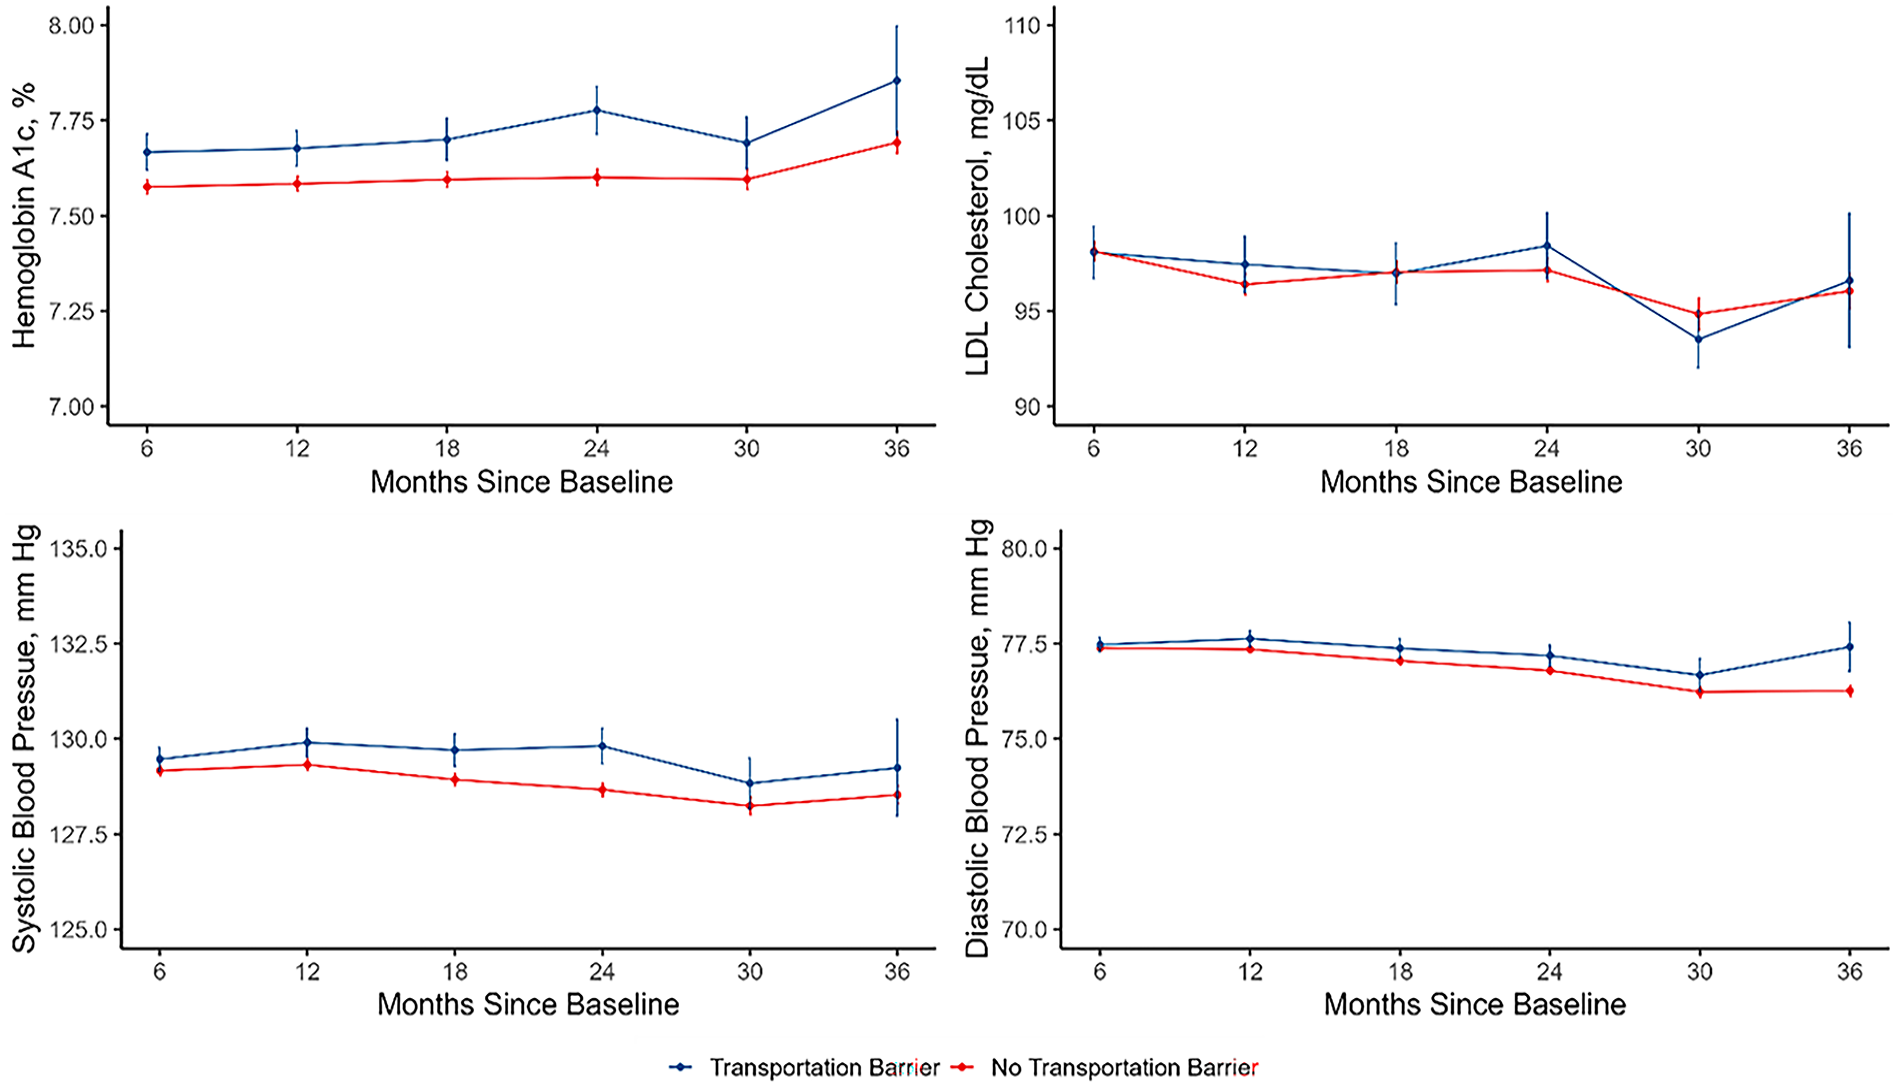
Estimated levels of hemoglobin A1c, systolic and diastolic blood pressure, and low-density lipoprotein (LDL) cholesterol in the scenarios in which individuals did not and did experience transportation barriers.
In testing the “prevention strategy” for SBP we estimated that, had no participants experienced a transportation barrier, the mean SBP would have been 129.3 mm Hg (95% Confidence Interval [CI]: 129.2 to 129.5) at 12 months. Had all participants experienced a transportation barrier, we estimate that the mean SBP would have been 129.9 mm Hg (95% CI = 129.5 to 130.3) at 12 months. The estimated mean difference between the 2 scenarios at 12 months was −0.6 mm Hg (95% CI = −1.0 mm Hg to −0.2 mm Hg, P = .004). The difference was similar at other studied timepoints, except for 30 and 36 months.
In testing the “prevention strategy” for DBP, we estimated that had no participants experienced a transportation barrier, mean DBP would have been 77.4 mm Hg (95% Confidence Interval [CI]: 77.3 to 77.4) at 12 months. Had all participants experienced a transportation barrier, we estimate that mean DBP would have been 77.6 mm Hg (95% CI = 77.4 to 77.8) at 12 months. The estimated mean difference between the 2 scenarios at 12 months was −0.3 mm Hg (95% CI = −0.5 mm Hg to −0.1 mm Hg, P = .02). The difference was similar in magnitude at other studied timepoints.
In testing the “prevention strategy” for LDL, we estimated that had no participants experienced a transportation barrier, mean LDL would have been 96.4 mg/dL (95% Confidence Interval [CI]: 95.9 to 97.0) at 12 months while had all participants experienced a transportation barrier, we estimate that mean LDL would have been 97.5 mg/dL (95%CI: 96.0 to 98.9) at 12 months. The estimated mean difference between the 2 scenarios at 12 months was −1.1 mg/dL (95% CI = −2.6 mg/dL to 0.5 mg/dL, P = .19). There were no meaningful differences at other studied timepoints.
Results for the HbA1c, SBP, DBP, and LDL outcomes from analyses that used the SuperLearner estimation approach were similar to results using generalized linear models alone (Supplemental eTable 4).
Estimates from testing the “treatment strategy” (Table 3 and Supplemental eTable 5) were similar in magnitude to results from the “prevention strategy,” but estimates were less precise given the smaller sample size of this subcohort.
Estimated Difference in Means Under the “Treatment” Strategy at 12 months.

Abbreviations: CI, confidence interval; LDL, low density lipoprotein.
Estimated difference in mean compares the estimated difference in the outcomes between counterfactual scenarios in which individuals who reported a transportation barrier did not versus did experience transportation barriers from the time of subsequent assessment to 12 months later. A negative value indicates estimated benefit for “treating” transportation barriers. The differences in means were estimated using a longitudinal targeted minimum loss estimation approach.
Discussion
In this observational study of adults with T2DM seen in community-based health centers, we estimated that preventing transportation barriers would be associated with lower HbA1c and blood pressure levels that can be distinguished statistically, but the magnitude of those differences was small and not clinically meaningful. We found little difference in LDL cholesterol. Similarly, we did not estimate that “treating” transportation barriers once they occurred would be associated with clinically meaningful differences HbA1c and blood pressure levels. There was little change in the estimated outcome differences between experiencing versus not experiencing transportation barriers over time, with differences becoming apparent within 12 months and remaining fairly stable thereafter. RCTs involving such interventions would likely need relatively large sample sizes to detect differences of the magnitude estimated here.
These findings contribute to the body of literature regarding transportation barriers and health outcomes.1,12,13A number of cross-sectional studies found associations between transportation barriers and adverse health outcomes.1,12,13 As guideline-recommended T2DM care involves frequent clinic visits, 11 it is plausible that transportation barriers may be associated with worse T2DM outcomes. However, the findings of this study do not suggest that clinically meaningful improvements in diabetes outcomes are likely to occur from addressing transportation barriers alone. The difference between prior findings and those of this study may be related to looking at different outcomes, or the longitudinal design used in this study, which may better account for confounding.
This study has several implications, though caution should be taken in interpreting these observational findings. First, the association between transportation barriers and worse T2DM outcomes provides support for ongoing efforts to address transportation barriers as important health-related social needs. However, the relatively small magnitude of the estimated differences suggests that transportation may be an “enabling” factor that supports T2DM management but that addressing transportation barriers alone is unlikely to be sufficient to improve outcomes substantially. Thus, multi-modal interventions that focus on addressing transportation barriers along with other aspects of T2DM management, such as education and lifestyle programs, self-management activities, and medication adjustment, may be needed to help maximize intervention impact. 36
Second, the findings support testing actual interventions for improvements in T2DM outcomes, a needed future direction for this line of inquiry. Such interventions might attempt to address transportation barriers through providing transportation directly, subsidizing transportation costs, or offering vehicle repair services. Notably, non-emergency medical transportation is a covered benefit for Medicaid beneficiaries, though some reports show that these programs can be difficult to use. 37 This benefit, however, may serve as a starting point for financing for such interventions (at least among Medicaid beneficiaries). Alternatively, given the rise of virtual care, remote care options may usefully overcome some impacts of transportation barriers on healthcare even if transportation is not provided.
These findings should be interpreted in light of several limitations. This was an observational study, with no guarantee that the assumptions needed for causal inference hold. Though we used an appropriate study design, a rich longitudinal dataset, and accounted for key time-fixed and time-varying confounders, unmeasured confounding could still bias the results. Second, the study period did include the height of the COVID-19 public health emergency, which disrupted care for many. 38 These disruptions, coupled with the rise of virtual care during this period, may have lessened differences between those who did versus did not experience transportation barriers. Next, we did not have access to data on non-attendance of scheduled clinic visits. Additionally, transportation barrier screening is self-reported, typically with a 12-month lookback period. There could be recall or social desirability bias in these assessments. Further, we do not have information about what, if any, additional information clinic staff obtained after a positive response. These limitations are balanced by several strengths, however, including the use of a large and geographically diverse sample of participants followed for relatively long time periods.
Conclusions
In this observational study, we estimated that addressing transportation barriers may be associated with slightly lower HbA1c and blood pressure, but the magnitude of these differences were small and are unlikely to be clinically meaningful. Transportation barriers are important health-related social needs, but interventions testing ways to improve diabetes outcomes may need to address factors in addition to transportation barriers to meaningfully improve T2DM outcomes.
Supplemental Material
sj-docx-1-jpc-10.1177_21501319251320709 – Supplemental material for Transportation Barriers and Diabetes Outcomes: A Longitudinal Analysis
Supplemental material, sj-docx-1-jpc-10.1177_21501319251320709 for Transportation Barriers and Diabetes Outcomes: A Longitudinal Analysis by Seth A. Berkowitz, Aileen Ochoa, Myklynn LaPoint, Marlena L. Kuhn, Jenine Dankovchik, Jenna M. Donovan, Mufeng Gao, Sanjay Basu, Michael G. Hudgens and Rachel Gold in Journal of Primary Care & Community Health
Footnotes
Acknowledgements
We wish to thank Suzanne Morrissey for project administration. She was compensated through grant R01DK125406 for her efforts.
Author Contributions
SAB made substantial contributions to the conception and design of the study and the acquisition, analysis, and interpretation of data for the study, and drafted the manuscript. RG made substantial contributions to the conception and design of the study and the acquisition, analysis, and interpretation of data for the study, and revised the manuscript. MAL and SB made substantial contributions to the interpretation of data for the manuscript and reviewed the manuscript critically for important intellectual content. MGH, MLK, and MG contributed to the analysis and interpretation of the data and reviewed the manuscript. AO, JMD, JDD, and JM designed and built the datasets, contributed to the conceptual understanding of the underlying EHR data, and reviewed the manuscript the manuscript critically for important intellectual content.
Declaration of Conflicting Interests
The author(s) declared the following potential conflicts of interest with respect to the research, authorship, and/or publication of this article: SAB reports research grants from NIH, North Carolina Department of Health and Human Services, Blue Cross Blue Shield of North Carolina, Feeding America, the American Diabetes Association, and the American Heart Association, and personal fees from the Aspen Institute, Rockefeller Foundation, Gretchen Swanson Center for Nutrition, and Kaiser Permanente, outside of the submitted work. ML reports research grant support from North Carolina Department of Health and Human Services. All other authors declare nothing to report.
Funding
The author(s) disclosed receipt of the following financial support for the research, authorship, and/or publication of this article: This work was funded in part by R01DK125406. The content is solely the responsibility of the authors and does not necessarily represent the official views of the National Institutes of Health. SB was supported by the National Institutes of Health (Grant Nos. 2P30 DK092924 and R01DK116852) and the Centers for Disease Control and Prevention (Grant No. U18DP006526). The research reported in this work was powered by PCORnet®. PCORnet® has been developed with funding from the Patient-Centered Outcomes Research Institute® (PCORI®) and conducted with the Accelerating Data Value Across a National Community Health Center Network (ADVANCE) Clinical Research Network (CRN). ADVANCE is a Clinical Research Network in PCORnet® led by OCHIN in partnership with Health Choice Network, Fenway Health, University of Washington, and Oregon Health & Science University. ADVANCE’s participation in PCORnet® is funded through the PCORI Award RI-OCHIN-01-MC.
Role of the Funder
The funding organizations had no role in the design and conduct of the study; collection, management, analysis, and interpretation of the data; preparation, review, or approval of the manuscript; and decision to submit the manuscript for publication.
Guarantor
SAB is the guarantor of this work and, as such, had full access to all the data in the study and takes responsibility for the integrity of the data and the accuracy of the data analysis.
Prior Presentation
None.
Supplemental Material
Supplemental material for this article is available online.
References
Supplementary Material
Please find the following supplemental material available below.
For Open Access articles published under a Creative Commons License, all supplemental material carries the same license as the article it is associated with.
For non-Open Access articles published, all supplemental material carries a non-exclusive license, and permission requests for re-use of supplemental material or any part of supplemental material shall be sent directly to the copyright owner as specified in the copyright notice associated with the article.