
Abstract
Objective:
This study explores the associations between various sleep durations and metabolic health indices, including systolic blood pressure (SBP), diastolic blood pressure (DBP), total cholesterol levels, high-density lipoprotein (HDL) cholesterol, and waist circumference.
Methods:
Data from the National Health and Nutrition Examination Survey (NHANES) 2021 to 2023, were analyzed. MANOVA and Bonferroni-adjusted ANOVAs were conducted to examine the relationships between sleep duration (sleep deprivation (≤5 h), short sleep (5-7 h), recommended sleep (7-9 h), and long sleep (>9 h)) and metabolic health indices.
Results:
MANOVA revealed significant group differences between sleep duration and metabolic health indices, with Wilks’ Lambda (Λ) = .98, F (3, 5095) = 4.26, P < .001. Compared to recommended sleep duration, both sleep deprivation and short sleep were associated with higher DBP (Ps < .01) and waist circumference (Ps < .001), and lower HDL levels (Ps < .05) Long sleep was associated with lower HDL levels (P < .01) and lower total cholesterol (P < .01).
Conclusion:
The study highlights the detrimental associations of both sleep deprivation and short sleep with metabolic health, such as elevated blood pressure and waist circumference, and lowered HDL cholesterol. Long sleep may also negatively impact metabolic health by reducing HDL.
Introduction
Metabolic syndrome (MetS), co-occurrence with hypertension, and high-density lipoprotein (HDL) cholesterol could lead to adverse cardiovascular events1,2 and cancer. 3 MetS has affected 20% to 45% of the population worldwide and is projected to be approximately 53% by 2035. 4 Furthermore, it has created a significant financial burden on patients and the healthcare system, 5 so understanding the risk factors for MetS became crucial. 6
Insufficient sleep duration is one of the potential risk factors for MetS. A shortened delta-wave sleep period suppresses the secretion of hormones, 7 such as growth hormone (GH) 8 and GH-releasing hormone (GHRH), 7 which are associated with metabolic reactions, such as fat burning, which could result in disturbing metabolic functioning. 9 Chronic short sleep durations increased the secretion of advanced glycation end products (AGEs), 10 the lipoproteins that are glycated in degenerative diseases such as atherosclerosis and diabetes mellitus. 11 Furthermore, insufficient sleep is also associated with elevated sympathetic activity and pro-inflammatory cytokines, resulting in insulin resistance. 12 After 1 night of insufficient sleep, extracellular β-amyloid plaques, which are involved in brain cell communication, and intracellular tau neurofibrillary tangles, which play a role in stabilizing structures within brain cells (neurons) and microtubules, accumulated in brain tissue,13 -17 potentially leading to the disruption of mitochondrial function.13,18 In addition, the glymphatic system, which is responsible for β amyloid protein and abnormal tau clearance,19 -21 is impaired by insufficient sleep.22 -24 The effects of insufficient sleep duration on physiological mechanisms potentially exacerbate metabolic health.
Besides short sleep duration, long sleep duration is also found to have potential negative effects on metabolic health. Several studies have indicated a U-shaped association, indicating both short and long sleep duration increased metabolic syndrome risks. 25 One meta-analysis, including 11 cross-sectional studies and 3 cohort studies, also indicated the U-shape association. 26 Another meta-analysis by Xie et al 27 also identified a U-shaped relationship in cross-sectional studies, where individuals with either short (<5 h) or long (>9 h) sleep durations exhibited a higher risk of prevalent MetS compared to those with a normal sleep duration of 7 to 8 h. Similarly, Wang et al 28 reported a U-shaped association between sleep duration and hypertension.
However, the results are not consistent across studies. Several meta-analyses indicated only short sleep duration, but not long sleep, is associated with MetS.27,29,30 Amid the mixed results, this study tends to explore the associations between various sleep durations and metabolic health. Different from previous studies on MetS, which mainly particular syndromes such as hypertension and insulin resistance, this study focuses on underlying metabolic health indices, including blood pressure (systolic blood pressure and diastolic blood pressure), cholesterol levels (total cholesterol and HDL), and waist circumference.
Methods
Study Participants
This study used the National Health and Nutrition Examination Survey (NHANES) 2021 to 2023 dataset, conducted by the National Center for Health Statistics (NCHS). A multistage probability sampling design was applied to assess the health conditions among U.S. populations. 31 The NHANES 2021 to 2023 is the first NHANES data collected since the COVID-19 pandemic with the response rates of 34.6% and 25.7% for interview and examination, respectively. 31 A total of 8153 adults (age ≥18 years) were included in the NHANES 2021 to 2023 dataset. Following the previous study on similar subjects, 32 missing data and outliers are excluded in this study.
Measures
Metabolic health
Three of the commonly used measurements for metabolic health were included in the study: blood pressure, cholesterol level, and waist circumference. 33 In the NHANES 2021 to 2023 dataset, blood pressure, including systolic blood pressure (SBP) and diastolic blood pressure (DBP), was measured 3 times by Oscillo metric readings. In the dataset, 3 specifications were used for capturing the blood pressure (BP) data: (1) SBP no greater than 300 mmHg and must be greater than DBP; (2) If there is no SBP, there can be no DBP; however, there can be a systolic measurement without a diastolic measurement. In this study, an average of the 3 Oscillo metric readings was calculated and used for analysis. Two cholesterol-related variables were included in this study: the total cholesterol level and the high-density lipoprotein level (HDL). Total cholesterol is measured by an enzymatic assay through various enzymatic reactions to convert cholesterol to a measurable colored product under 505 nm. HDL was measured by HDLC4 assay, in which non-HDL lipoproteins were combined and formed as a water-soluble complex that blocks the enzymatic reaction of cholesterol esterase (CHER) and cholesterol oxidase (CHOD). Therefore, only HDL particles were able to react with CHER and CHOD. Both total cholesterol level and HDL level were reported in the unit of mg/dL. Waist circumference is recorded in the unit of centimeters (cm) in the dataset.
Sleep duration
Sleep duration was collected by asking the number of hours usually spent on weekdays or workdays. Following the guidance of the American Academy of Sleep Medicine 34 and previous studies,35,36 sleep duration was categorized into 4 duration groups: sleep deprivation (≤5 h) short sleep (5-7 h), recommended sleep (7-9 h; reference group), and long sleep (>9 h).
Covariates
Demographic variables were adjusted in the analysis; Age (years old), sex (male and female), and race/ethnicity (White, Mexican Americans, Other Hispanics, Black Americans, and Other/multiple).
Statistical Analysis
The pattern of missing data is checked by using missing completely at random (MCAR). Outliers were checked by Leverage test, Student test, and Cook’s Distance. Univariate normality was checked by descriptive statistics of kurtosis and skewness. The Doornik-Hansen test was used for checking multivariate normality checking. The homogeneity of the variance/covariance matrix was tested by Levene’s test. To ensure the statistical power, a power-analysis was performed to determine the adequacy of simple size. As the purpose of the research is to examine group differences (various sleep durations) on multiple outcome variables (metabolic health indicators), for macro-level analysis, multivariate analysis of variance (MANOVA) was adopted to examine the associations of different sleep durations with the composite outcome variable, metabolic health. For mid-level analysis, Bonferroni-adjusted analysis of variance (ANOVA), with an adjusted P-value cutoff of .0125, was conducted to examine the relationships between sleep durations and each outcome variable. Among variables with mid-level statistically significant indices, the simple group contrasts with recommended sleep duration as the reference group was conducted at the micro-level. All analyses were performed using the statistical software STATA 18 (Stata Corporation, College Station, TX, USA), and the significance level was set at P < .05.
Results
The significant MCAR test indicated that the data was not missing completely at random and data with a violation of any of the 3 outliers’ tests (Leverage test, Student test, and Cook’s Distance) is considered outliers. In this study, missing data (n = 2842) and outliers (n = 206) were excluded; a total of 5105 participants were included for analysis. A power analysis in G*Power indicated an adequate power to detect group differences with the sample size N = 5105 in this study. The insignificant Levene’s test indicated the homogeneity of the variance/covariance matrix (besides DBP, Ps > .05). A significant Doornik-Hansen test indicated a violation of multivariate normality (Ps < .05). Further tests of normality for individual dependent variables showed acceptable normality. After these assumptions were checked to ensure the validity of the statistical analyses, the present study conducted the formal MANOVA analysis.
Among the 5105 participants, 54% were females (n = 2758) and 46% were males (n = 2347). The participants have an average age of 52 years old (±18.06). White was the largest racial group included in the dataset (60%), followed by Blacks and other Hispanics (11%), Mexican Americans (7%), and other races (12%). Black Americans had the highest percentage of sleep deprivation (6%) and the lowest percentage in having recommended sleep duration (55%), whereas White Americans had the highest percentage in recommended sleep duration (72%) and the lowest percentage of sleep deprivation (2%). See Table 1 for full demographic information of participants.
Demographic Information Across Sleep Durations.
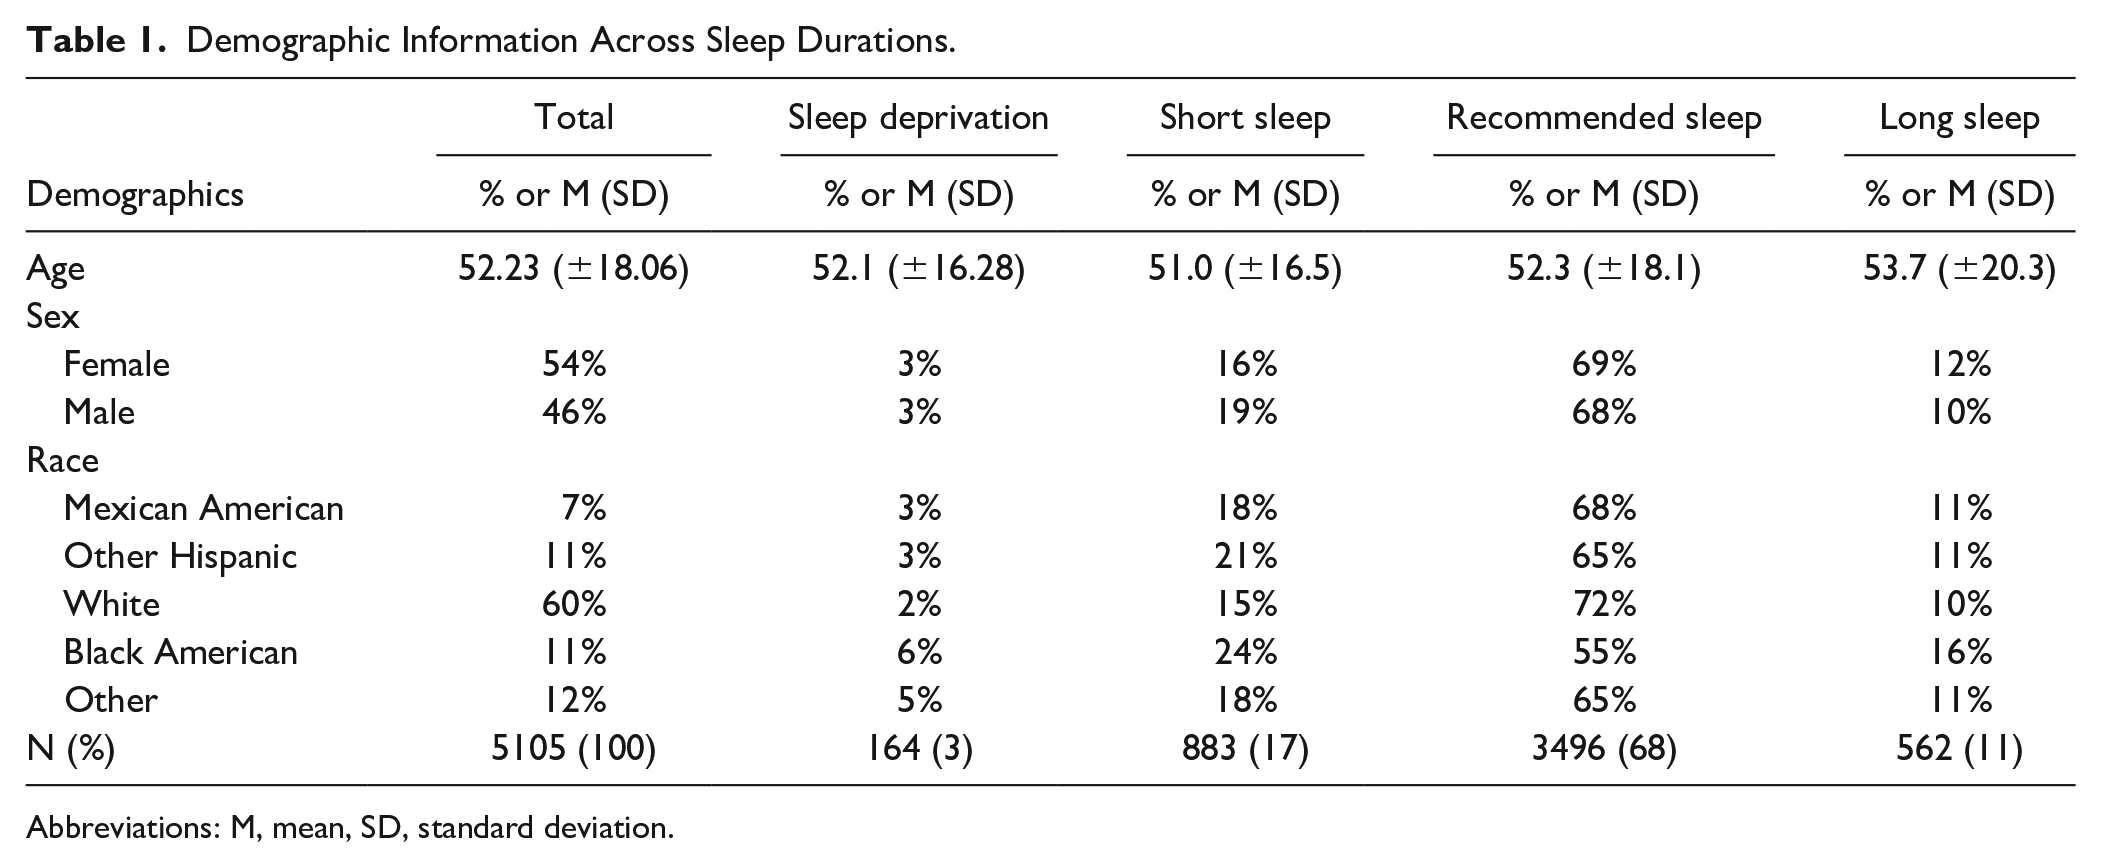
Abbreviations: M, mean, SD, standard deviation.
Individuals with sleep deprivation exhibited the highest SBP (122.94 mmHg) and DBP (76.15 mmHg), while those with long sleep had the lowest SBP (121.55 mmHg) and DBP (73.22 mmHg). Males tended to have higher SBP (123.63 mmHg) and waist circumference (102.51 cm) than females, who had higher HDL levels (57.90 mg/dL vs 49.07 mg/dL) and total cholesterol (190.07 mg/dL vs 180.49 mg/dL). Black Americans showed the highest SBP (123.39 mmHg) and moderate cholesterol levels (176.90 mg/dL), while White individuals exhibited the highest total cholesterol (187.17 mg/dL) and lower HDL (54.66 mg/dL). Mexican Americans and other Hispanic groups had similar health metrics, though Mexican Americans indicated slightly higher HDL levels (50.26 mg/dL vs 52.00 mg/dL), and the other race had lower HDL levels (53.31 mg/dL) and waist circumference (95.10 cm). See Table 2 for full descriptive statistics of outcome variables (eg, SBP, DBP, Total Cholesterol, HDL, and Waist circumference).
Descriptive Statistics of Outcome Variables.

Abbreviations: M, mean, SD, standard deviation.
A 1-way MANOVA and follow-up Bonferroni-adjusted ANOVAs were conducted to examine the associations among sleep durations and metabolic health indices. The MANOVA results indicated significant differences among various sleep durations in the composite outcome variable metabolic health. Wilks’ Lambda (Λ) = .98, F (3, 5095) = 4.26, P < .05, indicating that 2% of variances in the combined metabolic health variable can be explained by sleep duration. In addition, age, sex, and race/ethnicity significantly contributed to the variances in metabolic health to different degrees See Table 3 for one-way MANOVA and follow-up test.
MANOVA Outcomes Among Sleep Durations and Metabolic Health Indices.
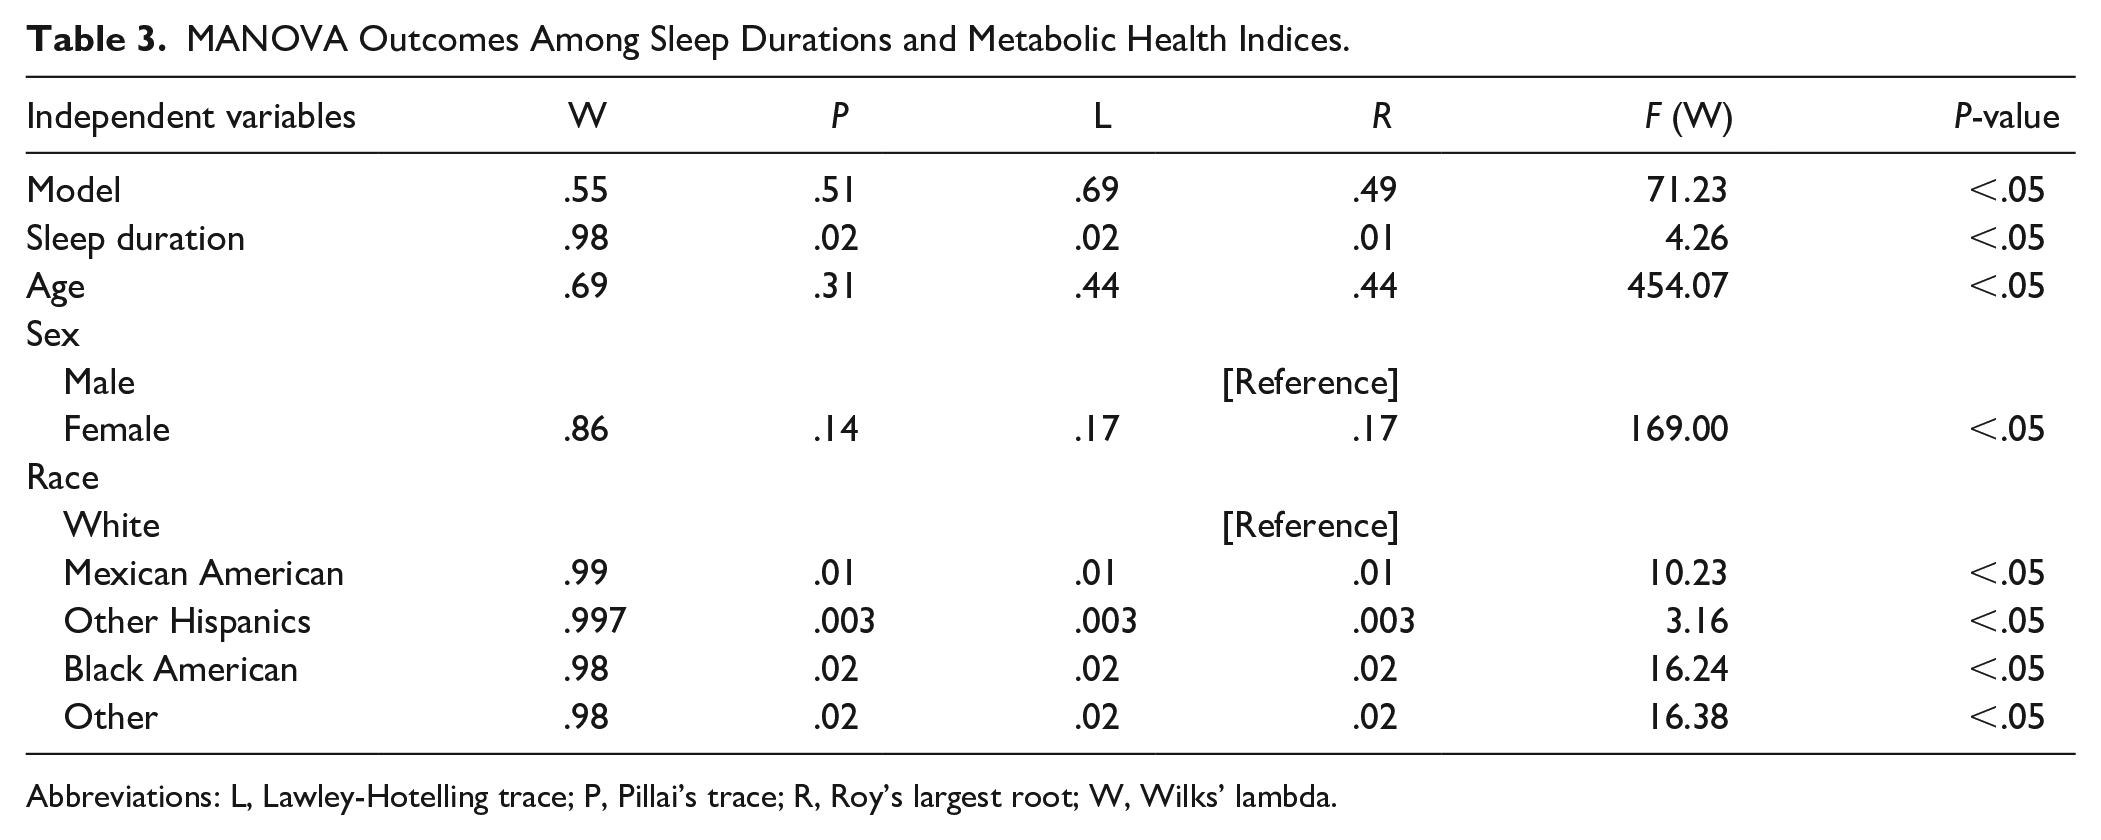
Abbreviations: L, Lawley-Hotelling trace; P, Pillai’s trace; R, Roy’s largest root; W, Wilks’ lambda.
At the mid-level, the Bonferroni-adjusted ANOVAs indicated that there are significant differences in DBP (F (3, 5095) = 6.27, P < .01), total cholesterol F (3, 5095) = 4.59, P < .01), HDL (F (3, 5095) = 4.91, P < .01), and waist circumference (F (3, 5095) = 12.05, P < .01) across different sleep duration groups. See Table 4 for Bonferroni-adjusted ANOVAs.
Mid-level ANOVAs Between Sleep Duration and Outcome Variables.
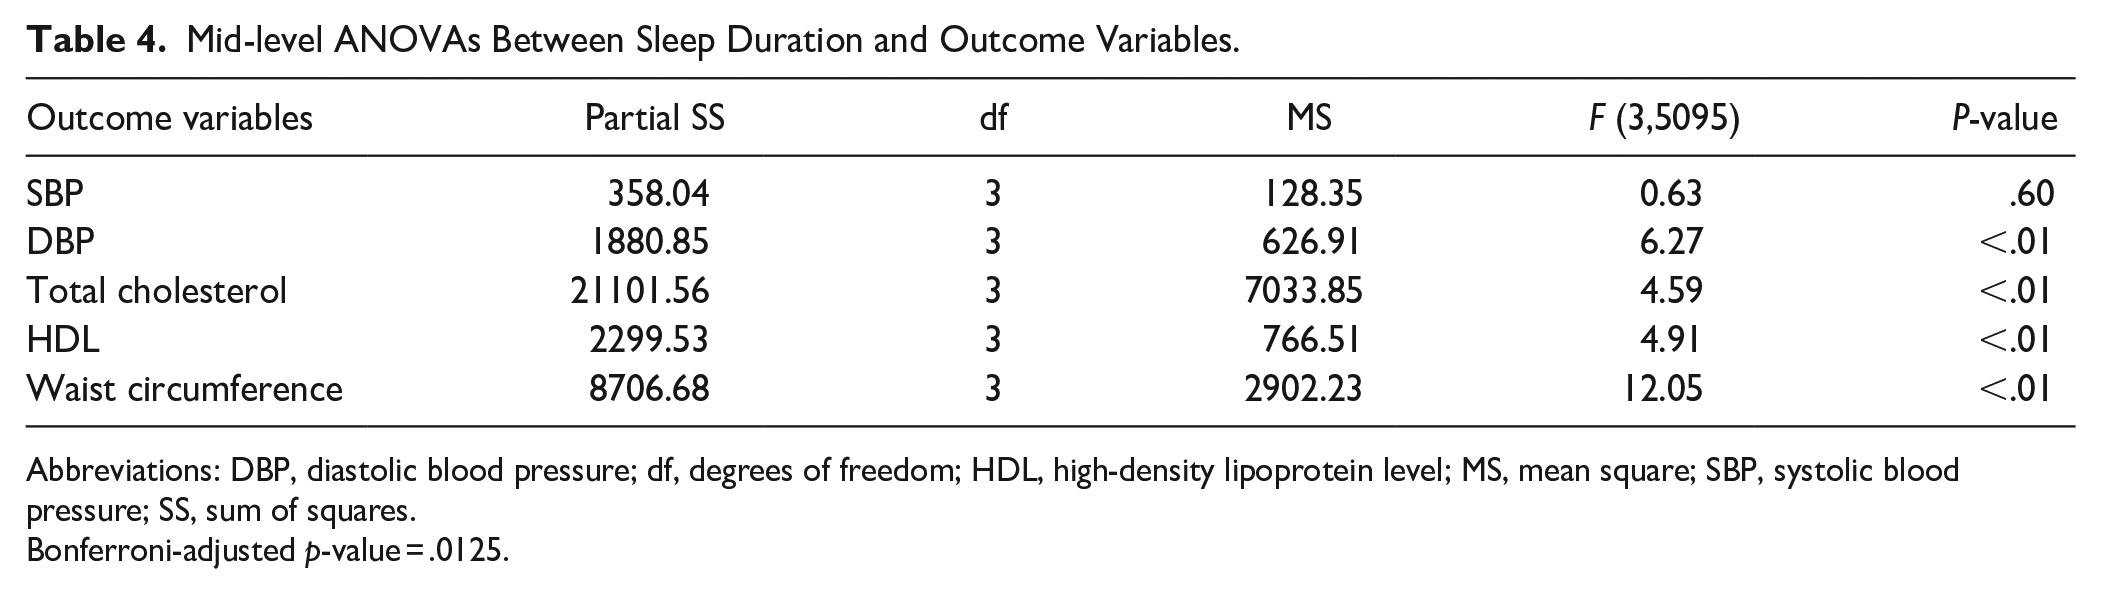
Abbreviations: DBP, diastolic blood pressure; df, degrees of freedom; HDL, high-density lipoprotein level; MS, mean square; SBP, systolic blood pressure; SS, sum of squares.
Bonferroni-adjusted p-value = .0125.
At the micro-level, the group contrasts showed that compared to the recommended sleep duration, people with sleep deprivation had significantly higher levels of DBP by 2.29 mmHg and waist circumference by 4.61 cm and a lower level of HDL by 2.52 mg/dL; people with short sleep duration had significantly higher levels of DBP by 1.12 mmHg and waist circumference by 2.98 cm and a lower level of HDL by 1.28 mg/dL; at last, people with long sleep duration had lower levels of HDL by 1.20 mg/dL and total cholesterol by 6.06 mg/dL. See Table 5 for a comparison among groups at the micro-level.
Micro-level Group Comparison.

Abbreviations: DBP, diastolic blood pressure; HDL, high-density lipoprotein level; S.E., standard error.
Recommended sleep (7-9 h/day; the reference group), Sleep deprivation (≤5 h/day), Short sleep (5-7 h/day), Long sleep (>9 h/day).
Discussion
Amidst the mixed results in the literature examination the associations between sleep and metabolic syndromes, this study further explored the association between various sleep durations (eg, sleep deprivation, short sleep, recommended sleep, and long sleep) and various underling metabolic health indices, including blood pressure (systolic blood pressure and diastolic blood pressure), cholesterol levels (total cholesterol and HDL), and waist circumference. In addition, the mean differences in various metabolic health indices between different sleep durations and recommended sleep duration were analyzed and presented to illustrate quantitative variances of effect among different sleep durations. Furthermore, this study used the newest NHANES 2021 to 2023 dataset, representing the American civilian noninstitutionalized population that allows for generalization. Overall, the findings of this study indicated that compared to the recommended sleep duration (7-9 h/day), both short sleep duration and long sleep duration have various associations with metabolic health indices.
Blood Pressure
This study revealed that both sleep deprivation (eg, ≤ 5 h/day) and short sleep (eg, 5-7 h/day) were associated with higher DBP, compared to recommended sleep duration (eg, 7-9 h/day). The finding is aligned with previous studies, which indicated the association between sleep duration and elevated blood pressure.37,38 According to the American Heart Association, self-reported short sleep duration with various cutoffs from 5 to 7 h was associated with hypertension. 37 However, different from previous research, this study did not find associations between sleep duration and SBP; whereas a previous study indicated that compared to sleep duration >7 h, people with sleep duration <7 h had a higher mean SBP by 4.7 mmHg. 39 The discrepancy could potentially be the differences in the measurement of blood pressure. In the previous study, 38 the significant association between sleep duration and SBP was found when blood pressure was measured by using 24-h ambulatory blood pressure monitoring (ABPM). However, in this study, blood pressure was measured under an office setting. Comparing to ABPM, the association between office-SBP and sleep duration was less robust, where no significant association was found between office-SBP and sleep duration in the same study. 39
The potential mechanism between short sleep and blood pressure could be the disturbance of the automatic system. Short sleep duration has been indicated to have lower levels of parasympathetic activity and higher levels of sympathetic activity, which are associated with increased blood pressure.40 -42 In addition, short sleep was also related to elevated inflammation and oxidative stress that could potentially lead to endothelium dysfunction, 43 which leads to high blood pressure. Lastly, the short sleep-associated psychological conditions, such as depression and anxiety, were also relevant to elevated blood pressure. 44
Cholesterol Levels
This study revealed that compared to recommended sleep duration, sleep deprivation, short sleep, and long sleep are associated with lower levels of HDL. The findings aligned with previous studies. Two Asian studies, conducted by using a national dataset, indicated a U-shaped (under 5 h and over 9 h/day) association between sleep duration and low HDL.45,46 Previous studies have also demonstrated the short sleep and long sleep separately, in which both short sleep duration47 -49 and long sleep50,51 were associated with low HDL. Additionally, aligned with a previous study, 45 long sleep duration is also associated with lowered total cholesterol level.
Waist Circumference
Sleep deprivation and short sleep duration were associated with a larger waist circumference, compared to recommended sleep duration. The finding is aligned with previous studies.52,53 A meta-analysis, with the inclusion of 22 studies and 56 259 participants, also revealed that short sleep duration, not long sleep, was associated with increased waist circumference. 53 The potential mechanisms are multifaceted. Hormonally, leptin and ghrelin regulate appetite and energy intake, whereas leptin decreases appetite and ghrelin increases it. Short sleep duration was associated with decreased leptin levels and increased ghrelin levels.54 -58 In fact, some studies have indicated that short sleep is associated with increased appetite and food intake.37,59 Furthermore, short sleep was also associated with decreased physical activity, which decreases the total energy expenditure. 55 The increased energy intake and decreased energy expenditure could lead to elevated measure of waist circumference among people with sleep deprivation and short sleep duration in this study.
Limitations
There are several limitations in this study. First, this study used cross-sectional data, which could only provide directionality of associations, rather than causations, which means the suggested predictors could either be the causation or the outcome. Secondly, missing data occurred in the outcome measurements. The people who were willing to have their bodies examined during the national survey process might be more likely to care about their overall health. Therefore, it might potentially be embedded with sample bias. Furthermore, it is possible that the findings may be discounted by Neyman bias considering the missing rate. Future research is needed to support the results from this study. Lastly, sleep duration was asked based on self-report to a single question, which may introduce bias in the findings.60,61
Conclusions
This study adds to the literature showing that different sleep durations have different associations with different metabolic health indices. Compared to recommended sleep duration, both sleep deprivation and short sleep duration are associated with higher DBP, larger waist circumference, and lower HDL level, whereas long sleep duration is associated with lower HDL and lower total cholesterol levels. The findings of this study help the community better understand the nuanced associations between sleep duration and various metabolic health indices. Future studies using longitudinal study design could provide potential causational relationships between sleep duration and metabolic health.
Footnotes
Acknowledgements
Not applicable. There is no additional acknowledgment.
Declaration of Conflicting Interests
The author(s) declared no potential conflicts of interest with respect to the research, authorship, and/or publication of this article.
Funding
The author(s) received no financial support for the research, authorship, and/or publication of this article.
Ethical Approval and Informed Consent Statements
This study used public data downloaded from the Centers for Disease Control and Prevention website. The National Center for Health Statistics Research Ethics Review Board and the Centers for Disease Control and Prevention approved the research protocol.
Data Availability Statement
The data is publicly available on the CDC website. https://wwwn.cdc.gov/nchs/nhanes/search/datapage.aspx?Component=Examination&Cycle=2021-2023.