
Abstract
Context:
Diabetes poses a significant threat to public health in the United States, with an estimated total prevalence of 37.3 million individuals in 2019, of which 28.7 million were diagnosed and 8.5 million remained undiagnosed. The high prevalence of diabetes imposes a considerable economic burden on the U.S. healthcare system. Appalachian Ohio is disproportionately impacted with southeastern Ohio exhibiting a diabetes prevalence that exceeds the national average by more than twofold and a critical shortage of healthcare providers.
Objective:
To quantify the associations between diabetes prevalence and incidence in Ohio counties, considering various factors that impact health and quality-of-life outcomes.
Methods:
The data used in this study were obtained from the United States Diabetes Surveillance System (USDSS) on the 88 counties in Ohio. Pearson correlation tests were employed to investigate the relationship between diabetes (prevalence and incidence) and social determinants of health. A t-test and multivariate analysis of variance (MANOVA) test were performed to analyze the disparities in diabetes and social determinants between Appalachian and non-Appalachian counties.
Results:
The results of this study demonstrate notable disparities in diabetes prevalence between Appalachian and non-Appalachian counties (P < .001, α = .05). Furthermore, the MANOVA test revealed significant differences between these 2 groups regarding social determinants of health (P < .05).
Conclusion:
These findings suggest that Appalachian counties may face a disproportionate impact from health-related factors and experience limited access to healthcare services. The data highlight the need for focused efforts to address the specific challenges faced by Appalachian counties. Improving access to healthcare services in the Appalachian region is paramount to ensure equitable healthcare and enhance the overall health outcomes of affected communities.
Introduction
Diabetes poses a significant threat to public health in the United States, with an estimated total prevalence of 37.3 million individuals in 2019, of which 28.7 million were diagnosed and 8.5 million remained undiagnosed. 1 The incidence for the same year was estimated to be 1.4 million new cases—a rate of 5.9 per 1000 persons. 1 The complexity of diagnosing diabetes arises from the presence of multisystemic complaints across various age groups, thereby increasing the estimated true prevalence of diabetes with undiagnosed cases. 2
The high prevalence of diabetes not only imposes a considerable economic burden on the U.S. healthcare system but also stands as the leading cause of kidney failure, lower-limb amputations, and adult blindness.1,3 Moreover, individuals with type 2 diabetes mellitus (DM) face an increased mortality risk from cardiovascular disease (CVD) and hypertension.4,5 The toll of co-occurring diseases can also negatively impact self-management behaviors and worsen the effects of diabetes. 6
Among the regions heavily affected by diabetes, Appalachian Ohio stands out, with southeastern Appalachian Ohio exhibiting a diabetes prevalence that exceeds the national average by more than twofold and a critical shortage of healthcare providers.7,8 Studies have found the self-reported prevalence of diabetes (11.3%) was markedly higher in Appalachian Ohio counties surveyed compared to aggregate Ohio (7.8%) or national (7.2%). 9
Various factors exacerbate the impact of diabetes in this region, including challenges in rural healthcare provision, limited resources, non-adherence to recommendations, cultural influences that normalize diabetes and food culture, and collaborative care that lacks accessible resources and patient motivation. 10 Depression and poor mental health, both of which are recognized as comorbidities of diabetes, have been associated with worsening adherence to self-management behaviors. 11 Furthermore, the number of primary care physicians, mental health providers, and specialty physicians per 100 000 people are 12%, 35%, and 28% lower than national averages, respectively. 12 Rural areas are also more likely to report access to good doctors and hospitals is a major problem in their community. 13 Thus, patients in the Appalachia region might face challenges in accessing sufficient healthcare services as a result of their socioeconomic status or geographical circumstances.
In addition, rates of preventable hospitalizations and Medicare spending in Appalachia surpass national averages. 14 Hospitalization rates for heart disease in Appalachia is 17% higher than the national average. 12 Another study found significant differences between the perceptions of access to care and satisfaction with healthcare services among Appalachian and non-Appalachian residents. 15 The use of stigmatizing language from health care providers has a negative impact on the quality of care provided to individuals living with diabetes. 16
Providers have identified significant comorbid psychosocial issues, such as high rates of depression, anxiety, incest, abuse, and post-traumatic stress disorder, among individuals with diabetes in this region.8,17 Adults in southeastern Ohio experience high levels of diabetes distress and co-occurring clinically significant depressive symptoms, which contribute to less self-care behaviors. 18
Previous research has explored the relationship between diabetes risk factors, such as obesity and the presence of food deserts, highlighting the correlation between the accessibility of supermarkets and club stores and the prevalence of obesity. 19 Other studies have demonstrated social determinants can potentially hinder diabetes care, including barriers related to access to healthcare providers, transportation, food, housing, and financial security.8,20
Expanding on these existing studies, the present research aims to investigate the social determinants of health and their influence on the prevalence and incidence of diabetes in Appalachian Ohio. This study seeks to quantify the associations between diabetes prevalence and incidence in Ohio counties, taking into account various factors that impact health and quality-of-life outcomes. Analyzing this data offers valuable insights into the determinants that influence the prevalence of diabetes. The hypothesis of this project postulates that Appalachian counties will exhibit higher rates of diabetes prevalence and incidence, along with limited access to healthcare compared to non-Appalachian counties. By gaining a deeper understanding of the relationship between these factors, policymakers and healthcare systems in Ohio can strive to enhance the quality and accessibility of much-needed care for this vulnerable population.
Methods
Data
The data used in this study were obtained from the United States Diabetes Surveillance System (USDSS), which is a comprehensive collection of diabetes data and trends maintained by the Centers for Disease Control and Prevention (CDC). 21 The USDSS provided the necessary variables at the county level in Ohio. To facilitate the analysis, the collected variables and data were merged using R-Studio, version 2023.03.1+446 (statistical computing program).
Variables
Select variables that had statistics on the 88 counties in Ohio were chosen from the United States Diabetes Surveillance System. The complete list of the variables and how they were defined are22,23:
Diagnosed Diabetes: The age-adjusted percentage of people diagnosed with diabetes by a healthcare provider age 20+ years in 2018. Women who indicated that they only had diabetes during pregnancy were not considered to have diagnosed diabetes.
Newly Diagnosed Diabetes: The rate per 1000 of people diagnosed with diabetes within the past year in 2018. People diagnosed between 1 and 2 years were weighted as half of a newly diagnosed case.
Children in Poverty: The percentage of people under age 18 living in poverty as measured by the official US poverty rate in 2020.
Food Insecurity: Percentage of the population who did not have access to a reliable source of food during the past year. A 2-stage fixed effects model was created using information from the Community Population Survey, Bureau of Labor Statistics, and American Community Survey to estimate food insecurity in 2019.
Primary Care Physicians: Number of primary care physicians (PCPs) per 100 000 Population in 2020 to 2021. PCPs are defined as non-Federal doctors of medicine (M.D.) and doctors of osteopathy (D.O.) providing direct patient care who practice principally in 1 of the 4 primary care specialties-general or family practice, general internal medicine, pediatrics, and obstetrics and gynecology.
No Health Insurance: Percentage of population aged 18 years and older with no health insurance in 2018.
Overall Socioeconomic Status: The percentile rank of each Ohio county for socioeconomic status in 2018. The CDC/ATSDR Social vulnerability Index (SVI) ranks all US counties on 15 social factors, including poverty, lack of vehicle access, and crowded housing, and groups them into 4 related themes. 23
Overall Minority Status and Language: The percentile of each Ohio county for racial and ethnic minority status in 2018. The CDC/ATSDR Social vulnerability Index (SVI) calculates all US counties based on a variety of factors (Hispanic or Latino (of any race); Black and African American, Not Hispanic, or Latino; American Indian and Alaska Native, Not Hispanic, or Latino; Asian, Not Hispanic, or Latino; Native Hawaiian and Other Pacific Islander, Not Hispanic, or Latino; 2 or More Races, Not Hispanic, or Latino; Other Races, Not Hispanic, or Latino). 24
Statistical Analysis
Pearson correlation tests were employed to investigate the relationship between the percentage of people diagnosed with diabetes (prevalence) of diagnosed diabetes and the selected social determinants of health. The analysis incorporated 6 determinants and the counties were categorized as either Appalachian or non-Appalachian based on the classification by the Appalachian Regional Commission. 25 To account for multiple comparisons, a Bonferroni corrected significance level of α = 0.01 was applied, as increasing the number of variables may incorrectly trigger a significant test result.
In a similar manner, the incidence of newly diagnosed diabetes per 100 000 individuals was examined in relation to the chosen social determinants of health. Pearson correlation tests were conducted, and a Bonferroni adjusted significance level of α = .01 was used to determine statistical significance.
To assess the influence of geographical location on diabetes prevalence, a comparison was made between Appalachian and non-Appalachian counties. A t-test was performed to analyze the disparities between the 2 groups, with a significance level of α = .05. Likewise, the incidence of diabetes was investigated by comparing Appalachian and non-Appalachian counties. A t-test was conducted to explore the differences in diabetes incidence, with a significance level of α = .05.
Additionally, a multivariate analysis of variance (MANOVA) test was conducted to examine the impact of county classification (Appalachian/non-Appalachian) on social determinants of health, both individually and in combination with each other (ie, interactions). The significance level for this test was set at α = .05.
Results
The prevalence of diabetes was examined in relation to 6 selected variables representing social determinants of health using Pearson correlation tests (Figure 1). The analysis revealed significant positive associations between diabetes prevalence and 3 variables: children in poverty (R = .57, P ≤ .001, α = .01), food insecurity (R = .54, P < .001, α = .01), and overall socioeconomic status (R = .49, P < .001, α = .01). However, no significant relationships were observed between diabetes prevalence and the following variables: primary care physicians (R = .18, P = .088, α = .01), no health insurance (R = .14, P = .21, α = .01), and overall minority status and language (R = −.075, P = .49, α = .01).
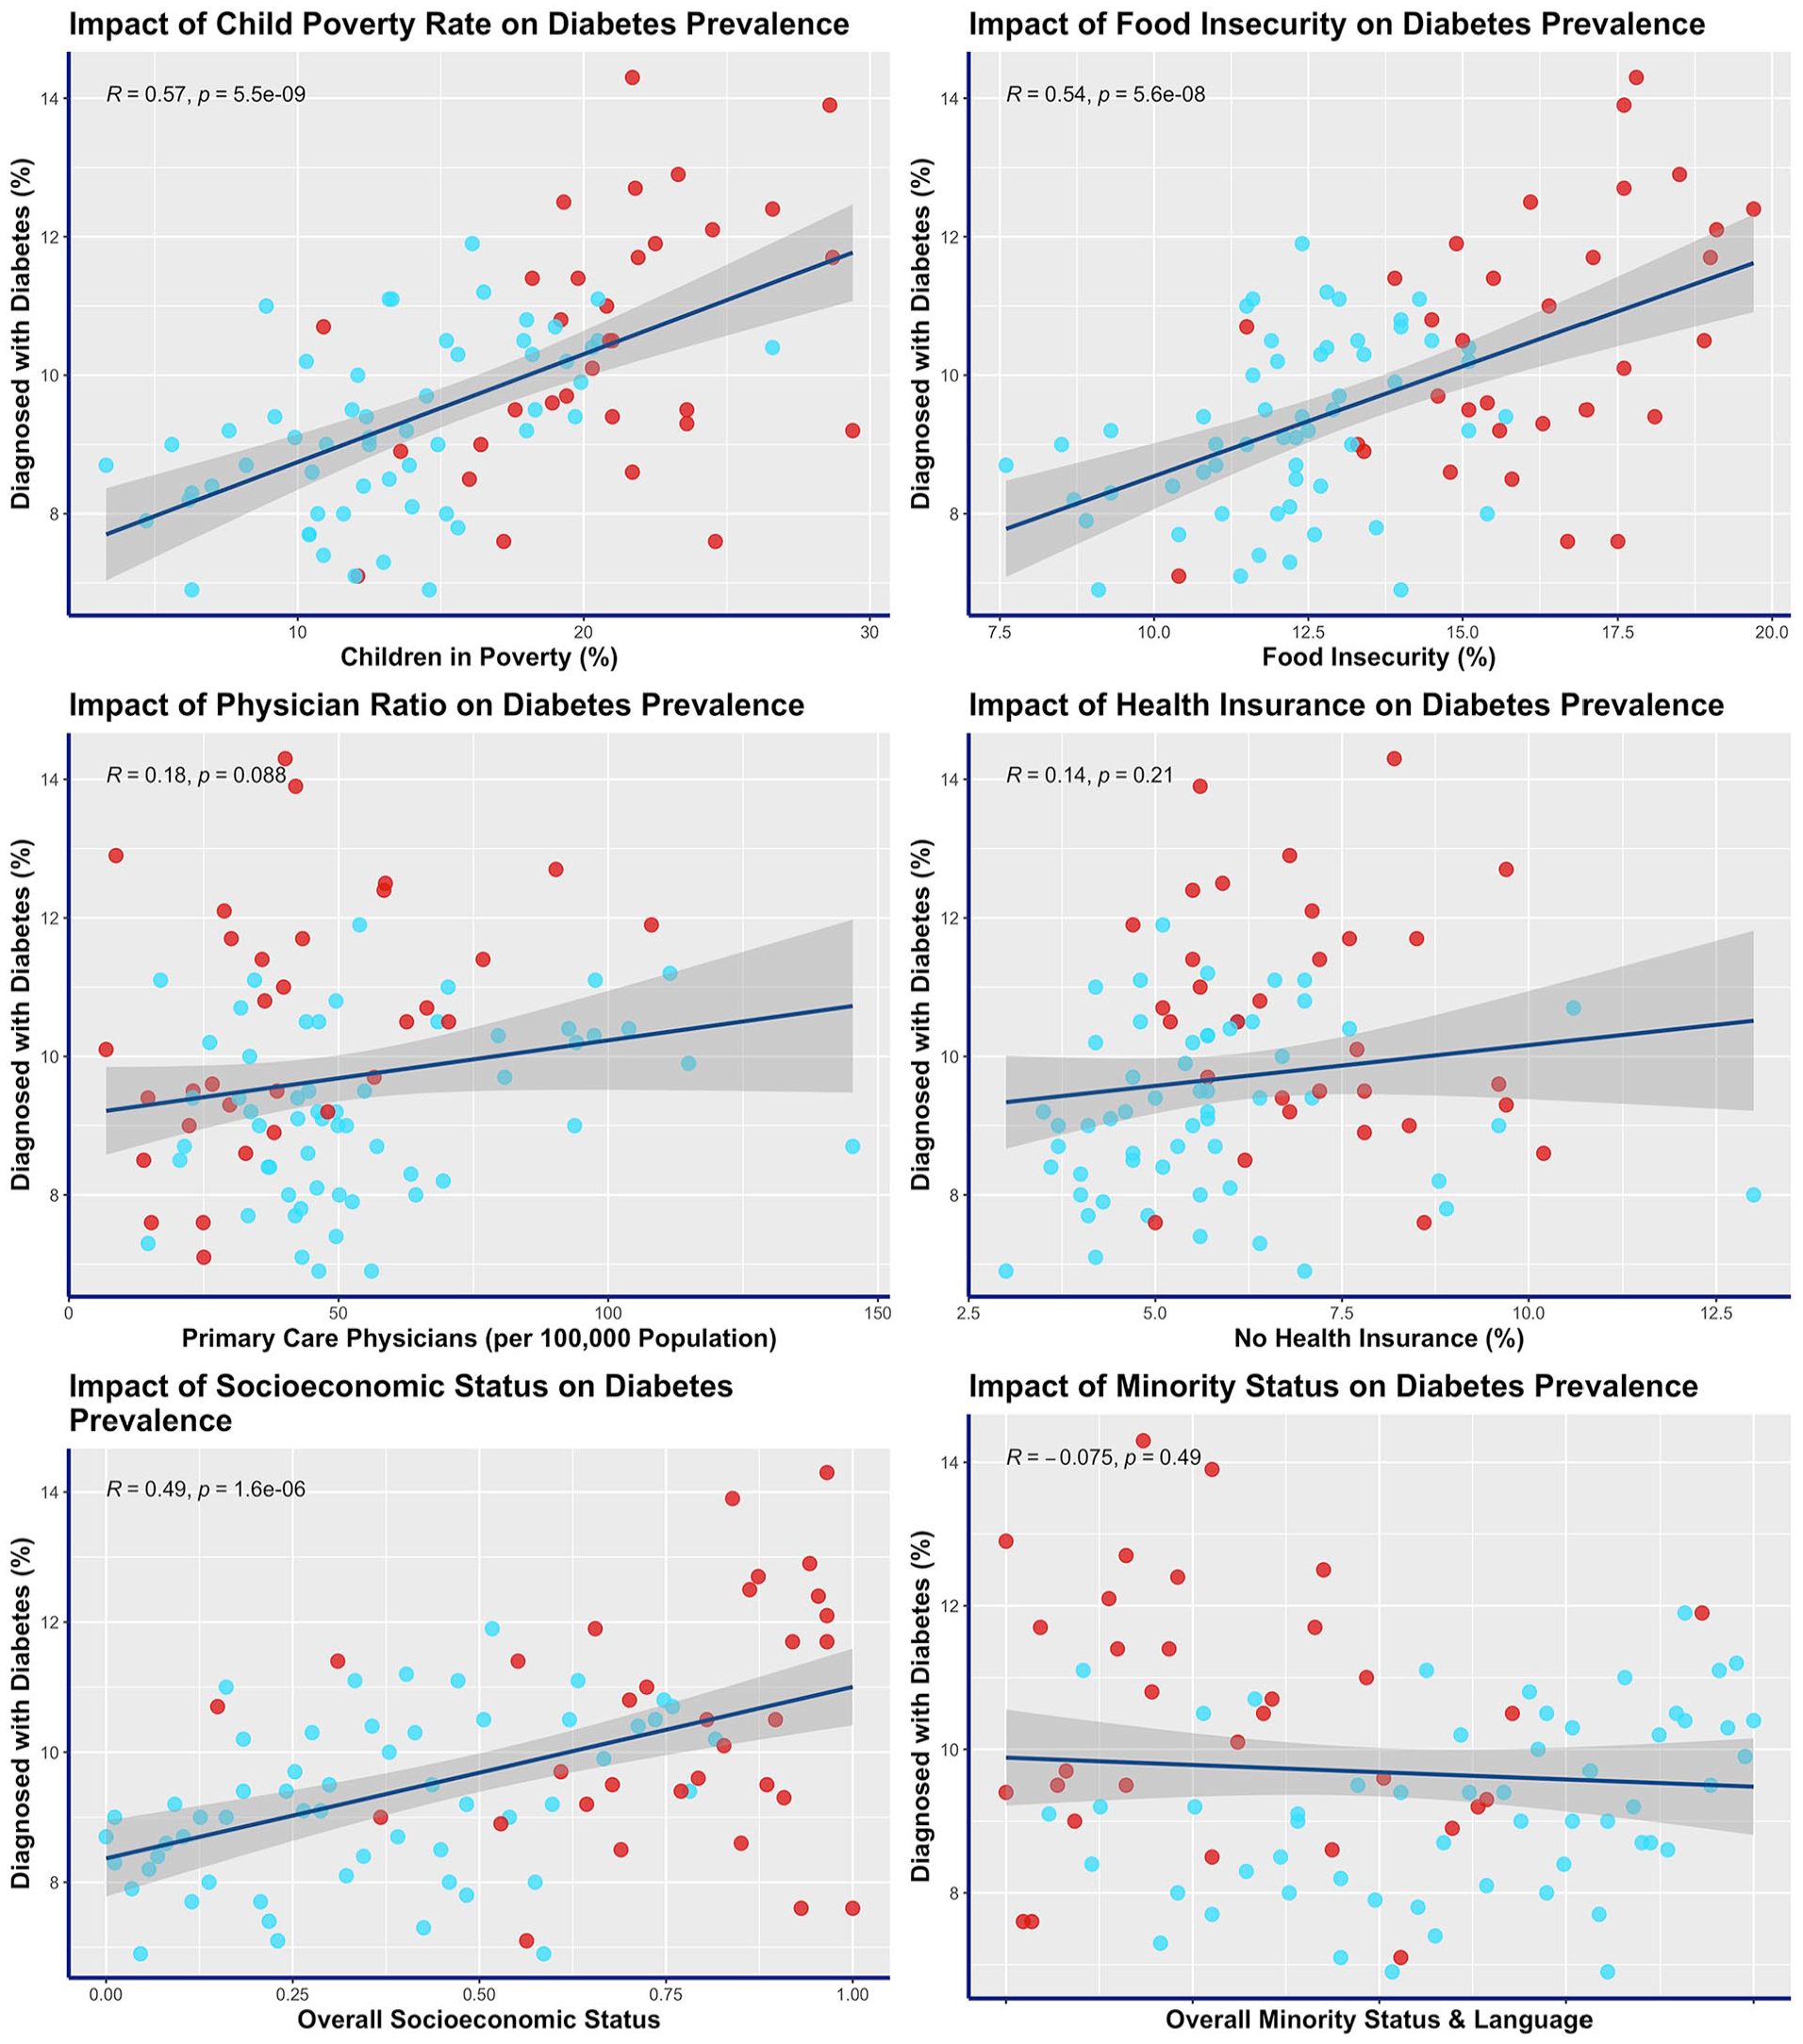
Impact of social determinants of health on diabetes prevalence (percentage of people diagnosed with diabetes) for Ohio counties. Appalachian counties are indicated in red (non-Appalachian counties are blue).
The incidence of diabetes was analyzed in relation to 6 selected variables representing social determinants of health using Pearson correlation tests (Figure 2). The analysis revealed significant positive relationship between the incidence of diabetes and 3 variables: children in poverty (R = .39, P < .0001, α = .01), food insecurity (R = .4, P < .0001, α = .01), and overall socioeconomic status (R = .36, P < .001, α = .01). Additionally, a significant negative relationship was observed between diabetes incidence and overall minority status and language (R = −.3, P = .0043, α = .01). However, no significant relationships were found between diabetes incidence and the variables: primary care physicians (R = −.18, P = .1, α = .01) and no health insurance (R = .14, P = .2, α = .01).

Impact of social determinants of health on diabetes incidence (rate of newly diagnosed with diabetes per 1000 people) for Ohio counties. Appalachian counties are indicated in red (non-Appalachian counties are blue).
The prevalence of diabetes was assessed by comparing Appalachian and non-Appalachian counties in Ohio. The results were presented in a box plot shown (Figure 3). Out of the 88 counties, 32 (36%) were classified as Appalachian. The mean prevalence of diabetes in Appalachian counties was 10.5% (SD = 1.8), while in non-Appalachian counties, it was 9.2% (SD = 1.2). A t-test was conducted to examine the difference in diabetes prevalence between these 2 groups, revealing a statistically significant disparity (P < .001, α = .05).

Comparison of diabetes prevalence between Appalachian and non-Appalachian counties in Ohio.
The incidence of diabetes was assessed by comparing Appalachian and non-Appalachian counties in Ohio, and the results were visualized in the box plot presented (Figure 4). Among the counties analyzed, Appalachian counties had a mean diabetes incidence of 10.8% (SD = 3.4), while non-Appalachian counties had a mean incidence of 9.6% (SD = 2.5). Although the mean incidence was slightly higher in Appalachian counties, the t-test did not reveal a statistically significant difference in diabetes incidence between these 2 groups (P = .11, α = .05).

Comparison of diabetes incidence between Appalachian and non-Appalachian counties in Ohio.
The multivariate analysis of variance (MANOVA) test was conducted to investigate whether there were statistical differences in social determinants of health between Appalachian and non-Appalachian counties in Ohio (Table 1). The results of the MANOVA test revealed a significant difference in social determinants of health as a whole between the 2 groups (P < .05). Furthermore, when considering each of the 6 chosen social determinants of health individually (children in poverty, food insecurity, primary care physicians, no health insurance, overall socioeconomic status, and overall minority status and language), all variables exhibited significant differences between Appalachian and non-Appalachian counties in Ohio.
Comparison of Social Determinants of Health Between Appalachian and Non-Appalachian Counties in Ohio.

Discussion
This study aimed to quantify the relationships between healthcare factors and diabetes while comparing disparities in resources in Appalachian Ohio. The analysis of the collected data provided valuable insights into the factors influencing the prevalence and incidence of diabetes. The hypothesis proposed that Appalachian counties would have higher rates of diabetes prevalence and incidence, along with less access to healthcare compared to non-Appalachian counties. The results confirmed this hypothesis, demonstrating significant relationships between various social determinants of health and the prevalence and incidence of diabetes (Figures 1 and 2).
Children in poverty, food insecurity, and overall socioeconomic status exhibited strong positive relationships with diabetes prevalence in Ohio (Figure 1). Higher rates of child poverty, food insecurity, and socioeconomic status were associated with increased prevalence of diabetes. Among these variables, the number of children in poverty emerged as the strongest predictor for diabetes prevalence. Each percent increase in the child poverty rate (ie, an increase from a child poverty rate of 15%-16%) correlated with 0.16% higher prevalence of diabetes. For instance, an Ohio county with a child poverty rate of 20% is associated with a population diabetes prevalence of approximately 1.6% higher than a county with a child poverty rate of 10%. However, no significant relationships were found between diabetes prevalence and the variables of primary care physicians, no health insurance, and overall minority status and language.
Similarly, children in poverty, food insecurity, and overall socioeconomic status were strongly correlated with diabetes incidence (Figure 2). Disparities in child poverty rate, food insecurity, and socioeconomic status indicate that certain communities may face inadequate access to quality care, leading to higher prevalence and incidence of diabetes. Improving healthcare coverage and quality for individuals in regions with higher child poverty and food insecurity rates could help address these inequities.
In addition to the aforementioned factors, diabetes incidence exhibited a significant negative relationship with overall minority status and language. Counties with a higher proportion for minority status and language were associated with a decreased incidence of diabetes, though not significantly lower prevalence. One possible explanation is that individuals from minority backgrounds may go undiagnosed. Research has shown that minority populations have less access to and receive lower quality of care. For example, minorities with diabetes were less likely to have a dilated ophthalmological examination and a lipid profile. 11 Addressing healthcare disparities related to minority status is an essential step towards ensuring equitable access to quality and consistent healthcare across all counties in Ohio. The data presented in this study underscore the significance of this issue and highlight the urgent need for interventions and policies that promote equal healthcare opportunities for all individuals, regardless of their minority status.
Disparities in health outcomes were further illustrated when comparing Appalachian and non-Appalachian counties in Ohio (Figure 3). The prevalence of diabetes was significantly higher for Appalachian counties than non-Appalachian counties. However, there was no significant difference in diabetes incidence between the 2 groups (Figure 4). The mean prevalence of 10.5% for Ohio Appalachian counties exceeded state and national averages. 9 The Appalachian region also constitutes 32 of the 88 counties (36%) in Ohio. Consequently, the Appalachian region remains an area that requires heightened attention and targeted interventions.
The MANOVA test yielded compelling results, demonstrating a significant distinction between Appalachian and non-Appalachian counties regarding overall social determinants of health (Table 1). Furthermore, all 6 selected social determinants of health, namely children in poverty, food insecurity, primary care physicians, lack of health insurance, overall socioeconomic status, and overall minority status and language, displayed notable disparities between the Appalachian and non-Appalachian counties in Ohio. The significant disparities in social factors influencing health emphasize the immediate need for policymakers and healthcare systems to create precise interventions and customized approaches that target the unique requirements of the area. The economic impact of diabetes in Appalachia is estimated at $17.8 billion. 26 Of this 17.8 billion, 31% was linked to obesity—a modifiable risk factor. 26 Initiatives striving for equitable healthcare provision and improved health outcomes for all residents assist in alleviating this financial strain on the healthcare system.
Improving access to healthcare services involves reducing barriers such as financial constraints and geographical distance. By recognizing and actively working to address these disparities, healthcare providers, policymakers, and stakeholders can make substantial progress in improving health outcomes and ensuring that all individuals receive the care they deserve. This requires a comprehensive approach that encompasses multiple facets of healthcare, including access to healthcare services, cultural competence and sensitivity in healthcare delivery, health education, and promotion initiatives targeted at appropriate communities, and addressing systemic barriers that perpetuate disparities.
One limitation of this study was the focus on Ohio’s Appalachian region, which may limit the generalizability of the findings. The unique characteristics and healthcare landscape of the Appalachian region may introduce confounding factors that are specific to this region and may not be applicable to other regions or populations. Therefore, caution should be exercised when extrapolating the results to different settings or populations, and further research in diverse regions is needed to validate the findings and broaden our understanding of healthcare disparities in relation to diabetes.
Conclusion
The burden of diabetes on the United States healthcare system is substantial, necessitating a deeper understanding of the social determinants of health that contribute to its prevalence and incidence. Additionally, improving access to healthcare services in Appalachian regions is paramount to ensure equitable healthcare provision and enhance the overall health outcomes of the affected communities. By investigating these factors, healthcare systems can effectively target communities affected by diabetes, optimizing the utilization of resources to reduce the burden of this disease.
The results of this study demonstrate notable disparities between Appalachian and non-Appalachian counties in Ohio, particularly concerning diabetes prevalence. Furthermore, significant differences exist between these 2 groups regarding social determinants of health. These findings suggest that Appalachian counties may face a disproportionate impact from health-related factors and experience limited access to healthcare services. The data highlight the need for focused efforts to address the specific challenges faced by Appalachian counties.
Footnotes
Author Contributions
Samuel Borgemenke and Allyson Hughes provided substantial contributions to conception and design, acquisition of data, or analysis and interpretation of data; Samuel Borgemenke and Allyson Hughes drafted the article or revised it critically for important intellectual content; all authors gave final approval of the version of the article to be published; and all authors agree to be accountable for all aspects of the work in ensuring that questions related to the accuracy or integrity of any part of the work are appropriately investigated and resolved.
Declaration of Conflicting Interests
The author(s) declared no potential conflicts of interest with respect to the research, authorship, and/or publication of this article.
Funding
The author(s) received no financial support for the research, authorship, and/or publication of this article.
Ethical Approval
Exempt.
Informed Consent
Not Applicable.