
Abstract
Background:
The objective of the study was to measure the risk of death due to COVID-19 in relation to individuals’ characteristics, and severity of their disease during the dominant periods of Alpha, Delta, and Omicron variants have influenced mortality rates.
Methods:
This study was conducted using COVID-19 Centers for Disease Control and Prevention (CDC) Case Surveillance Public Data Taskforce for 57 states, and United States territories between January 1, 2020 and March 20, 2022. Multivariable binary Hyperbolastic regression of type I was used to analyzes the data.
Results:
Seniors and ICU-admitted patients had the highest risk of death. For each additional percent increase in fully vaccinated individuals, the odds of death deceased by 1%. The odds of death prior to vaccine availability, compared to post vaccine availability, was 1.27. When comparing the time periods each variant was dominant, the odds of death was 3.45-fold higher during Delta compared to Alpha. All predictor variables had P-values ≤.001.
Conclusion:
There was a noticeable difference in the odds of death among subcategories of age, race/ethnicity, sex, PMCs, hospitalization, ICU, vaccine availability, variant, and percent of fully vaccinated individuals.
Introduction
Severe Acute Respiratory Syndrome Coronavirus 2 (SARS-CoV-2) is a highly infectious life-threatening disease. The 3 SARS-CoV-2 variants: Alpha, Delta, and Omicron have attracted the most attention. The severity of the disease caused by these variants, and the risk associated with them has not yet been fully determined, which presents a challenge to the global healthcare system. 1 The Alpha variant was the first of the dominant variants. It appeared in Great Britain in November of 2020, and shortly afterward became the dominant variant in the United States. Some mutations in Alpha’s spike protein were thought to make it more infectious. The B.1.1.7 was estimated to be up to 50% more contagious than the original SARS-CoV-2 strain. According to the Centers of Disease Control and Prevention (CDC), in mid-April 2021—before the emergence of the more transmissible and immune evasive Delta variant, the Alpha variant made up of 66% of cases in the United States. 2
The Delta variant was initially identified in India in late 2020; it spread throughout the world, and soon became the predominant variant until Omicron 3 took its place in mid-December 2021. It is believed that the Delta variant caused more than twice as many infections, and deaths than previous variants. After a steady decline in cases, and hospitalizations in the US, 4 the arrival of Delta coincided with a rapid reversal of that trend. In the fall of 2021, there were surges even in the most vaccinated regions, resulting in urgency for people with at least 1 pre-existing medical condition (PMC) and senior citizens to get booster shots, or a third dose. Among the unvaccinated, the Delta variant caused more severe disease which resulted in a sharp increase in hospitalizations, intensive care unit (ICU) admissions, and death. 5 Vaccinated areas in England have been found to be associated with a smaller reduction in transmission of the Delta variant when compared with the Alpha variant. 6
The Omicron variant was identified for the first time in Botswana and South Africa in late November 2021, and rapidly began to spread to other countries. However, the Omicron 3 variant, although highly transmissible, and immune evasive, does not appear to cause more severe disease than other variants. 3 The Omicron variant has contributed to a record number of cases, and has led to increased numbers of reinfections. There are 2 key differences between Omicron and previous variants of SARS-CoV-2 virus that emerged in late 2019. Data indicated infections caused by the Delta variant are more severe resulting in lower survival rates 7 than the ones caused by Alpha, or Omicron variants. The Delta variant at its peak dominancy, which happened in the summer of 2021, had an estimated 40% to 60% higher transmissibility rate when compared to the Alpha variant. The Omicron variant transmitted at faster rate compared to other variants. 8 According to the CDC’s Morbidity, and Mortality Weekly Report, lengths of hospital stays, ICU admittance, and death rate have been lower for Omicron than for Delta. 9
There is substantial evidence that Blacks, Hispanic/Latinx, American Indian, and Alaska Natives are more likely than Whites to contract COVID-19, and to be disproportionately affected by the most severe symptoms of COVID-19 disease.10-17 Although the trend has recently shifted, racial/ethnic minorities have been found to experience higher rates of incidence,18-21 hospitalization,14,21-23 ICU admissions,24,25 deaths,26,27 and premature deaths due to COVID-19.28,29 This study seeks to identify not only risk factors associated with death, but more importantly assess the risk associated with each category of variables that contribute to racial/ethnic disparities in COVID-19 deaths.
Methods
This is a retrospective study conducted with COVID-19 case surveillance, public use data from the CDC Case Surveillance Public Data Taskforce for 57 states, and United States territories between January 1, 2020, and March 20, 2022. Under state laws, hospitals, healthcare providers, and laboratories must report confirmed, or probable COVID-19 cases, and deaths to state, or local health departments. The dataset includes demographics, exposure history, disease severity indicators, and outcomes, presence of underlying medical conditions, and risk behaviors. Patient characteristics included sex (male or female); age (persons 19 or younger, 20-39, 40-59, 60 years of age or older); race/ethnicity (Non-White [American Indian/Alaska Native, Asian, Black, Hispanic/Latinx, Multiple/Other, and Native Hawaiian/Other Pacific Islander] and White). Other patient characteristics included PMCs (obesity, hypertension, diabetes, cardiovascular disease, chronic respiratory, or kidney disease, immunosuppression from solid organ transplant, and sickle cell disease), hospitalization status (whether, or not a patient was hospitalized), ICU admissions (whether, or not a patient was admitted into the ICU), variant (Alpha [January 1, 2020-May 19, 2021], Delta [May 20, 2021-November 30, 2021], and Omicron [December 1, 2021-March 20, 2022]), vaccine (whether, or not vaccines were available to at least 1 group of individuals in the United States—beginning December 13, 2021), percent fully vaccinated (measured after March 5, 2021), and death—patient cases were included only if COVID-19 was listed as a cause of death on the death certificate. The COVID variant assigned to each case was not confirmed by laboratory analysis, but is instead inferred from the time frame during which each variant was dominant. Percent fully vaccinated and vaccine availability were measured at the national level, whereas all other variables were measured at the patient-level. This paper does not cover COVID-19 dominant subvariants of Omicron BA. four-fifths, which are more resistant to currently available vaccines. 30 Data were updated every 2 weeks and are publicly available to all without restrictions at: https://data.cdc.gov/Case-Surveillance/COVID-19-Case-Surveillance-Public-Use-Data/vbim-akqf. These data were publicly available without any personal identifiers and did not require IRB review.
A total of 69 664 983 de-identified patients were observed. For the purpose of this study, only patients who had lab-confirmed COVID-19 cases were included, yielding a total of 957 221 patients. Tests of association between COVID-19 death and independent variables of interest were performed. Multivariable binary hyperbolastic regression of type I, a generalized form of logistic regression, was used to analyze the effect of variant, vaccine availability, sex, age group, race/ethnicity, PMCs, hospitalization status, and ICU status, on death, among patients for whom COVID-19 was identified as a cause of death. Adjusted odds ratios (AORs) and 95% confidence intervals were calculated. This paper also investigates the risk and comparative risk of death associated with COVID-19 variants while controlling for vaccine availability, sex, age group, race/ethnicity, PMCs, hospitalization, and ICU status. Statistical significance tests of variables of interest for COVID-19 mortality, and their AOR’s, and 95% confidence intervals were calculated.
Results
Table 1 summarizes the frequency, and percentages of all categorical study variables stratified by dominant COVID-19 time periods for Alpha, Delta, and Omicron for persons diagnosed between January 1, 2020 and March 20, 2022. Overall, 66.2% of cases were White. Females had a slightly higher representation than males (53.4% vs 46.6%). Persons 19 years of age or younger had the smallest percentage of COVID-19 diagnoses (16.7%), followed by persons 60+ (26.7%), 40 to 59 (27.3%), and 20 to 39 (29.3%). Approximately 44.3% of patients had PMC. Among those with PMC, 45.6% were of age 60+. Overall, 17.3% of the patients were hospitalized, 5.9% were admitted to the ICU, and 5.8% died. Persons 60+ were more likely to be hospitalized, admitted to the ICU, or die from COVID-19. The death rate during dominant period of Alpha, Delta, and Omicron were 5.3%, 7.5%, and 9.0% respectively and the overall death rate for all periods combined was 5.8%. As shown in Table 2, Non-Whites had the highest percentage of death due to COVID-19 (6.3%), while for Whites the rate was 5.6%. Approximately, 18.9% of non-Whites and 16.5% of Whites were hospitalized. The admission rates to ICU for non-Whites and Whites were 7.4% and 5.1% respectively.
Frequency and Percentage.

Percentages for each variable may not add up to 100% due to rounding.
Estimated Conditional Probability of Categories of COVID-19 Variables.

Abbreviations: 0 to 19, 20 to 39, 40 to 59, and 60+, age group; D, death; F, female; H, hospitalization; ICU, admission to the intensive care unit; M, male; NW, non-White; PMC, pre-existing medical condition; V, vaccine available; W, White; α, alpha variant; δ, delta variant; ο, omicron variant.
The presence of a bar above each respective symbol represents that symbol’s complement. Percentages listed in the table are represented conditioned on column label grouping.
As shown in Table 2, among Whites, 45.7% had PMC, 16.5% were hospitalized, 5.1% were admitted to the ICU, and 5.6% died. Among hospitalized patients, 30.5% died and of those who died, 90.6% had been hospitalized. Overall, 36.2% of all deaths were non-Whites and 63.8% were Whites. Among non-Whites, 53.4% were female, 19.2% were persons under 19 years of age and 17.5% were 60+, 41.5% had PMC. Of hospitalized patients who died of COVID-19, 58.5% were male. Overall, the death rate among males, and females were 7.2% and 4.6% respectively. Approximately 6.3% of non-Whites died of the disease, while the death rate among Whites was 5.6%. The death rate for persons 19, or younger, 20 to 39, 40 to 59, and 60 years of age, or older were 0.1%, 0.5%, 3.3%, and 18.0% respectively indicating a sharp increase in the death rate between age groups 40 and 59 and 60+. The percentage of death among patients with PMC was 11.9% compared to only 1.0% for those without PMC. Hospitalized patients had a death rate of 30.5% while for non-hospitalized patients, the death rate was 0.7%. ICU patients had the highest death rate of 59.9%, while the death rate for non-ICU patients was 2.5%.
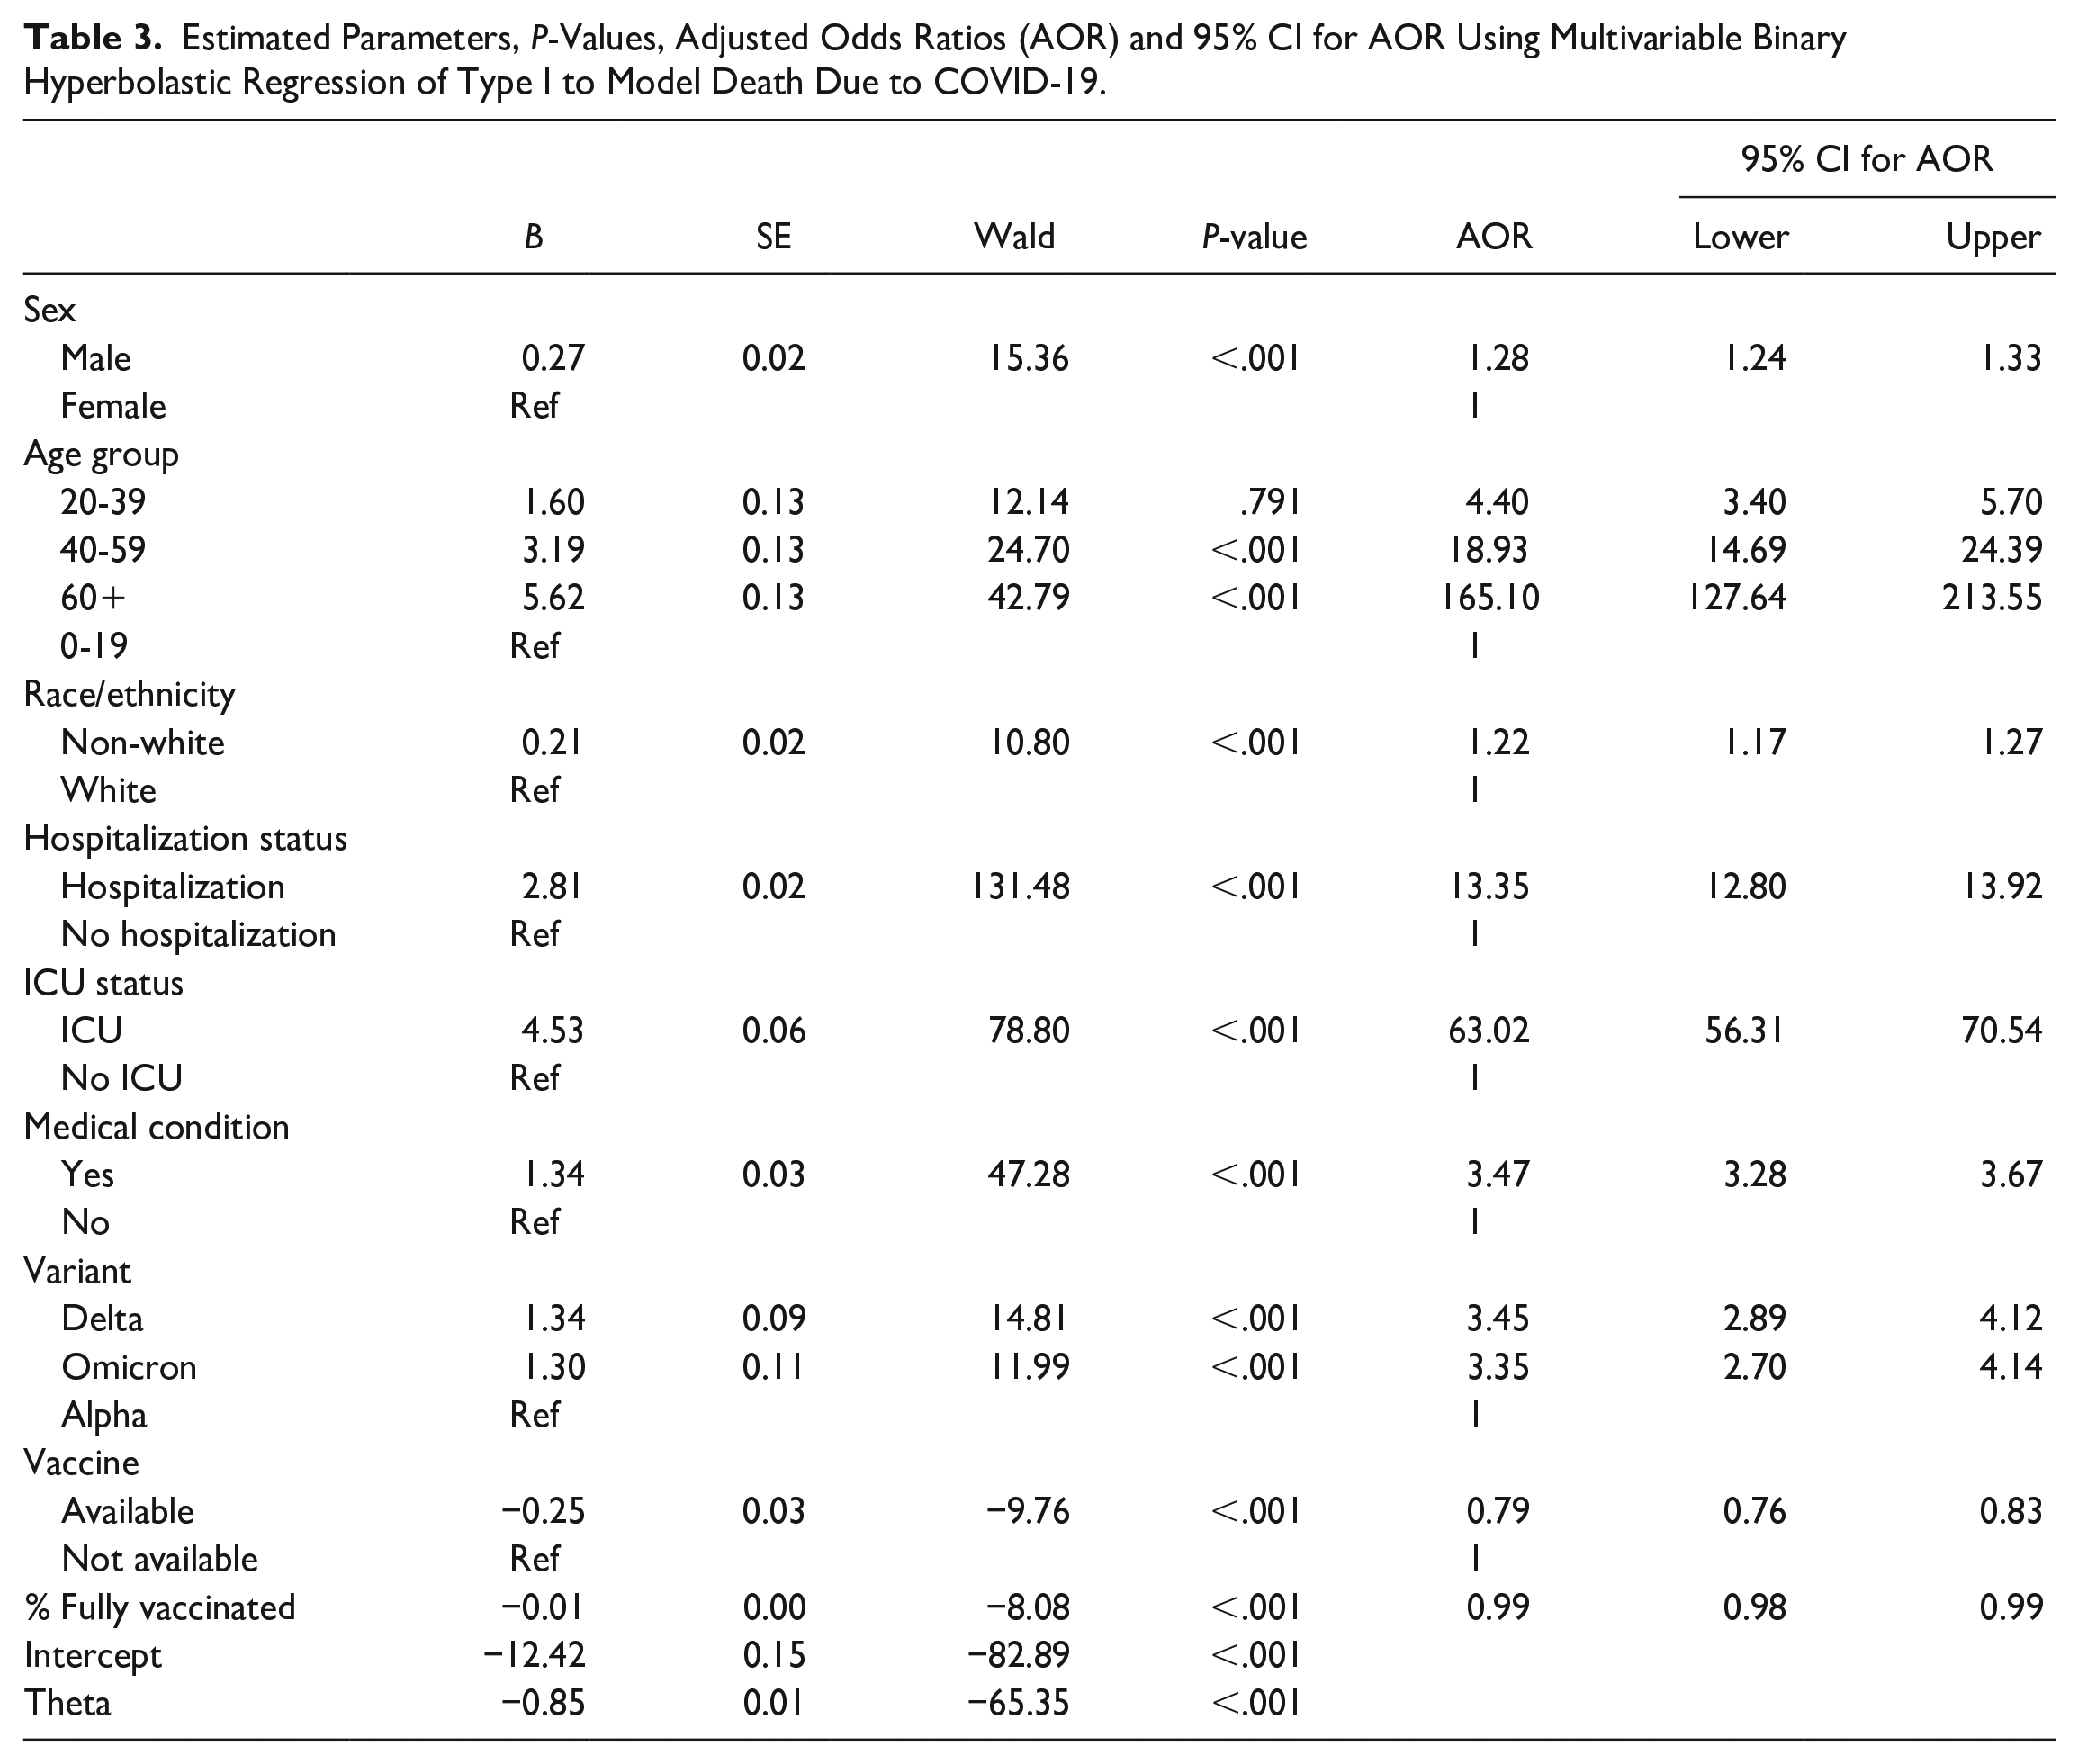
As shown in Table 3, all variables were significantly associated with COVID-19 deaths (all P-values <.001). For males, the odds of dying of COVID-19 were 28% higher than females (AOR = 1.28, 95% CI = 1.24-1.33). The odds of death prior to vaccine availability was approximately 27% higher when compared to the time period when vaccines became available (AOR = 1.27, 95% CI = 1.20-1.32). The odds of death for a hospitalized patient was 13.35 times greater than the odds for a non-hospitalized patient (AOR = 13.35, 95% CI = 12.80-13.92). For each percent increase in fully vaccinated individuals across the county, the odds of death deceased by 1% (AOR = 0.99, 95% CI = 0.98-0.99). For non-Whites, the overall odds of death were 22% higher when compared to Whites (AOR = 1.22, 95% CI = 1.17-1.27). If we were to stratify the data based on variant, the odds of death for non-Whites during the Alpha (AOR = 1.21, 95% CI = 1.16-1.27), Delta (AOR = 1.48, 95% CI = 1.34-1.64), and Omicron (AOR = 1.19, 95% CI = 1.03-1.20) period were 21%, 48%, and 19% higher than Whites, respectively. The odds of a patient dying in the non-stratified model was 63.02-fold higher when admitted to the ICU, compared to patients that were not admitted (AOR = 3.02, 95% CI = 56.31-70.54). Patients aged 60+, 40 to 59, and 20 to 39 had a 165.10 (AOR = 165.10, 95% CI = 127.64-213.55), 18.93 (AOR = 18.93, 95% CI = 14.69-24.39), and 4.40 (AOR = 4.40, 95% CI = 3.40-5.70) times higher odds of dying of COVID-19 than persons 19 years-old or younger respectively. Because of this dramatic increase in death based on age, elderly patients are at an increased risk when compared to other age groups. The odds of death was 3.47-fold higher for patients with PMC, when compared to those with no PMC (AOR = 3.47, 95% CI = 3.28-3.67). The odds of death were 3.45-fold higher when Delta was the dominant variant compared to Alpha (AOR = 3.45, 95% CI = 2.89-4.12); but the odds of death was 3.35-fold higher when Omicron was dominant compared to when the Alpha variant was dominant (AOR = 3.35, 95% CI = 2.70-4.14).
Estimated Parameters, P-Values, Adjusted Odds Ratios (AOR) and 95% CI for AOR Using Multivariable Binary Hyperbolastic Regression of Type I to Model Death Due to COVID-19.
Patients hospitalized due to their severe conditions played the most significant role in mortality, followed by ICU and PMC patients. Among non-Whites who died, 95.6% had been hospitalized; however, the hospitalization rate for Whites who died was 87.7%. Among non-Whites who were hospitalized, 31.7% died; for Whites, this rate was 29.9%. Approximately 62.3% of non-Whites and 58.1% of Whites who were admitted to the ICU died. For those non-White patients who died, 73.4% had been admitted to the ICU, yet only 53.0% of Whites who died were admitted to the ICU. The death rates for White and non-White patients with PMC were 11.1% and 13.8% respectively.
During the time period when Alpha was dominant, 5.1% of Whites, and 5.8% of non-Whites died, while during the time period when Delta was dominant, 7.4% of Whites and 7.7% of non-Whites died. The death rates for Whites and non-Whites during the Omicron time period were 8.4% and 10.9%, respectively. Approximately 6.6% of males and 4.2% of females died when Alpha was dominant; while the male, and female death rates were 9.2% and 6.0% when Delta was dominant, respectively. When Omicron became the dominant variant, the death rate for males, and females jumped to 11.4% and 7.1% respectively. The mortality gap between males and females was highest during the Omicron time period.
The death rate during the Delta time period was highest followed by Omicron, and Alpha. The death rate for hospitalized patients during Alpha, Delta, and Omicron time periods were 28.5%, 36.7%, and 37.8% respectively. For patients admitted to the ICU during Alpha, Delta, and Omicron time periods, the death rates were 56.2%, 70.6%, and 72.0% respectively; while for those with PMC the death rates were 11.2%, 14.6%, and 15.4% respectively. Figure 1 illustrates the percentage of fully vaccinated people over the course of our study, beginning in January 2021, and steadily increasing thereafter. The percent of fully vaccinated individuals increased across the Alpha (mean = 1.8%, SD = 6.4%), Delta (mean = 52.5%, SD = 4.9%), and Omicron (mean = 62.3%, SD = 1.4%) time periods. The reason for such a low mean value during the Alpha period was due to the unavailability of the vaccine for most of the early time period.

Percentage of fully vaccinated people by date.
We measured the performance of our multivariable binary hyperbolastic regression of type I using a Receiver Operating Characteristic (ROC) curve. As shown in Figure 2, the area under the ROC cure (AUC) was 0.9606. As illustrated in Table 4, the overall correct prediction of death was 95.66%.

ROC curve for multivariable binary hyperbolastic regression of type I.
Classification Table Using Multivariable Binary Hyperbolastic Regression of Type I to Model Death Due to COVID-19.

Discussion
As the course of the COVID-19 pandemic continues with the continual emergence of variants, and subvariants, we learn more about it, and it is evident that racial/ethnic minorities are consistently at higher risk for death, being hospitalized, and being admitted to the ICU than Whites based on our findings. However, the risk for COVID-19 death appears to be much more complex, and to have varied over the course of the epidemic, and the emerging variants. While these data do not allow for the identification of the reasons for the race, age, and sex differences, these differences likely reflect areas in the population directly affected by COVID-19.
For a good portion of Alpha variant time period, the vaccine was not available and when it became available, the public health initial priority was for healthcare workers, senior citizens or people with PMC to get vaccinated. In addition, at the early stage of vaccine availability, and access, vaccine resistance, and hesitancy levels were high. Such a high level of vaccine resistance, and hesitancy may have been associated with people’s concern about vaccine safety, vaccine efficacy, political ideologies, racial, and ethnic affiliation, or religious affiliation.31-33
It can be seen throughout the pandemic, males had a consistently higher rate of death, which could be in part due higher levels of vaccine resistance and hesitancy when seeking help from the community or medical providers. The results suggest that more emphasis should be put on primary care. With patients waiting to be treated, hospitals and clinical care was overrun with sick patients, and a lack of abiding by established public health principles, these deaths are mostly avoidable.
Efforts should be made to minimize the rate of transmission by introducing a public health policy which would keep a fair balance between COVID-19 mandates, and economic impact to the individuals in the society. Consideration should be given to minimize unnecessary mandates and achieve goals based on reliable statistical data. Getting vaccinated and, if necessary, boosted, especially the elderly, or people with PMCs who are at higher risk of death is warranted.34,35 Masking in indoor public places, getting tested for COVID-19 if you have symptoms, social distancing, and avoiding large indoor activities, and following changes in CDC mitigation guidelines are currently recommended to reduce community spread of COVID-19 infection. 36
The main reason for a low vaccination rate immediately after it became available was that for a good portion of this time, the vaccine was restricted to healthcare workers, senior citizens, or people with PMC. In addition, at the early stage of vaccine availability, and access, vaccine resistance, and vaccine hesitancy levels were high. Such high levels of hesitancy may have been associated with people’s political, racial, religious affiliations, or distrust of the federal government, which strongly affected rural communities in the South.31,37,38
The relative contribution of variables included in our model may reflect regional differences in population characteristics, regional adaptation of behaviors to prevent COVID-19 transmission, and/or regional differences in state and local public policies. COVID-19 has become the leading cause of death in the United States in 2020. 39 Understanding what variables affect mortality the most will indicate which groups need to be most protected and prioritized for targeting vaccine distribution, therapeutics and the frequency of vaccination (number of doses) depending on the variant. 40 Minor selection bias may be included in this study due to the exclusion of participants who had incomplete data.
Conclusion
In conclusion, the risk of death for elderly patients by far was the most significant factor, followed by those who were admitted to the ICU, hospitalization, PMC, COVID-19 variant, sex, race/ethnicity, percent of fully vaccinated individuals, and vaccine availability. Among the variants, Delta was the deadliest, followed closely by Omicron. The slight reduction in risk during Omicron’s dominancy may be due to an increase in preparedness in how to treat the disease. It is important to note that an increase in the percentage of fully vaccinated individuals provided a significant reduction in the risk of death. The authors hope this paper helps local, state, and federal public health officials, and leaders to have a more uniform, science-based strategy toward reducing vaccination resistance, and hesitancy in the US.
Footnotes
Author Contributions
Conceptualization: MT, DMW; Methodology: MT, DMW, KPS; Formal analysis: MT, DMW, KPS, DJA; Funding acquisition: MT, PDJ, PMJ; Writing: original draft: MT, DMW, NT, AR, DJA, KPS; Review and editing: MT, DMW, AR, DJA, PDJ, PMJ, NT, KPS.
Declaration of Conflicting Interests
The author(s) declared no potential conflicts of interest with respect to the research, authorship, and/or publication of this article.
Funding
The author(s) disclosed receipt of the following financial support for the research, authorship, and/or publication of this article: The project has been supported by Meharry Medical College Research Centers in Minority Institutions (RCMI) grant (National Institutes of Health; NIH grant MD007586), the Tennessee COVID-19 Community-Engaged Research Coalition (NIH Agreement 1OT2HL156812-01), and the Tennessee COVID-19 Health Disparity Initiative (Tennessee Department of Health, grant number 34352-88221). This project has also been partially supported by Heath Resources and Services Administration (HRSA) under grant number UH1HP30348. This information or content and conclusions are those of the authors and should not be construed as the official position or policy of, nor should any endorsements be inferred by NIH, RCMI, or HRSA.