
Abstract
Background:
Deployment of telehealth has been touted as a means of reducing health disparities in underserved groups. However, efforts to reduce regulatory barriers have not been associated with greater telehealth uptake. The goal of this study was to examine engagement with technology among low-income people of color living in Newark, New Jersey.
Methods:
Using surveys and focus groups, we examined study participants’ daily use of technology (eg, Internet) and comfort with telehealth services (eg, use of teleconferencing for medication refills) before and after COVID-related social distancing mandates went into effect.
Results:
Use of technology was significantly lower in the pre-COVID period. However, prior months’ use of technology had a weak but significant correlation with comfort with telehealth (r = .243, P = .005) in bivariate analyses and was the only significant predictor in multivariate analyses. Analyses of focus group discussions confirmed that lack of experience with technology and distrust of the security and privacy of digital systems were the most important barriers to comfort with telehealth in our sample.
Conclusion:
Our study found that approximately 20% of people in this under-resourced community lacked access to basic technologies necessary for successful deployment of telehealth services. The study’s timing provided an unexpected opportunity to compare experiences and attitudes relating to telehealth in 2 regulatory environments. Although uptake of telehealth services increased with the Federal governments’ relaxation of regulatory barriers, there was not a similar increase in comfort with telehealth use. Investments in broadband access and equipment should be accompanied by educational programs to increase day-to-day use of and comfort with associated technologies which would improve consumer confidence in telehealth.
Introduction
For decades, proponents have touted telehealth as a means to eliminate health disparities in underserved communities (ie, areas with large percentages of ethnic minorities, elderly individuals, rural residents, and/or individuals of low socioeconomic status)1-6 and to advance the Triple Aim of improving the patient’s experience of care, improving population health, and reducing healthcare costs.1-9However, prior to the COVID-19 pandemic, fewer than 1% of Medicaid and rural Medicare beneficiaries in the United States had ever used telehealth services. 10 Relaxation of regulations for telehealth delivery led to an unprecedented increase in telehealth uptake after the start of the pandemic,11-13 but significant disparities remain. 14
One barrier to telehealth uptake in underserved communities has been the failure to consider their needs and preferences in the product development process.10,15 For example, the design of online portals for COVID vaccine scheduling were too complicated for individuals with limited digital literacy, and contributed to disparities in vaccination rates. 16 A recent paper by the National Committee for Quality Assurance identified the failure of systems to address patient-specific needs (eg, poor finger/hand dexterity and limited English proficiency) as a significant barrier to telehealth uptake during the COVID crisis, and called for a more patient-centered focus in system design to ensure health equity.17,18Although state regulations have been identified as a barrier to telehealth uptake in underserved communities, 13 research suggests that policy changes are insufficient to overcome barriers to telehealth usage within rural and low-income populations. 19
The present study was designed and began implementation prior to the COVID pandemic. The original goal was to provide descriptive data regarding levels of engagement with technology among low-income people of color in Newark, New Jersey. The intention was to better understand residents’ perspectives of the role of technology in their lives to develop more effective interventions that increase telehealth uptake. 11 COVID-related social distancing mandates enacted during this study’s data collection period provided a natural environment for examining the effect of policy changes on residents’ experiences with technology and attitudes toward it.
Methods
Recruitment
We recruited 4 large health-service providers to assist with study recruitment. These organizations receive federal funding to provide comprehensive services to low-income residents living with HIV, and at risk for it. On average, 26.3% of the organizations’ clients lack health insurance coverage, and 52.5% have health insurance through Medicaid. An average of 72.5% of clients are African American, and 11% are Latino. Forty-five percent of clients they serve are homeless, 56.3% are living below the poverty level, and 36.3% have limited English proficiency.
Quantitative Data Collection
The pre-COVID period of data collection encompassed February 1 to mid-March of 2020. After COVID restrictions were lifted, we collected another round of surveys between November 2020 and March 2021 (hereafter referred to as the “post-COVID” period). Quantitative data collection took place in-person following proper social distancing protocols. Trained graduate students selected dates randomly and invited all patients 18 or older in the waiting rooms to complete an anonymous Qualtrics© survey on study-provided iPads©. The students were available to assist patients in completing the surveys, if needed. Surveys were available in English and Spanish, and subjects received a $5 Visa gift card for their participation.
Study Variables
The outcome of interest was the level of comfort using videoconferencing for healthcare visits assessed in relation to 7 common types of telehealth visits: namely, managing medications, minor urgent care needs, follow-up visits, managing chronic health conditions, sharing test results, lifestyle coaching, mental health counseling, and annual check-ups. Responses used a 5-point Likert scale ranging from “very uncomfortable” to “very comfortable.” However, final analyses used a dichotomous outcome, with “comfortable” or “very comfortable” coded as “1” and all other responses coded as “0.” We also summed responses for the set of 7 types of visits to create a continuous variable (Cronbach’s alpha = 0.901).
Independent variables included demographic and health-related characteristics, health literacy, 20 experience with technology, and items from the Trust in Physicians21,22 and Trust in Health Care Settings23,24 scales. Respondents were asked about their access to various types of technology and the extent to which they used such devices on a daily basis. The survey also included questions regarding respondents’ confidence using technology and comfort with basic computer functions.
We also examined respondents’ reported experience with telehealth-related services. One question assessed the number of times participants used such services in the past month, using response categories (eg, never, once, weekly, daily). Given the small sample sizes, we collapsed response categories, with “1” indicating “any use” and “0” indicating “never” having used such services. For multivariate analyses, we created a continuous variable that was the sum of these 5 items (Cronbach’s alpha = 0.707).
Statistical Analysis
Statistical analyses were performed using IBM’s SPSS statistical software. We used the Chi-squared statistic to test for significant differences between respondents in the pre-COVID and post-COVID periods. Since no personally identifiable data were collected, the Rutgers University Institutional Review Board approved the study under expedited review.
Qualitative Data Collection
Between late April and early May of 2021, we conducted 3 90-min focus-group sessions with consumers via the Zoom© meeting platform. Participants were among those who completed the study surveys but because the survey responses were anonymous, it was not possible to link the quantitative and qualitative responses of participants. One of the focus groups was comprised of 10 Spanish-speaking Latinas ranging in age from 20 to 65. Another group was comprised of a mix of 7 men and women of different ethnicities with ages ranging from early 30 s to late 40 s. The third group included gay and bisexual men between the ages 18 and 25, and included 1 white man, 2 Latinos, and 9 African Americans. Subjects received $25 Visa gift cards for their participation. Discussions focused on perceptions of the barriers to uptake of telehealth services, need and utility of telehealth services, preferences for service delivery, and types of investments needed to support consumer uptake. Due to the small sizes and numbers of focus group sessions conducted, we were unable to analyze data by subgroup (eg, Latinos vs others, or gay/bisexual men vs others). We recorded focus groups to facilitate note-taking, and 2 study team members independently reviewed the sessions using a grounded theory approach to identify key themes, with a third researcher available to adjudicate disputes.25,26
Results
Quantitative Study Findings
As shown in Table 1, Pre-COVID participants were significantly older than Post-COVID respondents (mean age 50.1 [SD = 13.17] vs 39.6 [SD 12.33], P < .001) and more likely to be African American (66.7% vs 58%, P < .001) and disabled (41.3% vs 23.5%, P = .005). Conversely, Post-COVID participants were more likely to be Latino (40.7% vs 12.7%, P = .001) and to be employed (51.9% vs 22.3%, P = .005). Almost 40% of Pre-COVID respondents had less than a high school degree, while 45.7% of Post-COVID respondents had attended college (P = .044). Consistent with this finding, 54% of Pre-COVID study participants had low health literacy versus only 29.6% in the Post-COVID cohort (P = .003). There were no significant differences across the other demographic characteristics collected. Overall, study participants were nearly equally distributed by gender, 91.7% were English-speaking, greater than 75% were stably housed, and around 72% were registered to vote.
Participant Characteristics.

Percentages may sum to greater than 100 since multiple responses were allowed; χ2: *P < .05.
There were few significant differences in health status among survey respondents. Pre-COVID participants were more likely to have diabetes (31.7% vs 11.1%), HIV/AIDS (44.4% vs 32.1%), and a substance use disorder (12.7% vs 3.7%) (P = .041), but self-reported health status did not differ significantly, with 27.8% reporting “poor” or “fair” health. Around 44% of study participants had Medicaid coverage but 18.1% reported no health insurance coverage. Ninety-one percent of participants had a usual source of healthcare, but the majority (68.3%) of Pre-COVID respondents reported a primary healthcare provider as their usual source, versus only 46.9% of Post-COVID respondents.
Although 35.4% endorsed the idea that their providers do not do enough for their medical care, trust in healthcare providers was generally high. Trust in the health care system was lower, with between 30% and 46% agreeing that healthcare organizations are deceptive or do not adequately protect patients. Around 30% of respondents in both study periods reported having delayed getting healthcare in the prior 12 months.
There were few significant differences between the study periods regarding access to technology (Table 2). Between 31.7% and 64.2% of respondents in both periods reported access to a tablet, laptop, or desktop computer; smart TVs; or fitness trackers (Panel a). Only about one-third of those with any access used them at least daily. The only significant difference between the study periods was with respect to smart TVs; Pre-COVID respondents were less likely than Post-COVID respondents to report daily use (34.9% vs 55.6%, P = .014).
Experience With Technology (Pre-COVID n = 63, Post-COVID n = 84).
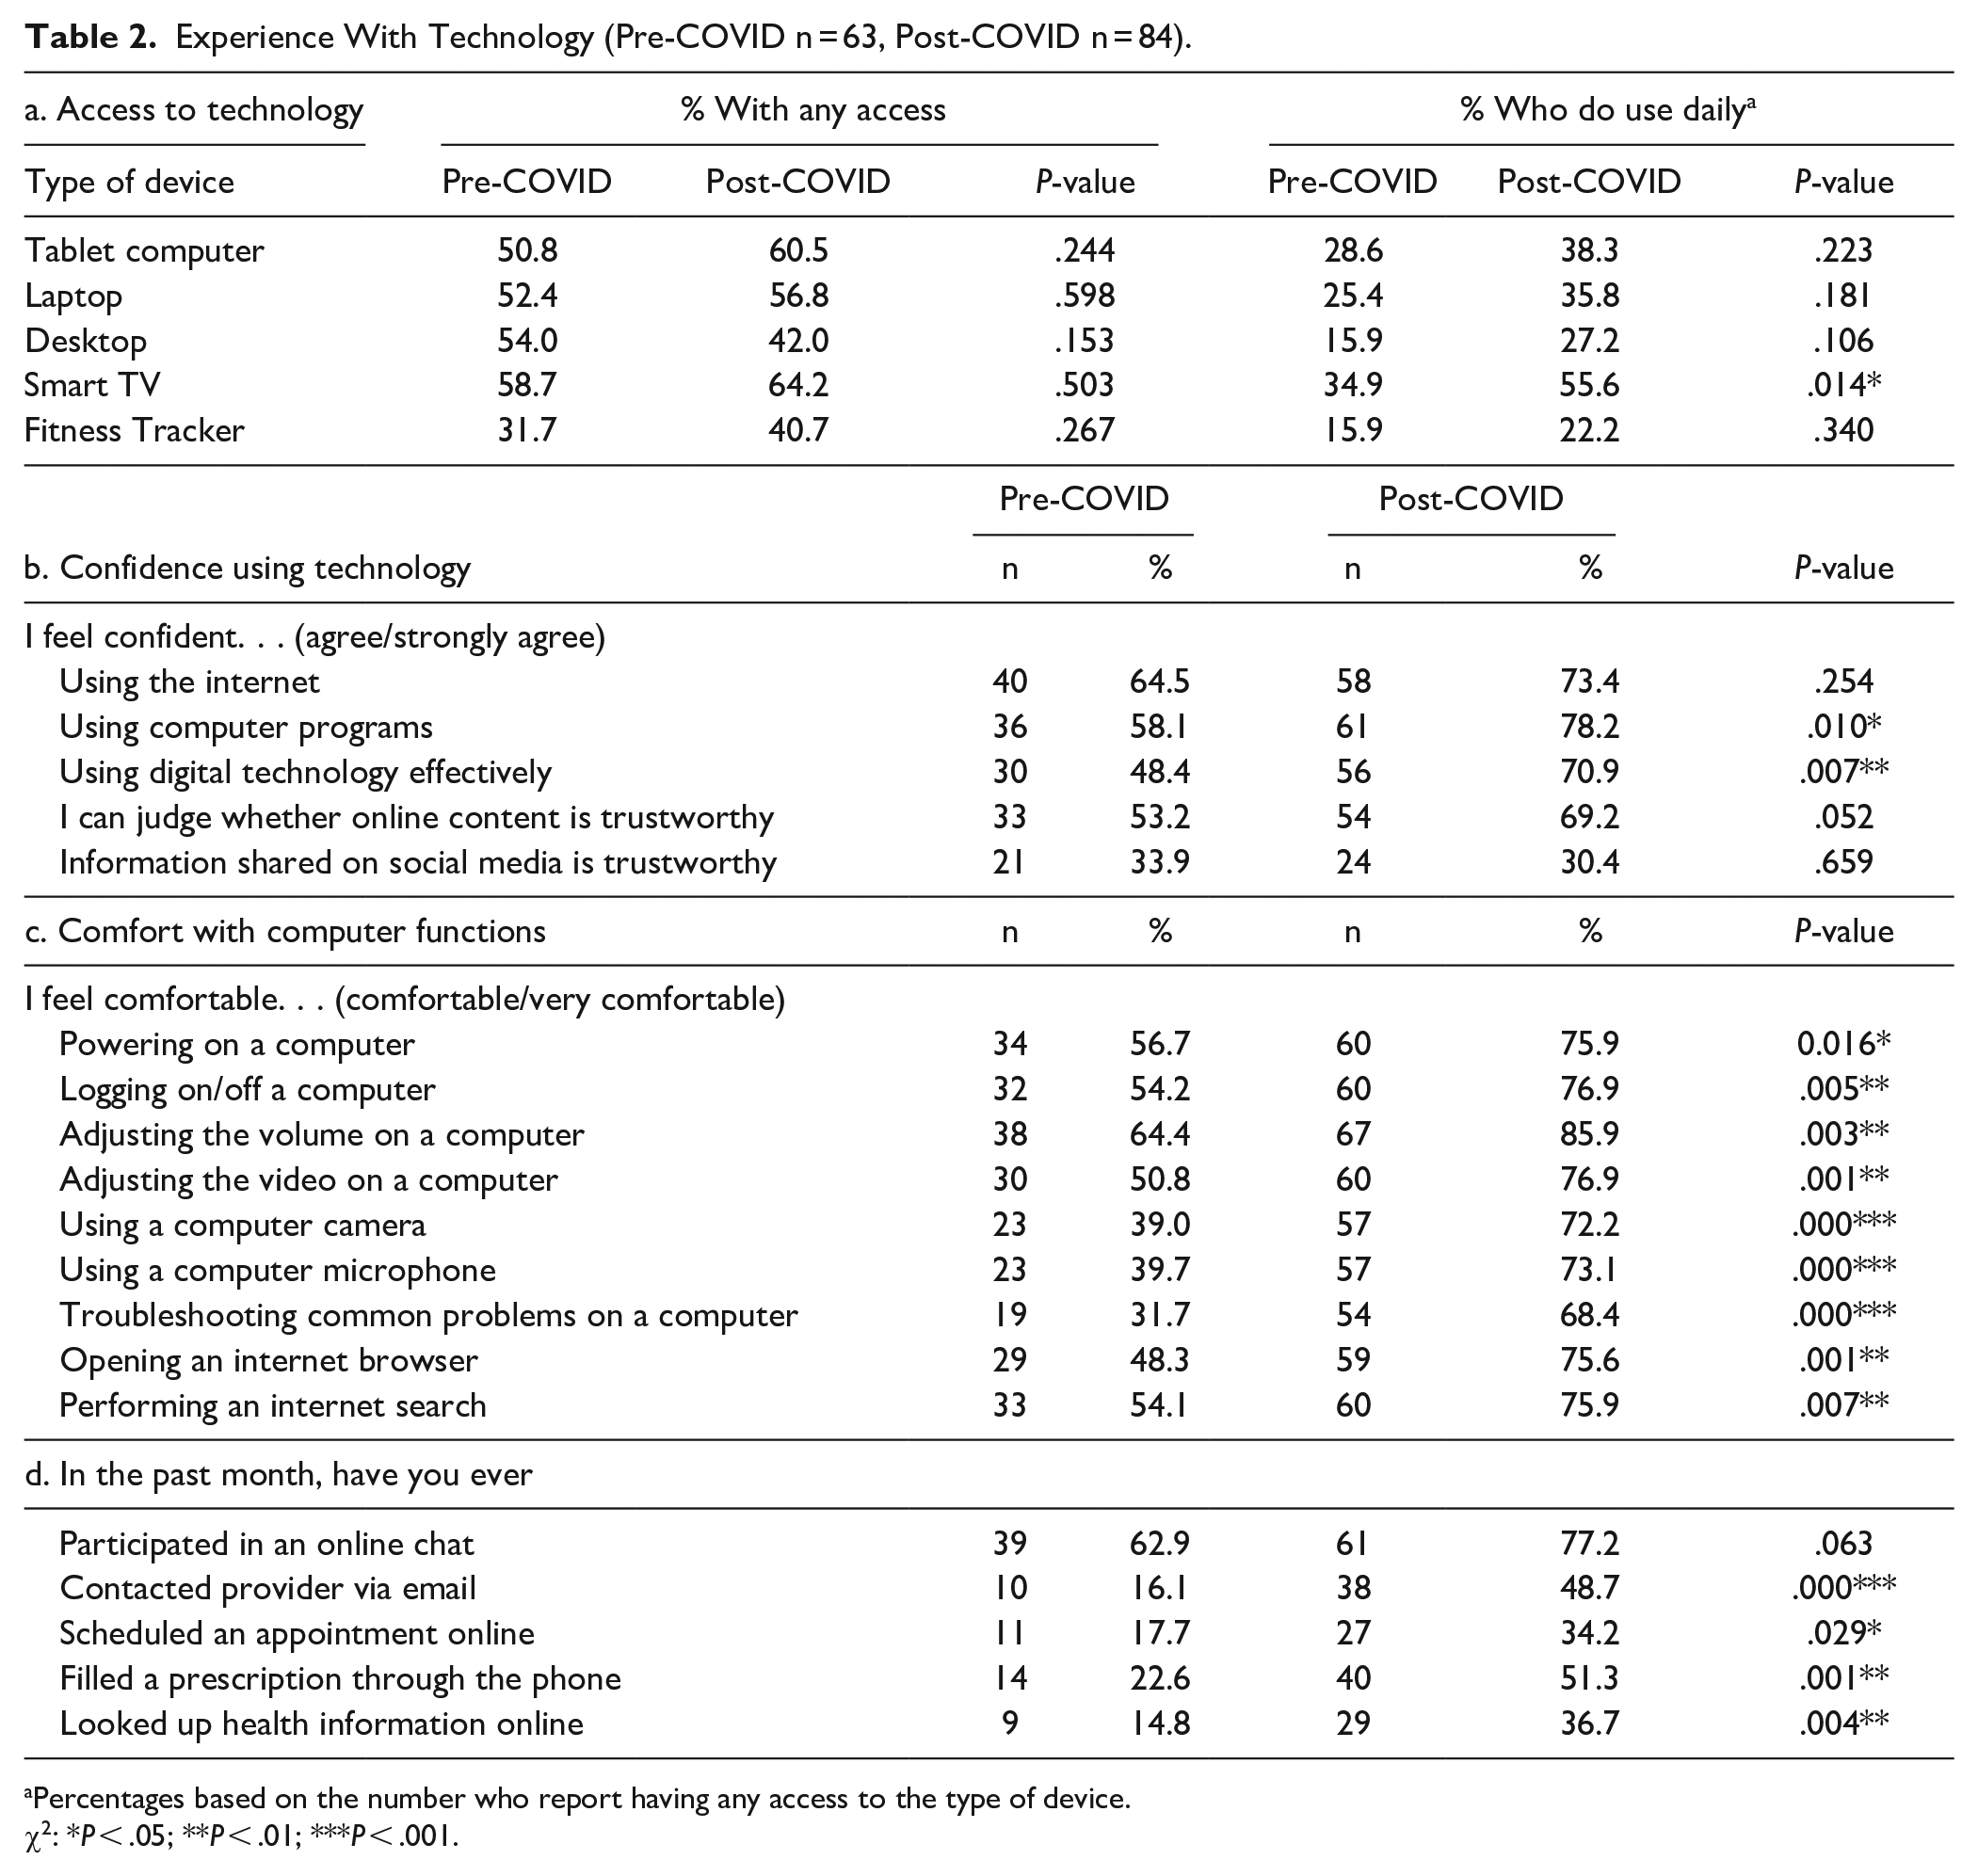
Percentages based on the number who report having any access to the type of device.
χ2: *P < .05; **P < .01; ***P < .001.
There were no significant differences in access to the Internet at home (approximately 66% overall), with 79.1% of those who reported any Internet access indicating use of broadband (ie, 52.8% of the entire sample had access to broadband services). Pre-COVID respondents were significantly less likely to own a cellular phone (81% vs 96.3%, P = .002), but similar percentages of participants who reported owning a phone indicated that their phone had Internet access (88.2% Pre-COVID vs 91.0% Post-COVID, P = .607). Overall, 80.6% of survey respondents reported owning a smartphone with Internet access.
Confidence using technology was moderate, with between 48% and 78% of respondents agreeing that they felt confident using the Internet, computers, and digital technology (Panel b). Levels of confidence were significantly higher in the Post-COVID cohort. The most significant differences were related to comfort using computer functions that would be pertinent for most telemedicine platforms (Panel c). Among Pre-COVID respondents, only 31% to 64% reported feeling “comfortable” or “very comfortable” performing these functions versus between 68% and 86% of Post-COVID respondents.
The use of electronic health management activities was relatively low overall (Panel d). More than half of the respondents in both periods said they had ever participated in an online chat, but fewer than half said they had ever contacted a provider by email, scheduled an appointment online, filled a prescription over the phone, or looked up health information online. Although these activities were significantly more common among Post-COVID respondents, fewer than half of respondents had used them across most categories of services.
Post-COVID participants expressed greater confidence using technology and greater comfort with computer functions. However, this did not translate into significant differences between cohorts in comfort with common telehealth functions. While greater than 50% of the survey respondents reported feeling “comfortable” or “very comfortable” using telehealth for these purposes, greater than one-quarter expressed some reservations.
We conducted bivariate analyses to determine which of the independent variables had a significant association with a respondent’s comfort with telehealth services (Table 3). Spanish-speaking respondents, women, and respondents with lower education levels and low health literacy were less comfortable with videoconferencing than their counterparts. Similarly, those with poorer health and those who had less trust in health systems expressed lower levels of comfort. Finally, there was a weak but significant positive association level between prior month’s use of telehealth-related technologies and comfort with videoconferencing (Pearson r = .243, P = .005). However, in a multivariate linear regression model that included all of these variables, only the prior month’s level of technology use attained significance (F[8,123] = 3.125, P = .003; t = 2.413, P = .017).
Significant Bivariate Associations with Comfort With Telehealth.

P < .05; **P < .01; ***P < .001.
Qualitative Study Findings
Problems with technology figured prominently as barriers to telehealth use. During one group session, several participants had difficulty joining the video teleconference and one participant’s line was so unstable that her comments could not be understood. Participants cited these types of problems as reasons for distrusting telehealth. As one participant stated, “This is a problem I was going to point out [computer issues and connectivity lags] make it hard to have clear communication, especially when you’re trying to share important information.” Participants noted that providers also frequently experience problems with Internet stability, which causes delays in initiating visits. One participant noted that she typically lost 10 min of every 45-min telepsychology visit due to breaks in Internet connectivity at the provider’s site.
Several participants stated that they found it difficult to explain the symptoms they were experiencing, which diminished their trust in the accuracy of the diagnoses and treatment they received. Trust was also an issue with respect to privacy. Participants believed that hackers already have access to patients’ medical histories and records, with 1 participant stating, “You don’t know who’s going to be listening in, watching, or recording your private interactions.” Even within one’s home, overcrowding in low-income households and the presence of children were seen as barriers to holding private conversations. One participant who works in a clinic that began providing telehealth services due to COVID noted that many of the clinic’s patients do not have private spaces in their homes to conduct a therapy session; many take the calls in their cars.
Participants noted a need for more technological investments and providing resources to teach people how to use technology and keep applications/systems up-to-date, particularly for individuals with language barriers. Some suggested offering technology classes to patients at clinics and hospitals, and several noted the need to make applications and programs more user-friendly and affordable. When asked how much they believed would be reasonable to pay for Internet and smartphone data plans, participants suggested a maximum of $100 to cover all family members. A consensus in 1 group was that “If these needs are not addressed, telehealth will not be beneficial to community members.” Participants noted that these changes would require a long-term commitment and resource investment; however, there was a sense that leaders, particularly those in the federal government, do not prioritize members of underserved communities.
Generally, there was a feeling that it is harder to understand health information provided during telehealth visits due to the lack of time and barriers to connecting emotionally with a provider. In reference to HIV testing, 1 young man stated, “I don’t want to be told over Zoom or Skype that I have a positive test result. I might just go jump off a bridge!.” Another participant described receiving care through telehealth as “. . .feel[ing] like a robot giving me a diagnosis.”
Discussion
Despite the relaxation of regulations during the COVID crisis, the pandemic has highlighted disparities in readiness to deploy telehealth technologies. Our findings are consistent with such ongoing disparities.27-30 Across several demographic and health characteristics, the more marginalized community members expressed lower comfort with telehealth service delivery. 31
Our study also supports research which suggests that a substantial percentage (up to 20%) of people in under-resourced communities lack access to basic technologies necessary for the successful deployment of telehealth services. 32 Even among individuals who use smartphone applications and other digital services daily, telehealth services can appear complicated and inadequate for the needs of patients. To ensure that services address their needs, it is necessary to bring members of underserved communities more directly into the development pipeline of telehealth technologies and infrastructure.33,34
The study’s timing provided an unexpected opportunity to compare experiences and attitudes relating to telehealth in 2 regulatory environments (ie, one with more restrictive telehealth rules and another that actively encouraged telehealth use). Although uptake of telehealth services increased with the federal government’s relaxation of regulatory barriers, efforts to sustain these gains will depend on permanent changes to the regulatory environment.12,35 However, consistent with the findings of Park et al 19 reductions in federal and state policy-related barriers were not associated with greater comfort with videoconferencing in our sample of respondents. The findings suggest that there is mistrust of the security of digital service platforms; respondents who questioned whether health systems keep patient information private were less comfortable with videoconferencing. The need to invest more resources to enhance system security is well-recognized to increase telehealth uptake. 36
Conclusion
The fact that prior-month use of telehealth-related technologies was the only significant predictor of comfort with videoconferencing supports study participants’ calls for more significant investments in telehealth technology deployment and education. However, the correlation between past months’ use and expressed comfort with telehealth was weak. Through the Infrastructure Investment and Jobs Act, the federal government has committed $65 billion to expand access to affordable broadband. 37 However, this type of investment by itself will not ensure the federal government’s goal of improving digital health equity. 38 We identified several common types of technology that patients may need to use to engage in the full range of telehealth services; increasing access to broadband will not suffice to ensure telehealth uptake. This study suggests that people in underserved communities may need assistance to increase participation in digital health solutions and, with increased experience and comfort with technology, may come more consistent use.
Limitations
The study’s findings may not be generalizable due to its relatively small sample size and the focus on a single urban community. Our recruitment strategy focused on health care providers within the Newark area that were originally established to provide prevention and care services for people at-risk for, or living with, HIV. In addition, recruitment was among patients who were seen for in-person visits. Therefore, study participants may not be representative of the larger population of the greater Newark area. Due to the small samples for the focus groups, we were not able to analyze the qualitative data across demographic groups.
Supplemental Material
sj-docx-1-jpc-10.1177_21501319221119692 – Supplemental material for Comfort With Telehealth Among Residents of an Underserved Urban Area
Supplemental material, sj-docx-1-jpc-10.1177_21501319221119692 for Comfort With Telehealth Among Residents of an Underserved Urban Area by Ann D. Bagchi, Kasny Damas, Nayeli Salazar de Noguera, Benjamin Melamed, Charles Menifield, Alok Baveja, Paul Weber and Shobha Swaminathan in Journal of Primary Care & Community Health
Footnotes
Acknowledgements
The authors would like to acknowledge the support of Drs. Diane Hill, Marc Klaphotz, and Abate Mammo, who contributed to the early phases of the project development.
Declaration of Conflicting Interests
The author(s) declared no potential conflicts of interest with respect to the research, authorship, and/or publication of this article.
Funding
The author(s) disclosed receipt of the following financial support for the research, authorship, and/or publication of this article: The study was supported through a Rutgers University-Newark Initiative for Multidisciplinary Research Teams (IMRT) Award.
Supplemental Material
Supplemental material for this article is available online.
References
Supplementary Material
Please find the following supplemental material available below.
For Open Access articles published under a Creative Commons License, all supplemental material carries the same license as the article it is associated with.
For non-Open Access articles published, all supplemental material carries a non-exclusive license, and permission requests for re-use of supplemental material or any part of supplemental material shall be sent directly to the copyright owner as specified in the copyright notice associated with the article.