
Abstract
Introduction/Objectives:
Many health systems screen patients for social determinants of health and refer patients with social needs to community organizations for assistance. Understanding how social determinants cluster together may help guide assistance programs.
Methods:
This study examined patients screened by The MetroHealth System in Cleveland, Ohio for 9 social determinants, including food insecurity, financial strain, transportation limitations, inability to pay for housing or utilities, intimate partner violence, social isolation, infrequent physical activity, daily stress, and lack of internet access. Clustering analyses were performed to determine which combination of social determinants occurred together more often than would be expected if each determinant were independent of each other.
Results:
Among 23 161 screened patients, there were 19 dyads, 13 triads, and one tetrad of social determinants that clustered together. The most prevalent triad of food insecurity, social isolation, and inability to pay for housing or utilities occurred among 1095 patients but would be expected to occur among 284 patients, for an observed/expected ratio of 3.85 (95% confidence interval 3.64-4.07). In multivariate analyses, younger, Black, and lower income patients were 2 to 3 times more likely to have this triad compared to older, White, and wealthier patients.
Conclusions:
Social determinants of health frequently cluster together, and such clustering is associated with patient demographic characteristics. Further work is needed to determine how social determinant clusters impact health and cost outcomes and to develop programs that can address multiple co-existing social needs.
Introduction
Because social determinants influence healthcare cost, quality, and other outcomes, many health systems are screening patients for social needs and referring them to community service organizations for assistance. 1 Topics addressed in screening may include food, housing, transportation, utilities, and exposure to interpersonal violence. Numerous research studies have been published describing these efforts.2 -4
By contrast, less is known about how social determinants of health cluster together. Understanding such clustering may help guide assistance programs if patients with multiple social determinants require more intensive or different services. A qualitative study found that having multiple social needs exacerbated chronic illnesses, reduced engagement with health care, and created a sense of disempowerment, isolation, depression, and stigmatization. 5 This study sought to examine how social determinants of health cluster together among patients of The MetroHealth System, a large safety-net health system in Cleveland, Ohio. The study also examines how demographic factors, including age, sex, race, ethnicity, and income, correlate with clustering.
Methods
In 2019, the MetroHealth System Institute for Health, Opportunity, Partnership, and Empowerment initiated a program to systematically screen patients for social determinants of health and refer patients with social needs to a network of approximately 140 community service organizations for assistance. Screening occurred (1) in-person or by telephone through contact with a care coordinator or other staff person or (2) online through a MyChart patient portal questionnaire triggered by an appointment for a primary care, OB-GYN, or geriatrics visit. The screening questionnaire asked about 9 topics, including food insecurity, financial strain, transportation limitations, inability to pay for housing or utilities, intimate partner violence, social isolation, infrequent physical activity, daily stress, and lack of internet access. The questions were obtained from previously validated surveys. 4
This study reports on results from patients screened between May 2019 and September 2021. Pre-defined criteria for being at risk for each social determinant were used to categorize questionnaire responses. For example, patients who answered often or sometimes to either of the 2 food security questions were categorized as being food insecure. 4 Patient demographic variables (age, gender, self-reported race/ethnicity, home address) were obtained from electronic medical records. Census data were used to determine the median annual income for each patient’s census tract. This study was approved by the Institutional Review Board of the MetroHealth System.
Association rule mining was used to identify combinations of social determinants of health that co-occurred together. Association rule mining is a machine learning method originally developed to find items commonly purchased together in the same transaction, but has since been extended to other applications, including health and medicine.6,7 All clusters of social determinants that occurred in at least 2% of the study population were identified. For each cluster, the observed/expected ratio was calculated as the observed count divided by the expected count of the cluster if each social determinant within the cluster were statistically independent of each other. For example, if 20% of patients are unable to pay for housing or utilities and 40% have social isolation, then 8% (20% × 4 0%) would be expected to have both determinants if they were independent of each other. Next, a multivariable log-binomial regression model was fitted for each cluster, with the presence of the cluster as the dependent variable, and age, gender, race, ethnicity and income as independent variables to estimate adjusted prevalence ratios and 95% confidence intervals. 8 Unadjusted prevalence ratios were estimated similarly, but with each independent variable modeled separately. All analyses were conducted using R version 4.1.2 (Vienna, Austria) and the R package “arules” version 1.7.3. 9
Results
A total of 23 161 patients completed the screening questionnaire during the study period. The mean age of screened patients was 51 years, a majority were female, and most were White or Black (Table 1). The most common social determinants of health were social isolation, infrequent physical activity, and inability to pay for housing or utilities. Of the 23 161 patients, 34.5% had no social determinants of health, 31.1% had only one determinant, 18.2% had 2 determinants, 8.5% had 3 determinants, and 7.6% had 4 or more determinants.
Characteristics of Screened Patients (n = 23 161).*
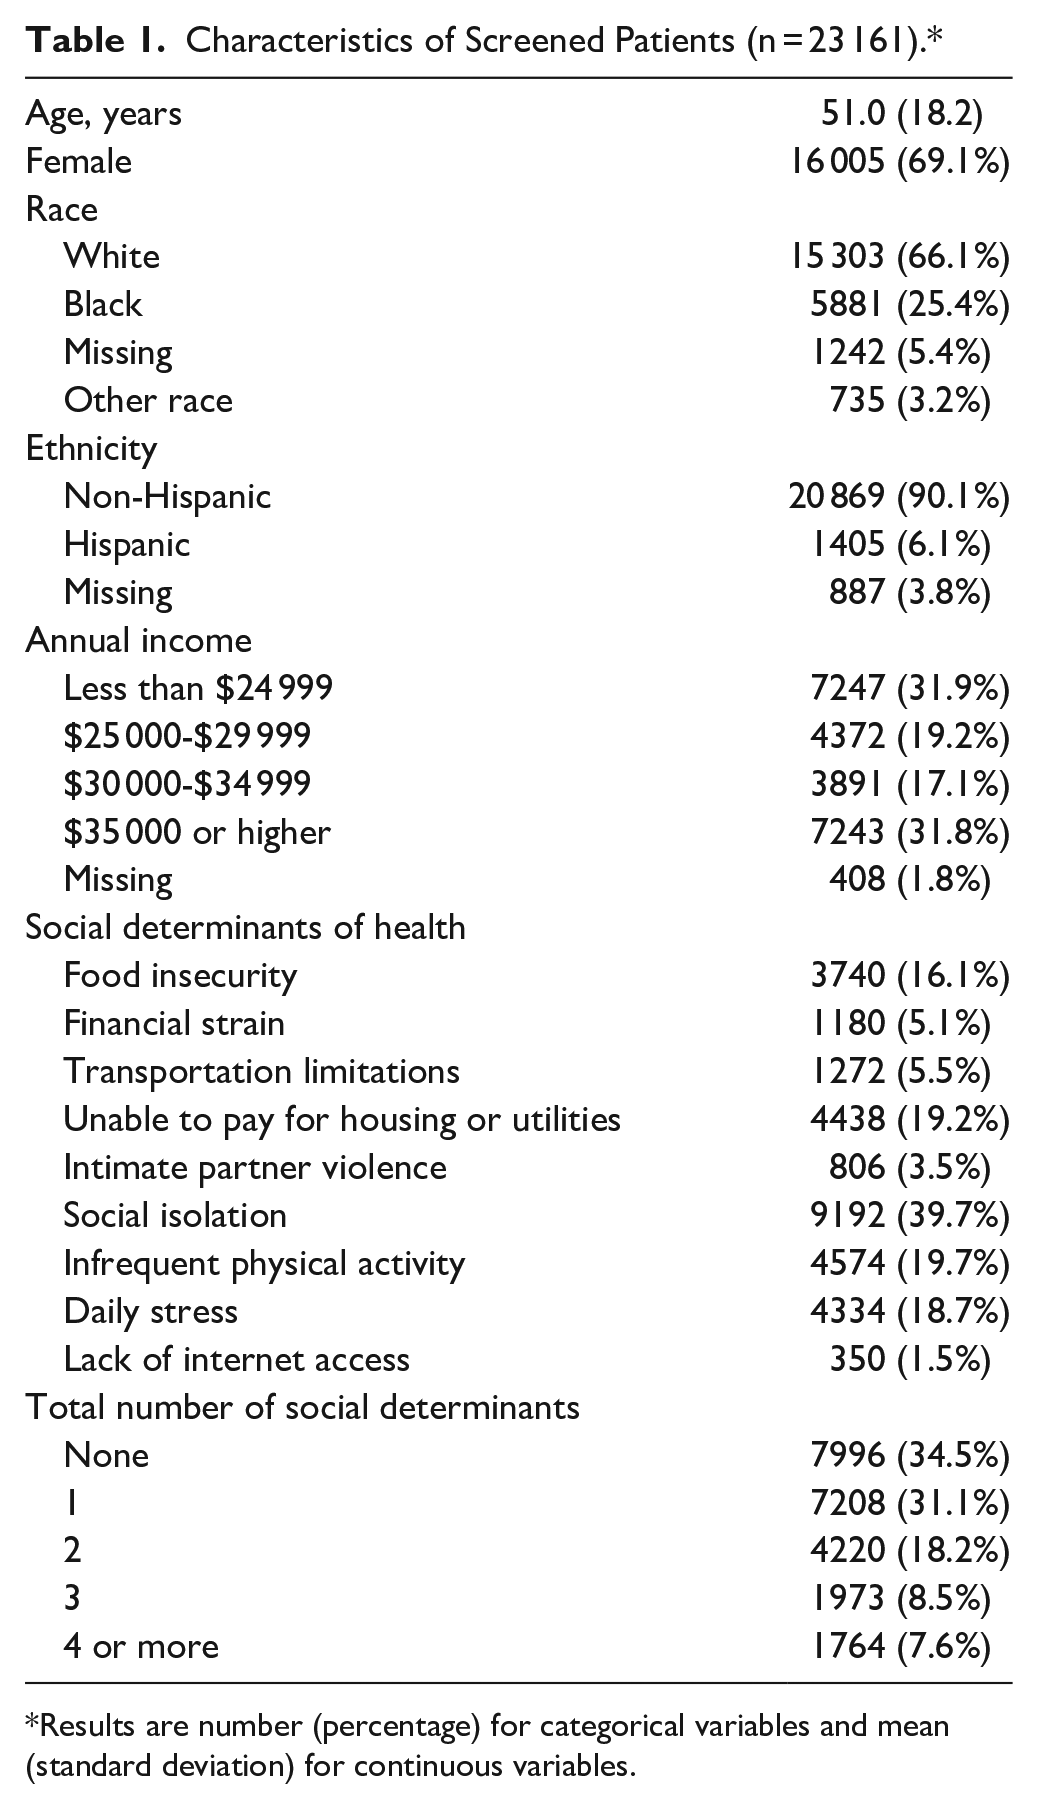
Results are number (percentage) for categorical variables and mean (standard deviation) for continuous variables.
Many social determinants occurred together more often than if each determinant were independent of each other. There were 19 dyads, 13 triads, and 1 tetrad of social determinants that were present among more than 2% of patients (Table 2). The most prevalent triad (food insecurity, social isolation, and inability to pay for housing or utilities) occurred among 1095 patients but would be expected to occur among 284 patients, for an observed/expected ratio of 3.85 (95% confidence interval 3.64-4.07). Clusters with particularly high observed/expected ratios included the triad of financial strain, food insecurity, and housing or utilities (ratio 16.54); the triad of food insecurity, transportation, and housing or utilities (ratio 13.52); the triad of financial strain, food insecurity, and daily stress (ratio 14.39); and the tetrad of food insecurity, social isolation, daily stress, and housing or utilities (ratio 9.92).
Combination of Social Determinants of Health Present Among More Than 2% of Patients.

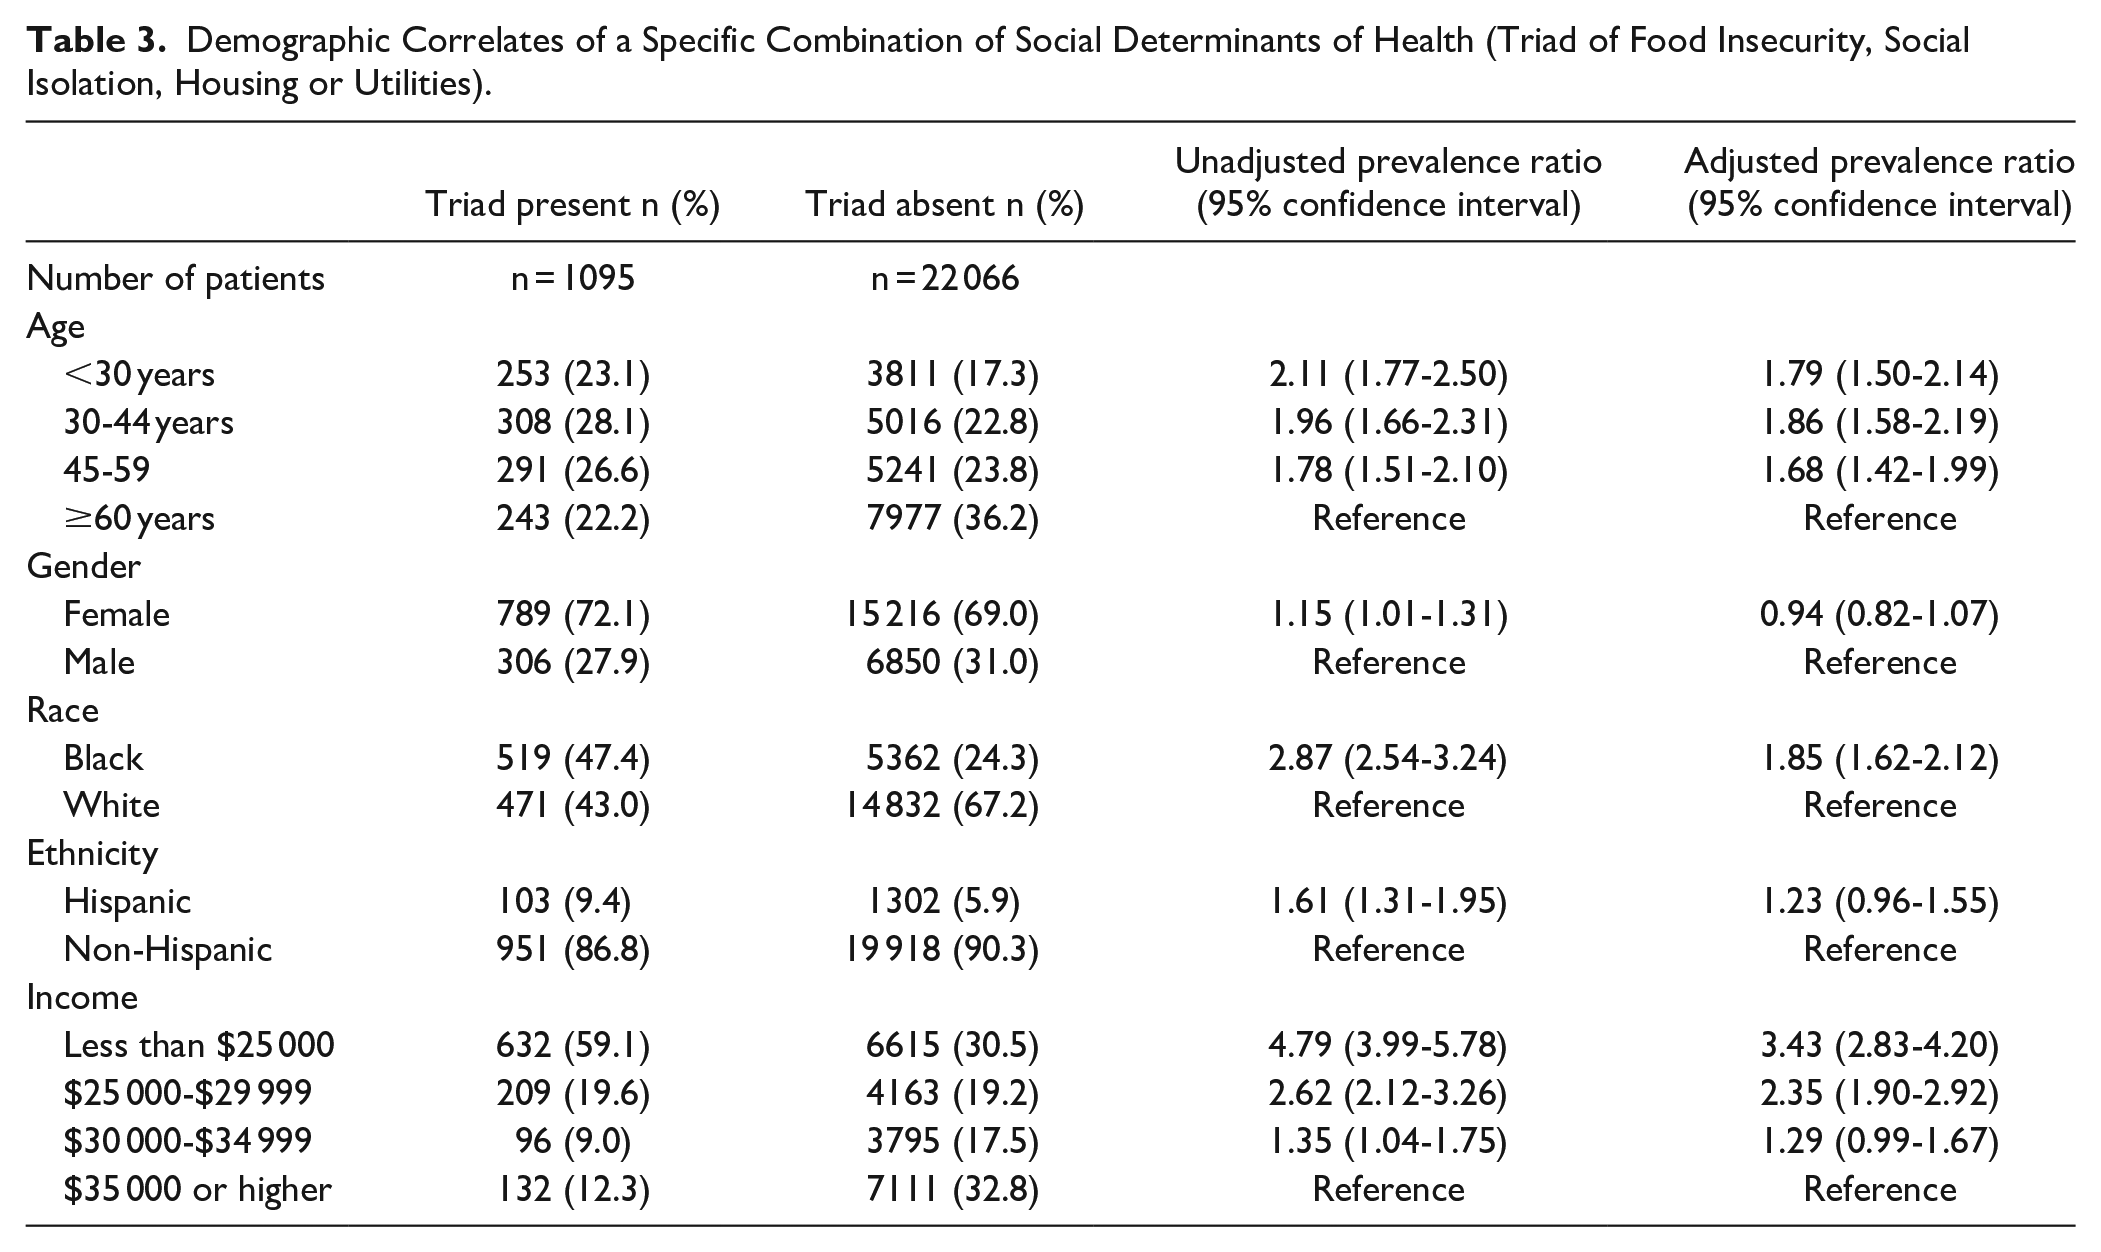
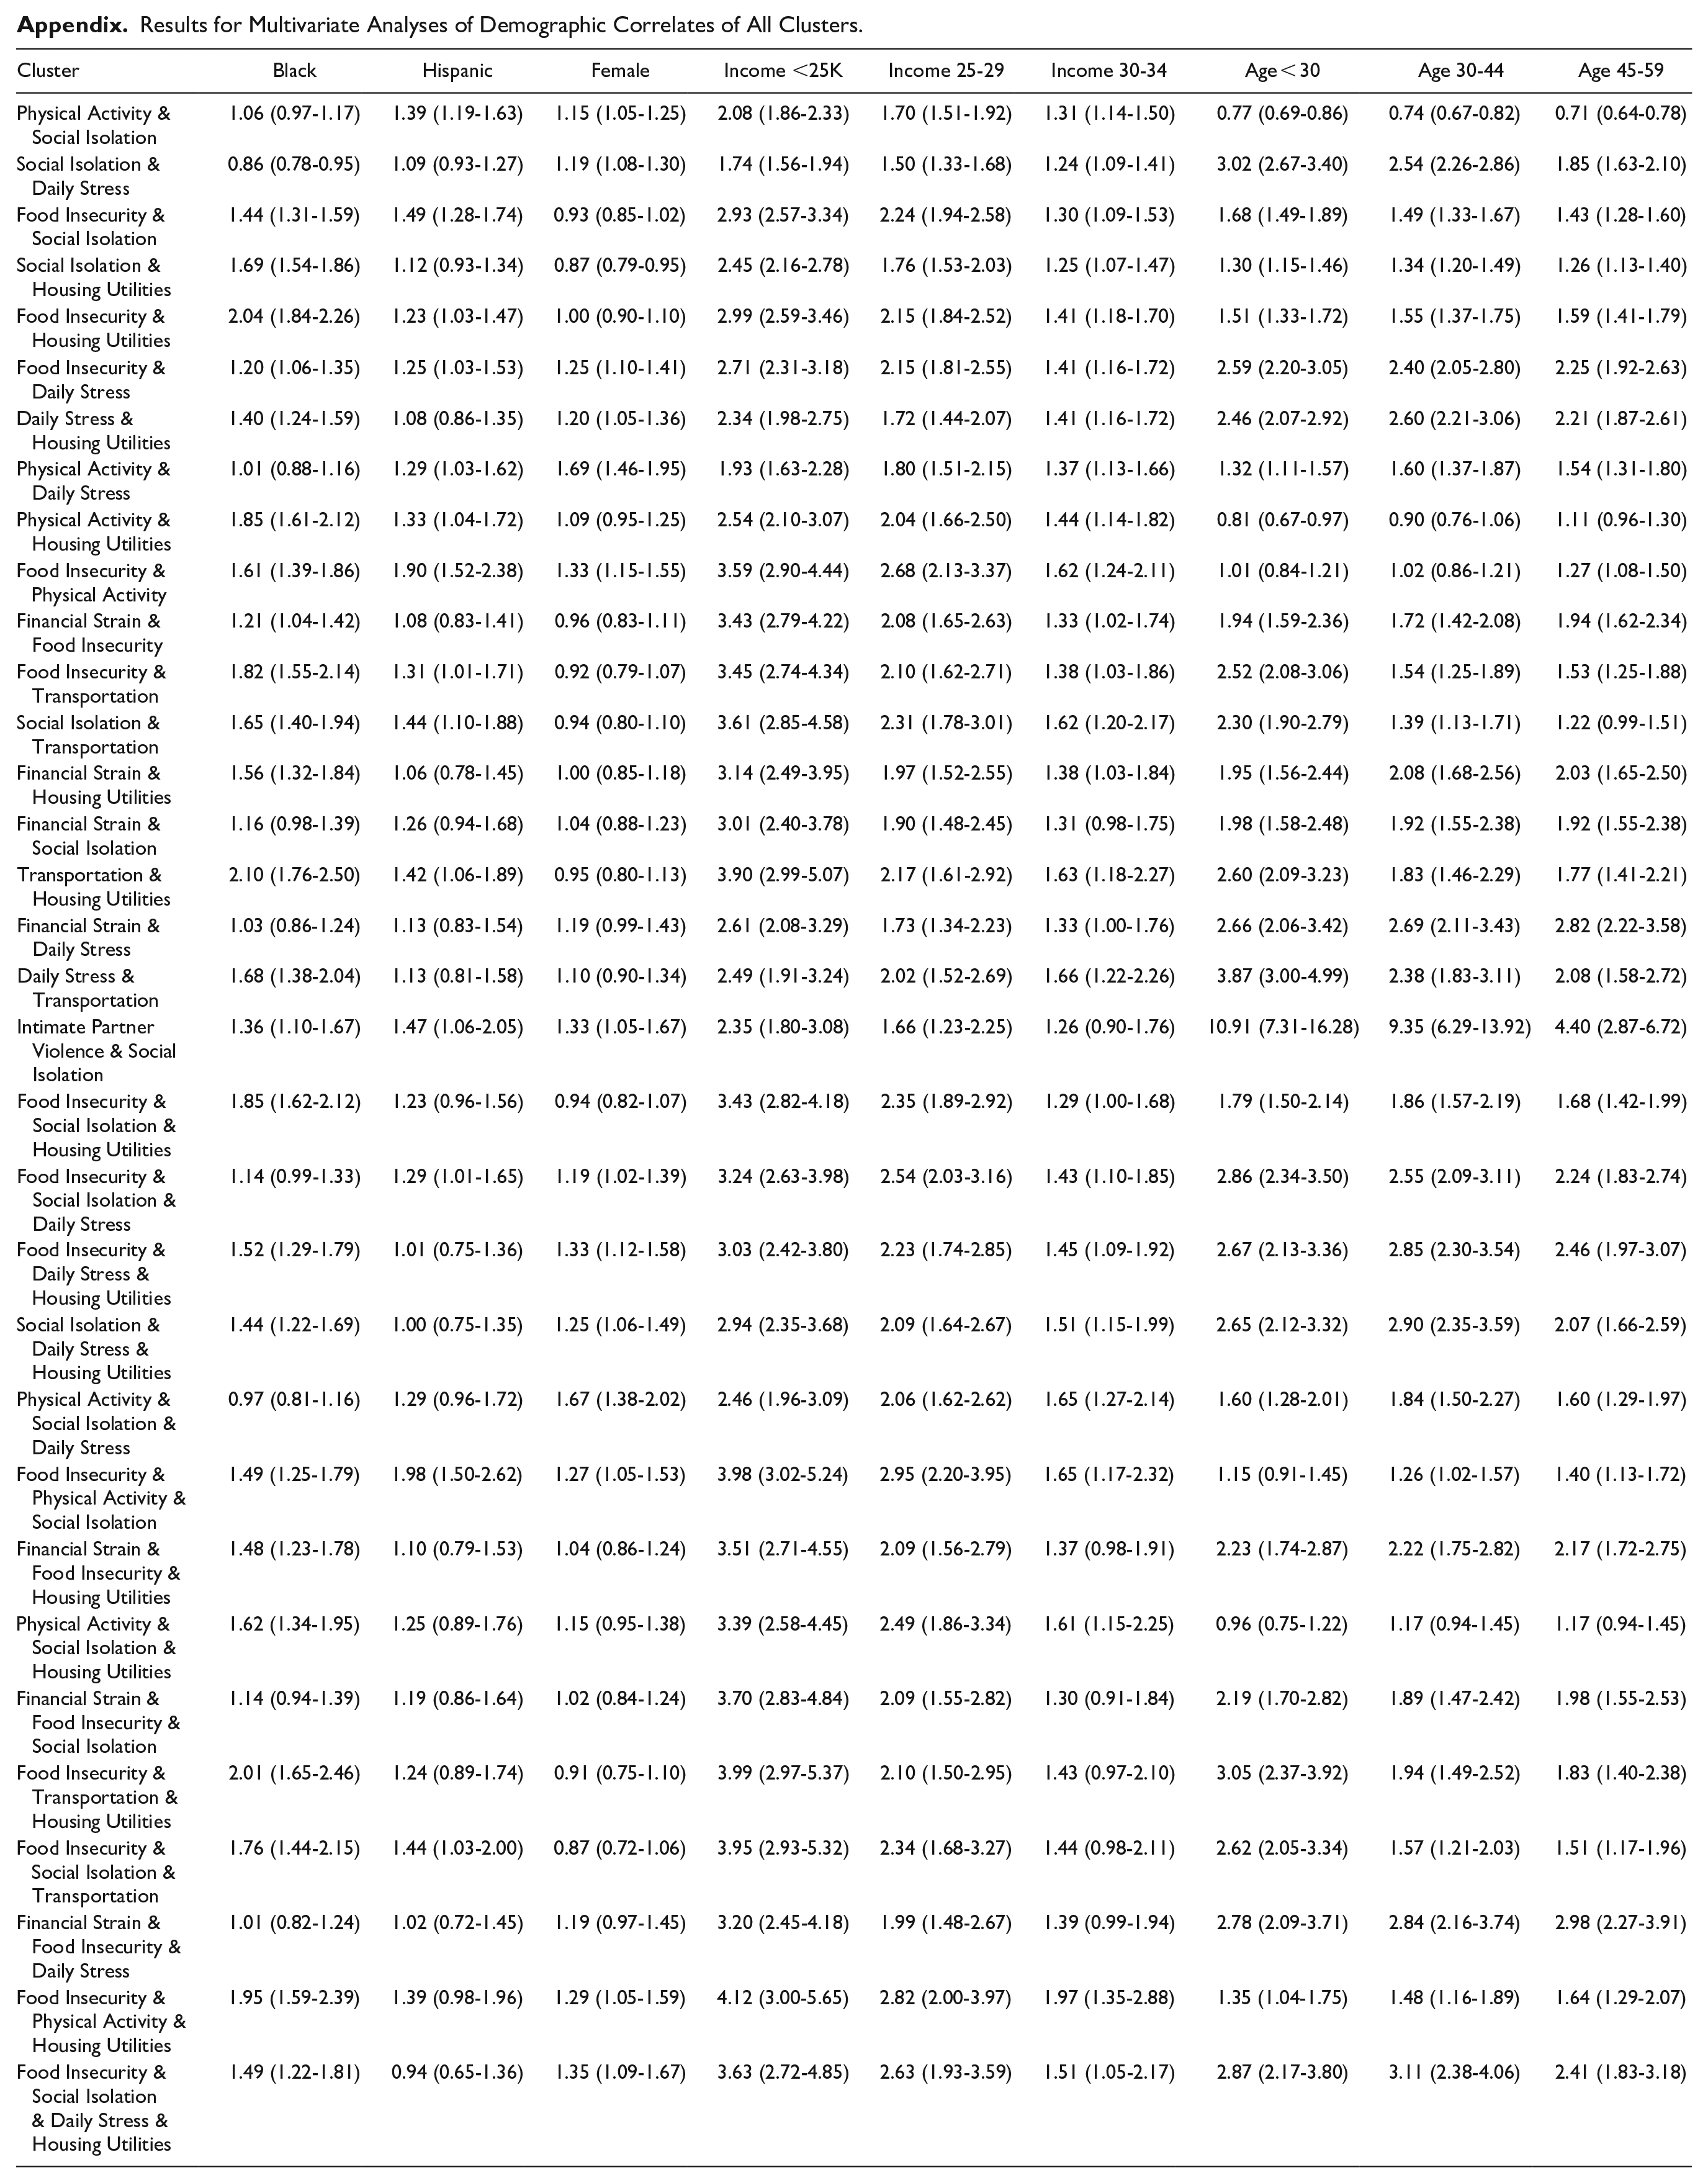
In multivariate analyses, younger, Black, and lower income patients were 2 to 3 times more likely to have the triad of food insecurity, social isolation, and daily stress compared to older, White, and wealthier patients (Table 3). Patients residing in census tracts with median annual incomes <$25 000 were 3.43 (95% confidence interval 2.83-4.20) times more likely than patients residing in census tracts with median annual incomes ≥$35 000 to have this triad. Results for multivariate analyses of demographic correlates of all clusters are included in the Appendix.
Demographic Correlates of a Specific Combination of Social Determinants of Health (Triad of Food Insecurity, Social Isolation, Housing or Utilities).
Discussion
This cross-sectional study found that social determinants of health frequently cluster together, particularly among younger, minority, and lower income patients. These findings are consistent with previous work indicating that sizeable numbers of patients have more than 1 social determinant. A study based on the National Health and Nutrition Examination Survey (NHANES) concluded that 25% of American adults had 1 social determinant while 30% had 2 or more determinants. 10 Another study of incident stroke estimated that about 7400 participants had 1 social determinant while 12 000 had 2 or more determinants. 11 A novel aspect of our study is identifying clusters of social determinants that occur together more often than would be expected if each determinant were independent of each other. Other strengths of our study include a large sample size; inclusion of substantial numbers of White, Black, and Hispanic patients; and use of standardized questions assessing 9 different social determinants.
Viewing social determinants in isolation may lead to interventions that are most appropriate to the subset of patients who have a single social need. However, simply bundling interventions for multiple social needs may not work unless interactions among clustered determinants are better understood. 12 For example, interventions to improve social isolation may cause harm if a patient is also experiencing intimate partner violence. By contrast, the triad of physical inactivity, social isolation, and daily stress may be addressable with a single intervention such as joining a group physical activity. Health systems and community service organizations should determine how to tailor assistance for patients with specific clusters of social determinants. Researchers should determine the impact of clustering on health and cost outcomes. A study of lumbar spine surgery patients found that specific clusters of social determinants were associated with decreased pain and increased satisfaction and quality of life. 13
Several limitations must be considered in interpreting these results. This study focused on a single health care system, relied on self-reported data, and used census tracts to estimate annual income. Patients with difficulties such as transportation limitations or lack of internet access may have been less likely to participate in in-person or online screening for social determinants of health. The COVID-19 pandemic likely influenced some social determinants such as social isolation.
In conclusion, social determinants of health frequently cluster together, and such clustering is associated with patient demographic characteristics. Further work is needed i) to determine how social determinant clusters impact health and cost outcomes and ii) to develop programs that can address multiple co-existing social needs.
Footnotes
Appendix
Results for Multivariate Analyses of Demographic Correlates of All Clusters.
| Cluster | Black | Hispanic | Female | Income <25K | Income 25-29 | Income 30-34 | Age < 30 | Age 30-44 | Age 45-59 |
|---|---|---|---|---|---|---|---|---|---|
| Physical Activity & Social Isolation | 1.06 (0.97-1.17) | 1.39 (1.19-1.63) | 1.15 (1.05-1.25) | 2.08 (1.86-2.33) | 1.70 (1.51-1.92) | 1.31 (1.14-1.50) | 0.77 (0.69-0.86) | 0.74 (0.67-0.82) | 0.71 (0.64-0.78) |
| Social Isolation & Daily Stress | 0.86 (0.78-0.95) | 1.09 (0.93-1.27) | 1.19 (1.08-1.30) | 1.74 (1.56-1.94) | 1.50 (1.33-1.68) | 1.24 (1.09-1.41) | 3.02 (2.67-3.40) | 2.54 (2.26-2.86) | 1.85 (1.63-2.10) |
| Food Insecurity & Social Isolation | 1.44 (1.31-1.59) | 1.49 (1.28-1.74) | 0.93 (0.85-1.02) | 2.93 (2.57-3.34) | 2.24 (1.94-2.58) | 1.30 (1.09-1.53) | 1.68 (1.49-1.89) | 1.49 (1.33-1.67) | 1.43 (1.28-1.60) |
| Social Isolation & Housing Utilities | 1.69 (1.54-1.86) | 1.12 (0.93-1.34) | 0.87 (0.79-0.95) | 2.45 (2.16-2.78) | 1.76 (1.53-2.03) | 1.25 (1.07-1.47) | 1.30 (1.15-1.46) | 1.34 (1.20-1.49) | 1.26 (1.13-1.40) |
| Food Insecurity & Housing Utilities | 2.04 (1.84-2.26) | 1.23 (1.03-1.47) | 1.00 (0.90-1.10) | 2.99 (2.59-3.46) | 2.15 (1.84-2.52) | 1.41 (1.18-1.70) | 1.51 (1.33-1.72) | 1.55 (1.37-1.75) | 1.59 (1.41-1.79) |
| Food Insecurity & Daily Stress | 1.20 (1.06-1.35) | 1.25 (1.03-1.53) | 1.25 (1.10-1.41) | 2.71 (2.31-3.18) | 2.15 (1.81-2.55) | 1.41 (1.16-1.72) | 2.59 (2.20-3.05) | 2.40 (2.05-2.80) | 2.25 (1.92-2.63) |
| Daily Stress & Housing Utilities | 1.40 (1.24-1.59) | 1.08 (0.86-1.35) | 1.20 (1.05-1.36) | 2.34 (1.98-2.75) | 1.72 (1.44-2.07) | 1.41 (1.16-1.72) | 2.46 (2.07-2.92) | 2.60 (2.21-3.06) | 2.21 (1.87-2.61) |
| Physical Activity & Daily Stress | 1.01 (0.88-1.16) | 1.29 (1.03-1.62) | 1.69 (1.46-1.95) | 1.93 (1.63-2.28) | 1.80 (1.51-2.15) | 1.37 (1.13-1.66) | 1.32 (1.11-1.57) | 1.60 (1.37-1.87) | 1.54 (1.31-1.80) |
| Physical Activity & Housing Utilities | 1.85 (1.61-2.12) | 1.33 (1.04-1.72) | 1.09 (0.95-1.25) | 2.54 (2.10-3.07) | 2.04 (1.66-2.50) | 1.44 (1.14-1.82) | 0.81 (0.67-0.97) | 0.90 (0.76-1.06) | 1.11 (0.96-1.30) |
| Food Insecurity & Physical Activity | 1.61 (1.39-1.86) | 1.90 (1.52-2.38) | 1.33 (1.15-1.55) | 3.59 (2.90-4.44) | 2.68 (2.13-3.37) | 1.62 (1.24-2.11) | 1.01 (0.84-1.21) | 1.02 (0.86-1.21) | 1.27 (1.08-1.50) |
| Financial Strain & Food Insecurity | 1.21 (1.04-1.42) | 1.08 (0.83-1.41) | 0.96 (0.83-1.11) | 3.43 (2.79-4.22) | 2.08 (1.65-2.63) | 1.33 (1.02-1.74) | 1.94 (1.59-2.36) | 1.72 (1.42-2.08) | 1.94 (1.62-2.34) |
| Food Insecurity & Transportation | 1.82 (1.55-2.14) | 1.31 (1.01-1.71) | 0.92 (0.79-1.07) | 3.45 (2.74-4.34) | 2.10 (1.62-2.71) | 1.38 (1.03-1.86) | 2.52 (2.08-3.06) | 1.54 (1.25-1.89) | 1.53 (1.25-1.88) |
| Social Isolation & Transportation | 1.65 (1.40-1.94) | 1.44 (1.10-1.88) | 0.94 (0.80-1.10) | 3.61 (2.85-4.58) | 2.31 (1.78-3.01) | 1.62 (1.20-2.17) | 2.30 (1.90-2.79) | 1.39 (1.13-1.71) | 1.22 (0.99-1.51) |
| Financial Strain & Housing Utilities | 1.56 (1.32-1.84) | 1.06 (0.78-1.45) | 1.00 (0.85-1.18) | 3.14 (2.49-3.95) | 1.97 (1.52-2.55) | 1.38 (1.03-1.84) | 1.95 (1.56-2.44) | 2.08 (1.68-2.56) | 2.03 (1.65-2.50) |
| Financial Strain & Social Isolation | 1.16 (0.98-1.39) | 1.26 (0.94-1.68) | 1.04 (0.88-1.23) | 3.01 (2.40-3.78) | 1.90 (1.48-2.45) | 1.31 (0.98-1.75) | 1.98 (1.58-2.48) | 1.92 (1.55-2.38) | 1.92 (1.55-2.38) |
| Transportation & Housing Utilities | 2.10 (1.76-2.50) | 1.42 (1.06-1.89) | 0.95 (0.80-1.13) | 3.90 (2.99-5.07) | 2.17 (1.61-2.92) | 1.63 (1.18-2.27) | 2.60 (2.09-3.23) | 1.83 (1.46-2.29) | 1.77 (1.41-2.21) |
| Financial Strain & Daily Stress | 1.03 (0.86-1.24) | 1.13 (0.83-1.54) | 1.19 (0.99-1.43) | 2.61 (2.08-3.29) | 1.73 (1.34-2.23) | 1.33 (1.00-1.76) | 2.66 (2.06-3.42) | 2.69 (2.11-3.43) | 2.82 (2.22-3.58) |
| Daily Stress & Transportation | 1.68 (1.38-2.04) | 1.13 (0.81-1.58) | 1.10 (0.90-1.34) | 2.49 (1.91-3.24) | 2.02 (1.52-2.69) | 1.66 (1.22-2.26) | 3.87 (3.00-4.99) | 2.38 (1.83-3.11) | 2.08 (1.58-2.72) |
| Intimate Partner Violence & Social Isolation | 1.36 (1.10-1.67) | 1.47 (1.06-2.05) | 1.33 (1.05-1.67) | 2.35 (1.80-3.08) | 1.66 (1.23-2.25) | 1.26 (0.90-1.76) | 10.91 (7.31-16.28) | 9.35 (6.29-13.92) | 4.40 (2.87-6.72) |
| Food Insecurity & Social Isolation & Housing Utilities | 1.85 (1.62-2.12) | 1.23 (0.96-1.56) | 0.94 (0.82-1.07) | 3.43 (2.82-4.18) | 2.35 (1.89-2.92) | 1.29 (1.00-1.68) | 1.79 (1.50-2.14) | 1.86 (1.57-2.19) | 1.68 (1.42-1.99) |
| Food Insecurity & Social Isolation & Daily Stress | 1.14 (0.99-1.33) | 1.29 (1.01-1.65) | 1.19 (1.02-1.39) | 3.24 (2.63-3.98) | 2.54 (2.03-3.16) | 1.43 (1.10-1.85) | 2.86 (2.34-3.50) | 2.55 (2.09-3.11) | 2.24 (1.83-2.74) |
| Food Insecurity & Daily Stress & Housing Utilities | 1.52 (1.29-1.79) | 1.01 (0.75-1.36) | 1.33 (1.12-1.58) | 3.03 (2.42-3.80) | 2.23 (1.74-2.85) | 1.45 (1.09-1.92) | 2.67 (2.13-3.36) | 2.85 (2.30-3.54) | 2.46 (1.97-3.07) |
| Social Isolation & Daily Stress & Housing Utilities | 1.44 (1.22-1.69) | 1.00 (0.75-1.35) | 1.25 (1.06-1.49) | 2.94 (2.35-3.68) | 2.09 (1.64-2.67) | 1.51 (1.15-1.99) | 2.65 (2.12-3.32) | 2.90 (2.35-3.59) | 2.07 (1.66-2.59) |
| Physical Activity & Social Isolation & Daily Stress | 0.97 (0.81-1.16) | 1.29 (0.96-1.72) | 1.67 (1.38-2.02) | 2.46 (1.96-3.09) | 2.06 (1.62-2.62) | 1.65 (1.27-2.14) | 1.60 (1.28-2.01) | 1.84 (1.50-2.27) | 1.60 (1.29-1.97) |
| Food Insecurity & Physical Activity & Social Isolation | 1.49 (1.25-1.79) | 1.98 (1.50-2.62) | 1.27 (1.05-1.53) | 3.98 (3.02-5.24) | 2.95 (2.20-3.95) | 1.65 (1.17-2.32) | 1.15 (0.91-1.45) | 1.26 (1.02-1.57) | 1.40 (1.13-1.72) |
| Financial Strain & Food Insecurity & Housing Utilities | 1.48 (1.23-1.78) | 1.10 (0.79-1.53) | 1.04 (0.86-1.24) | 3.51 (2.71-4.55) | 2.09 (1.56-2.79) | 1.37 (0.98-1.91) | 2.23 (1.74-2.87) | 2.22 (1.75-2.82) | 2.17 (1.72-2.75) |
| Physical Activity & Social Isolation & Housing Utilities | 1.62 (1.34-1.95) | 1.25 (0.89-1.76) | 1.15 (0.95-1.38) | 3.39 (2.58-4.45) | 2.49 (1.86-3.34) | 1.61 (1.15-2.25) | 0.96 (0.75-1.22) | 1.17 (0.94-1.45) | 1.17 (0.94-1.45) |
| Financial Strain & Food Insecurity & Social Isolation | 1.14 (0.94-1.39) | 1.19 (0.86-1.64) | 1.02 (0.84-1.24) | 3.70 (2.83-4.84) | 2.09 (1.55-2.82) | 1.30 (0.91-1.84) | 2.19 (1.70-2.82) | 1.89 (1.47-2.42) | 1.98 (1.55-2.53) |
| Food Insecurity & Transportation & Housing Utilities | 2.01 (1.65-2.46) | 1.24 (0.89-1.74) | 0.91 (0.75-1.10) | 3.99 (2.97-5.37) | 2.10 (1.50-2.95) | 1.43 (0.97-2.10) | 3.05 (2.37-3.92) | 1.94 (1.49-2.52) | 1.83 (1.40-2.38) |
| Food Insecurity & Social Isolation & Transportation | 1.76 (1.44-2.15) | 1.44 (1.03-2.00) | 0.87 (0.72-1.06) | 3.95 (2.93-5.32) | 2.34 (1.68-3.27) | 1.44 (0.98-2.11) | 2.62 (2.05-3.34) | 1.57 (1.21-2.03) | 1.51 (1.17-1.96) |
| Financial Strain & Food Insecurity & Daily Stress | 1.01 (0.82-1.24) | 1.02 (0.72-1.45) | 1.19 (0.97-1.45) | 3.20 (2.45-4.18) | 1.99 (1.48-2.67) | 1.39 (0.99-1.94) | 2.78 (2.09-3.71) | 2.84 (2.16-3.74) | 2.98 (2.27-3.91) |
| Food Insecurity & Physical Activity & Housing Utilities | 1.95 (1.59-2.39) | 1.39 (0.98-1.96) | 1.29 (1.05-1.59) | 4.12 (3.00-5.65) | 2.82 (2.00-3.97) | 1.97 (1.35-2.88) | 1.35 (1.04-1.75) | 1.48 (1.16-1.89) | 1.64 (1.29-2.07) |
| Food Insecurity & Social Isolation & Daily Stress & Housing Utilities | 1.49 (1.22-1.81) | 0.94 (0.65-1.36) | 1.35 (1.09-1.67) | 3.63 (2.72-4.85) | 2.63 (1.93-3.59) | 1.51 (1.05-2.17) | 2.87 (2.17-3.80) | 3.11 (2.38-4.06) | 2.41 (1.83-3.18) |
Declaration of Conflicting Interests
The author(s) declared no potential conflicts of interest with respect to the research, authorship, and/or publication of this article.
Funding
The author(s) received no financial support for the research, authorship, and/or publication of this article.