
Abstract
Failure of patients to keep scheduled appointments (no-show) leads to reduced patient-physician continuity, wasted physician time, decreased efficiency, and higher use of resources, which results in reduced health care quality.1,2 It has been suggested that lower follow-up rates are also associated with worse clinical outcomes in hypertensive or diabetic patients.3-5 Several methods have been studied to decrease no-show rates, including mail, telephone, or short message system (SMS) reminder systems; advanced or same-day scheduling systems, which promote patient-driven scheduling; and contracting with patients.6-9 Of these, SMS reminder systems have increasingly been used due to their applicability and financial feasibility. However, more efforts are needed to minimize no-shows given their high therapeutic, educational, and financial burdens. 10
Although in some circumstances we limit prescription refills, such as isoniazid therapy for latent tuberculosis, to increase adherence to the treatment regimen and follow-up, 11 no past study has evaluated whether such a strategy improves compliance with the follow-up appointment in primary care settings. At our institution, we typically prescribe medications with refills for a total supply of 6 months at any physician visit independent of clinical context. We also have observed that patients who previously failed to keep scheduled appointments frequently come to the clinic when they need prescriptions. Therefore, we hypothesized that providing fewer prescription refills may improve compliance with follow-up visits. In this study, we assessed whether reducing the number of prescription refills would improve patient compliance with the next appointment and thereby improve continuity of care.
Methods
Study Design and Participants
This study retrospectively analyzed an intervention conducted at Beth Israel Medical Center, a teaching continuity clinic located in Manhattan, New York. The general internal medicine clinic is staffed by 18 attending physicians, serving a predominantly underserved population in the area. The number of annual patient visits is approximately 50,000.
We recruited 8 attending physicians from the clinic in December 2011. The physicians were introduced to a new prescribing strategy (described below) and provided informed consent to participate in the study. We defined a baseline period from December 15 to 28, 2011, and an interventional period from February 9 to 22, 2012, so that the same set of residents would rotate in the clinic in both periods. During the baseline period, the attending physicians were instructed to continue their conventional prescribing practice. During the interventional period, the attending physicians and the 19 resident physicians whom the attendings were supervising were instructed to use the new prescribing strategy whenever possible. Informed consent was not obtained from resident physicians because only attending physicians can prescribe medications at our practice. Informed consent from patients was waived because of the minimal risk, the retrospective nature of the analysis, and the practicability of the study. The institutional review board at Beth Israel Medical Center approved the study protocol.
Interventions
The new prescribing strategy was as follows: Prescriptions would be written such that the total supply of medications provided, including refills, would only cover the time period until the next intended clinic visit with the caveats that (1) providers could add 1 refill to the above supply at their discretion and (2) providers could add more refills only if clinically indicated or upon the patient’s request. For example, if a patient was intended to return to the clinic in 6 to 8 weeks, a provider could prescribe a 1-month supply of prescriptions with 1 or 2 refills. The ultimate decision on the total amount of medication supplied was at the discretion of providers. The participating physicians and resident physicians were reminded of the protocol prior to and/or during the interventional period via e-mails, face-to-face conversations, and printed documents.
Inclusion and Exclusion Criteria
Any clinic visits of adult patients seen or supervised by the participating attending physicians during the study period (“initial index visits”) were screened. The visits were included in the study if they met the following predefined criteria: (1) the follow-up appointment was requested to be scheduled within 3 months from the initial index visit and (2) at least 1 prescription was given through an electronic prescription system. The criteria were chosen because our intervention was assumed to most strongly affect such patients’ behavior and prescription data could be most accurately tracked for electronic prescriptions. If the same patient visited the clinic more than once within 1 period (baseline or intervention), we excluded the subsequent visits and used the first visit in the analysis. For the primary analysis, we further excluded patients who presented more than once during the entire study period to mitigate dependency between the 2 periods. We then conducted a secondary analysis including patients with recurring episodes during the 2 periods.
Outcomes
The primary outcome was compliance with the next scheduled appointment from the initial index visit, measured by the proportion of no-shows at the next scheduled appointment out of total initial index visits. The secondary outcome was continuity of care, measured by the proportion of patients who were scheduled for the same physician in the 2 appointments, out of total scheduled follow-up appointments.
Data Collection and Measures
Data for all patients seen or supervised by the participating attending physicians during the study period were retrospectively collected. Patient demographics, scheduled appointment provider, requested interval for the follow-up appointment, and prescription data were collected through the electronic health record system eClinicalWorks (eClinicalWorks Inc, Westborough, Massachusetts) on initial index appointment dates. Patient demographics collected include age, gender, primary health insurance, and medical history. Primary health insurance was categorized as Medicaid, Medicare, or other. Medical history was abstracted from the clinical notes and included hypertension, hyperlipidemia, diabetes, myocardial infarction, stroke, asthma, chronic obstructive pulmonary disease, hepatitis C virus infection, and depression. Prescription data collected included the names of electronically prescribed medications, quantity prescribed, and number of refills.
The length of supply and the number of refills were determined for each case based on the prescription data of daily medications for chronic medical conditions, including new, continuing, and adjusted medications. Months of total supply were then calculated from the length of supply and number of refills. For a patient who received prescriptions with different length of supply or number of refills, we used data of the prescription with the shortest total supply. The conformance to the prescription strategy was measured for each patient by comparing months of total supply and the time from the initial index appointment to the requested follow-up appointment. A difference of no more than 1 month was considered to indicate compliance. The hypothetical conformance rate using the same method was also calculated for the baseline period for comparison.
We then collected subsequent follow-up appointment date and status through the electronic outpatient scheduling system for patients who met the inclusion criteria for the study. Data on appointments up to 120 days following the index appointment were collected for scheduled date, appointment provider, and arrival status. Arrival status included “arrived,” “no show” (did not show up without cancellation), and “cancelled” (by patients or by the practice).
Statistical Analysis
Pearson chi-square test was used for comparison of categorical variables. Numerical variables were expressed as mean with standard deviation or median with interquartile range according to the normality of the variable distribution. The 2-sample t test was used for variables expressed as mean, and Wilcoxon rank sum test was used for variables expressed as median.
To identify variables affecting no-show rates, we used forward stepwise logistic regression with the minimum AICc (corrected Akaike information criterion) method for all patients included in the primary analysis. Investigated variables were age, gender, primary insurance (Medicaid vs Medicare vs other), all items on medical history, and scheduled provider level (attending vs resident), which were chosen based on clinical assumption. We then conducted multivariate logistic regression analysis including the identified variables and study period (baseline vs intervention). The final model included study period, age, gender, primary insurance, diabetes, stroke, and asthma. Univariate regression analysis for those variables was also conducted. Additionally, we conducted a secondary analysis using the same set of variables for multiple logistic regression including patients with recurring episodes between the 2 periods.
All analyses were performed with JMP 9.0 software (SAS Institute Inc, Cary, North Carolina). All statistical tests were 2-sided, and P < .05 was considered significant.
Results
There were 828 and 1029 patient visits in the baseline and interventional periods, respectively. Among these, 221 and 278 visits were included in the primary analysis in the respective periods (Figure 1). The patient and clinic appointment characteristics were comparable between 2 groups (Table 1).

Flowchart of patient visits. There were 828 and 1029 visits in the baseline and interventional periods, respectively. In 479 and 610 visits, patients were given no prescriptions through the electronic prescription system at the initial index visit. In 76 and 104 visits, physicians did not request follow-up appointments within 3 months. Nine and 2 visits were excluded because they were recurring visits of the same patient within the same period. After exclusion of recurring episodes between the 2 periods, 221 and 278 patient visits were included in the primary analysis in the respective periods.
Patient and Appointment Characteristics.

Chi-square test was used for comparison unless noted otherwise.
Two-sample t test was used.
One hundred eighty-five patients (83.7%) in the baseline period and 226 patients (85.6%) in the interventional period received prescriptions for daily medications for chronic medical conditions. The total supply of medications was significantly less in the intervention group (median 3 vs 6 months, P < .001). The conformance rate for prescription strategy was 58.0% in the interventional period compared with 14.1% in the baseline period (P < .001) (Table 2).
Appointment and Prescription Outcomes.
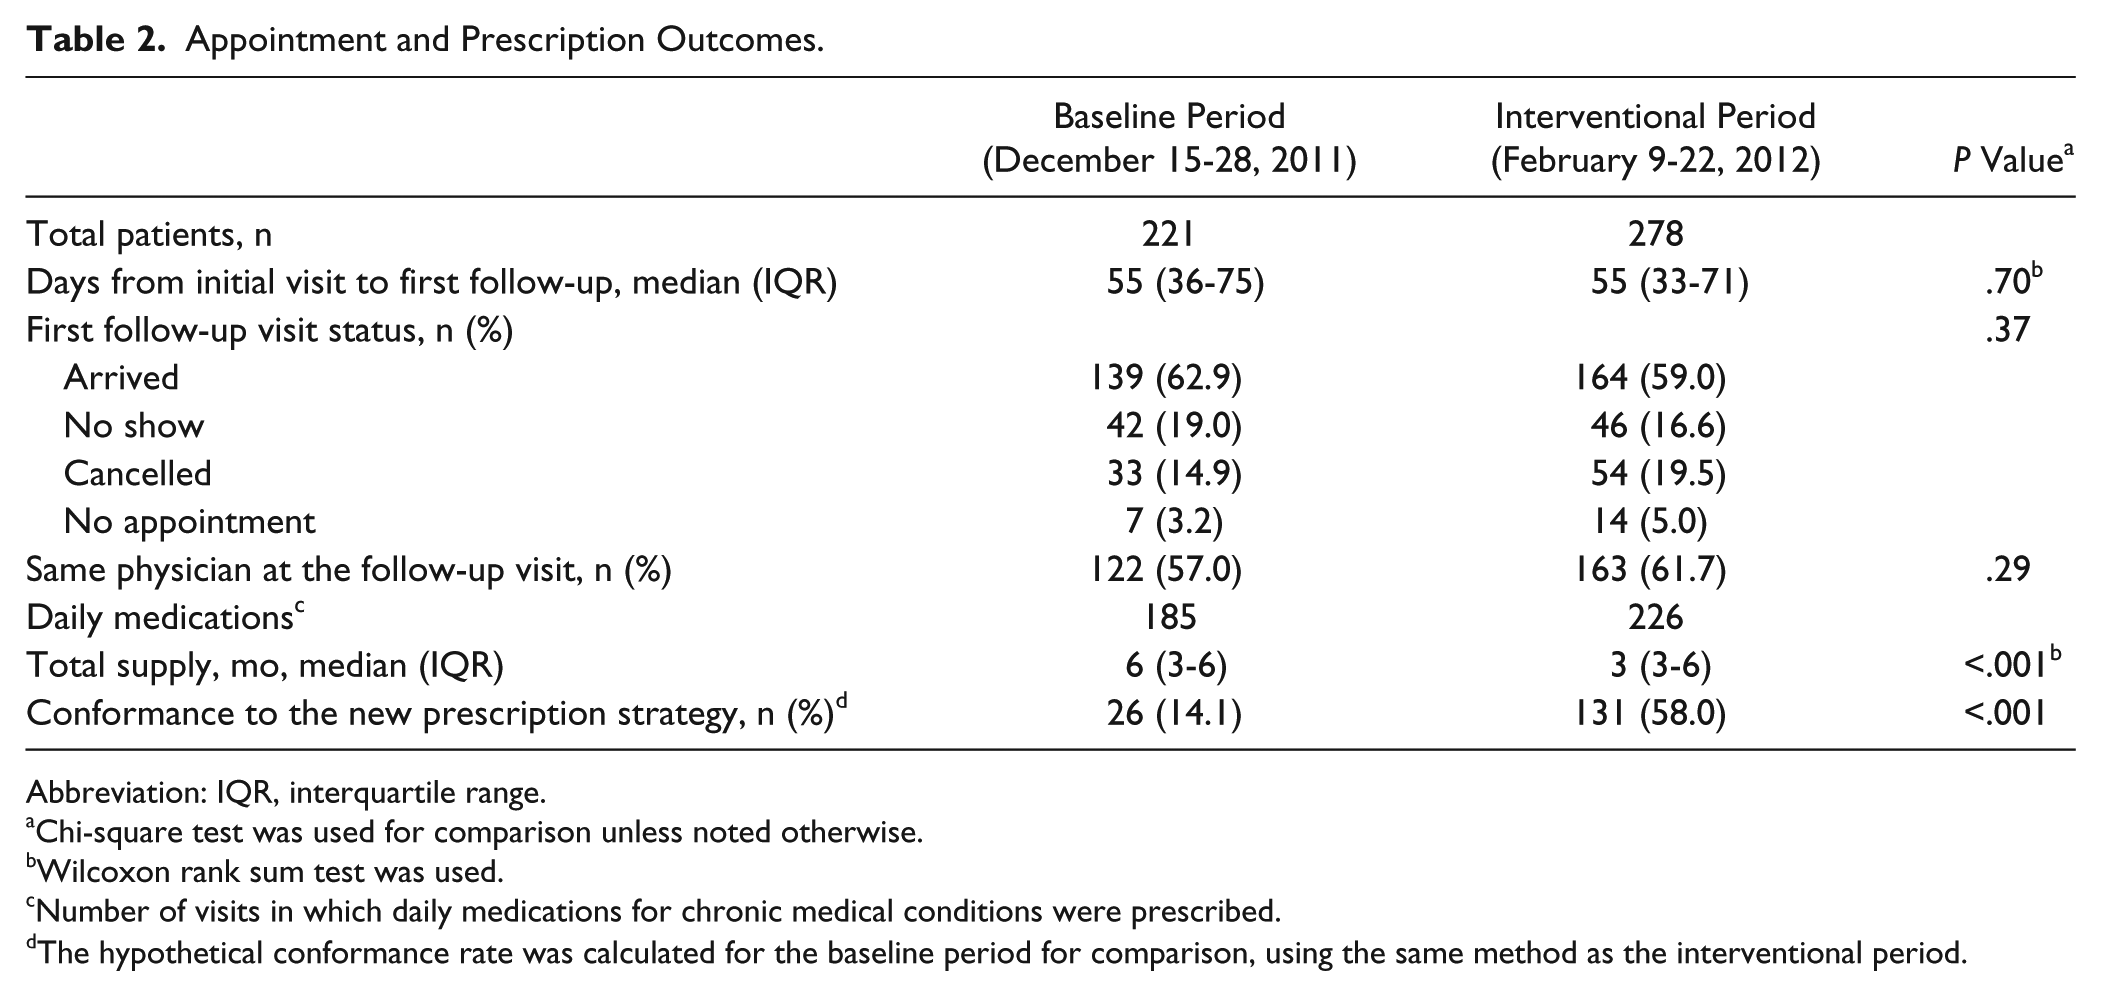
Abbreviation: IQR, interquartile range.
Chi-square test was used for comparison unless noted otherwise.
Wilcoxon rank sum test was used.
Number of visits in which daily medications for chronic medical conditions were prescribed.
The hypothetical conformance rate was calculated for the baseline period for comparison, using the same method as the interventional period.
Two hundred fourteen of 221 patients (96.8%) in the baseline period and 264 of 278 (95.0%) in the interventional period had a follow-up appointment scheduled within 120 days from the initial index visit (P = .4). The median number of days from the initial visit was 55 days in both periods (P = .7). The proportion of no-show appointments was not significantly different in the interventional period (16.6%) compared with the baseline period (19.0%) (P = .5). There was no statistically significant difference in the proportion of same physician appointments in the interventional period compared with the baseline period (61.7% vs 57.0%, P = .3) (Table 2).
In the univariate regression analysis, the no-show rate in the interventional period was not significantly different from that in the baseline period (odds ratio [OR] 0.8; 95% confidence interval [CI], 0.5-1.3; P = .5). Univariate analyses for other covariates are shown in Table 3. In the multivariate logistic regression analysis, the no-show rate in the intervention period was not significantly different from that in the baseline period (OR 1.0; 95% CI, 0.6-1.5; P = .8). Patient age increase per year (OR 0.97; 95% CI, 0.95-0.99; P < .01) and female gender (OR 0.5; 95% CI, 0.3-0.8; P < .01) were associated with lower no-show rates, while primary insurance as Medicaid (OR 3.7; 95% CI, 1.3-16.1; P = .01) or Medicare (OR 4.2; 95% CI, 1.2-19.5; P = .02) versus other insurance and diagnoses of diabetes (OR 1.8; 95% CI, 1.0-3.0; P = .04) and asthma (OR 2.0; 95% CI, 1.1-3.7; P = .03) were associated with higher no-show rates (Table 3). The secondary analyses did not alter any of the above outcomes.
Univariate and Multivariate Logistic Regression Analyses for No-Show Rate.
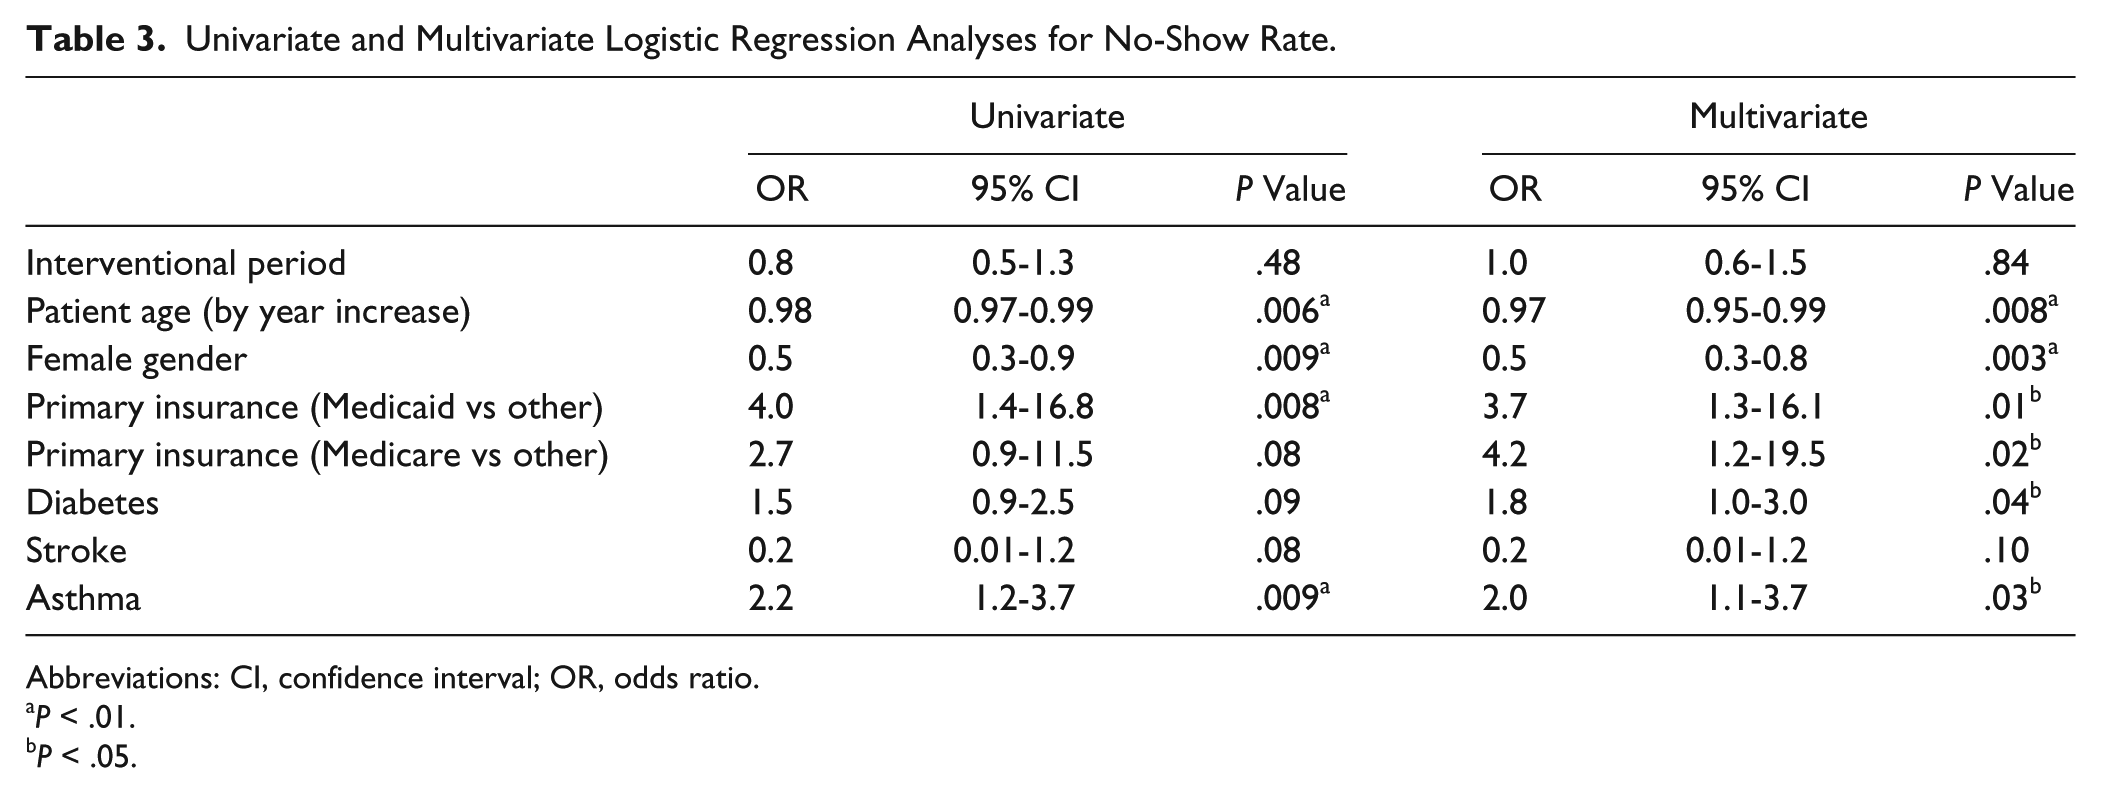
Abbreviations: CI, confidence interval; OR, odds ratio.
P < .01.
P < .05.
Discussion
In this study, while the new prescribing strategy significantly reduced the number of medication refills, it did not result in a significant reduction in no-shows or improvement in the continuity of care in the immediate follow-up appointments. We found that younger age, male gender, Medicare or Medicaid insurance, and diagnosis of diabetes and asthma were associated with increased no-shows.
To our knowledge, this is the first study to evaluate the association between the number of prescription refills and the no-show rate. We searched relevant literature from database inception to 2013, using terms such as drug prescriptions, prescription refills, patient compliance, appointment and schedules, appointment compliance or adherence, and no-show. The searched databases included PubMed, Ovid Medline, and Scopus as well as open sources such as Google Scholar and Microsoft Academic Search. We also reviewed reference of articles that described interventions to reduce no-shows, but we did not find similar interventions reported in the literature. Although our interventions did not decrease no-shows, this study adds further knowledge to the body of literature. This study is also novel in that the intervention entailed changing physicians’ prescription supply patterns directly.
Past studies found that patients’ perceived danger of their illnesses, perceived benefits of seeing physicians or treating medical conditions, and barriers to keeping appointments influence appointment compliance, consistent with health belief model theory.12-14 Common barriers for keeping appointments are failure to remember, competing employment and family commitments, transportation problems, sickness, lack of knowledge about the scheduling system, and poor patient-provider relationships.15-18 Our intervention was hypothesized to alter the perceived benefits of keeping appointments and thereby to change patient behavior. The negative study results may indicate a relatively weak association between the perceived benefits and the appointment keeping behavior.
This study has obvious limitations. First, the study was conducted in nonrandomized fashion. Participating physicians were aware of the intervention prior to the baseline period. This could have affected their prescribing patterns in the baseline period and potentially could have reduced the chance of observing positive effects. Second, we could not collect patient demographics such as ethnicity, smoking status, living environment, or socioeconomic status, which may influence the appointment compliance behavior. The difference in these variables between the baseline and interventional periods may have confounded the results. Further, we could not assess whether the patients received any prescriptions outside our clinic or whether they called our clinic to obtain prescription refills outside of clinic appointments. These occurrences may have nullified the effectiveness of the intervention. Third, adverse events or negative effects of the intervention were not fully studied. The potential adverse outcomes include increased phone calls to the clinic asking for prescriptions and increased rates of nonadherence to medications due to short supply of medications. Fourth, the study may be underpowered due to small effect sizes of the intervention. Fifth, the study findings may not be generalizable to other practice settings with different population characteristics.
Despite those limitations, this study provided new evidence on the association between prescription patterns and appointment compliance. Considering existing therapeutic, educational, and financial burdens of no-shows in teaching continuity clinics, further studies are needed to minimize no-shows, especially where the rates are high. Future interventions could target high-risk patients with certain demographics or medical history who were identified in this study.
Conclusion
An intervention to reduce the number of prescription refills did not decrease no-show rates in an urban teaching continuity clinic. Different approaches should be considered to reduce no-shows.
Footnotes
Declaration of Conflicting Interests
The author(s) declared no potential conflicts of interest with respect to the research, authorship, and/or publication of this article.
Funding
The author(s) received no financial support for the research, authorship, and/or publication of this article.