
Abstract
Introduction
Hypertension is a major risk factor for heart disease, 1 which is the number one cause of preventable death in New York City 2 and the United States. 3 Controlling hypertension can reduce this risk, but there are many barriers to adequate treatment. In New York City, more than 30% of patients receiving treatment for hypertension do not have their blood pressure controlled. 4 Black and Hispanic patients have lower rates of blood pressure control, 4 which contribute to thousands of excess deaths annually. 5 Improving hypertension control for these populations could reduce these racial and ethnic disparities.
Panel management, a system of care that allows the targeting of groups of patients with similar needs, has been shown to be an effective way to improve chronic disease management.6-12 Panel management entails (a) systematic identification of groups of patients at-risk or with gaps in care (usually through a patient registry), (b) outreach to improve follow-up care, (c) implementation of guideline-based interventions, and (d) tracking and monitoring indicators of care delivery and outcomes.
We aimed to determine whether panel management could improve blood pressure control and to explore how it can be integrated into routine practice in an urban community health center serving a low-income, racial and ethnic minority population.
Methods
Selection of the Pilot Site
Prior to this pilot, the New York City Department of Health and Mental Hygiene (Health Department) initiated a project to increase self blood pressure monitoring (SBPM) among hypertensive patients in neighborhoods that are predominantly black and Hispanic, low income, and medically underserved. 13 Hypertensive patients in clinics in these neighborhoods received blood pressure monitors and training on their use. For this pilot, Health Department staff reached out to medical directors of clinics in the SBPM program that had functioning electronic medical record systems. The Dr Martin Luther King Jr Health Center was chosen because the medical director agreed to commit clinic staff time to this quality improvement effort.
Hypertension Quality Improvement Team
The Health Department provided a practice coach to assist the clinic leadership in sustaining hypertension panel management. 14 The medical director recruited the hypertension quality improvement team (the team), which included a physician leader and representatives from the medical staff, administration, clerical staff, social work, nutrition, information technology support, and nursing. The practice coach provided training in quality improvement methods 15 and in panel management. The physician leader prepared meeting agendas, ensured that the registry was updated, generated reports for monthly team meetings and designated specific tasks to team members.
Team members rotated responsibilities for running meetings and each team member developed protocols in their respective disciplines (eg, the nutritionist developed the nutrition counseling protocol). Resident physicians assisted with data entry, technical support, and generating results for reports from the registry. The registrar tracked and scheduled planned care visits, mailed out reminders to patients overdue for appointments, and flagged patient charts to remind providers that patients were participants in the registry. The social worker directed self-pay patients to low-cost pharmacies and gave information regarding free gym access. The practice manager blocked physician schedules and reserved locations for team meetings. Team huddles were held on a weekly basis to identify any barriers in the work flow and ensure their timely resolution.
Registry
The registry of hypertensive patients was planned as part of the electronic health record with data automatically populated from clinical documentation. However, the information technology department did not have the resources to implement it at the time, and as a result, the team created a registry in Microsoft Excel based on an example from the American Academy of Family Physicians. 16
Development of the Intervention
The clinic physicians identified 42 patients participating in SBPM who still had uncontrolled hypertension after at least 2 months of participation, and nurses contacted them to enroll them in the program in January and February 2011. Inclusion criteria included systolic blood pressure ≥140 mm Hg or diastolic blood pressure ≥90 mm Hg (or ≥130 or ≥80 mm Hg, respectively, for patients with diabetes or kidney disease), age ≥18 years, documented hypertension for at least 6 months, up-to-date contact information, and previous compliance with the SBPM program.
From March to October 2011, patients were monitored and called in for planned-care visits. Patients were seen for follow-up visits at 1 and 2 months after enrollment. During visits, patients received nursing and physician interventions that included medication compliance assessment and counseling along with dietary and exercise counseling. Physicians reviewed and adjusted antihypertensive medications based on the Seventh Report of the Joint National Committee on Prevention, Detection, Evaluation, and Treatment of High Blood Pressure (JNC7) hypertension guidelines. Patients were then recalled on a monthly basis if needed.
Data Collection
The registry was used to collect pre- and postimplementation blood pressure, documentation of receipt of the interventions, demographic data, and data on medical co-morbidities.
In September and October 2011, clinic staff members were interviewed using structured in-person interviews. Interviews of team members were designed to assess perceptions of the project, overall time commitment and successes and challenges.
Data Analysis
All 42 patients approached agreed to participate. One patient was unable to continue participation because of cognitive limitations and lack of family support and 1 patient died prior to follow-up. The remaining 40 patients had at least 1 follow-up visit; however, 2 patients had incomplete follow-up with less than 6 months of enrollment. These patients were included in the analysis using their last recorded blood pressure as the outcome measure. The proportion of patients with blood pressure control at baseline and at 6 to 9 months was compared using McNemar’s test. Average systolic and diastolic blood pressure at enrollment and at 6 to 9 months were also compared using paired t tests. 17 Thematic analysis 18 was performed on the data from staff interviews.
Results
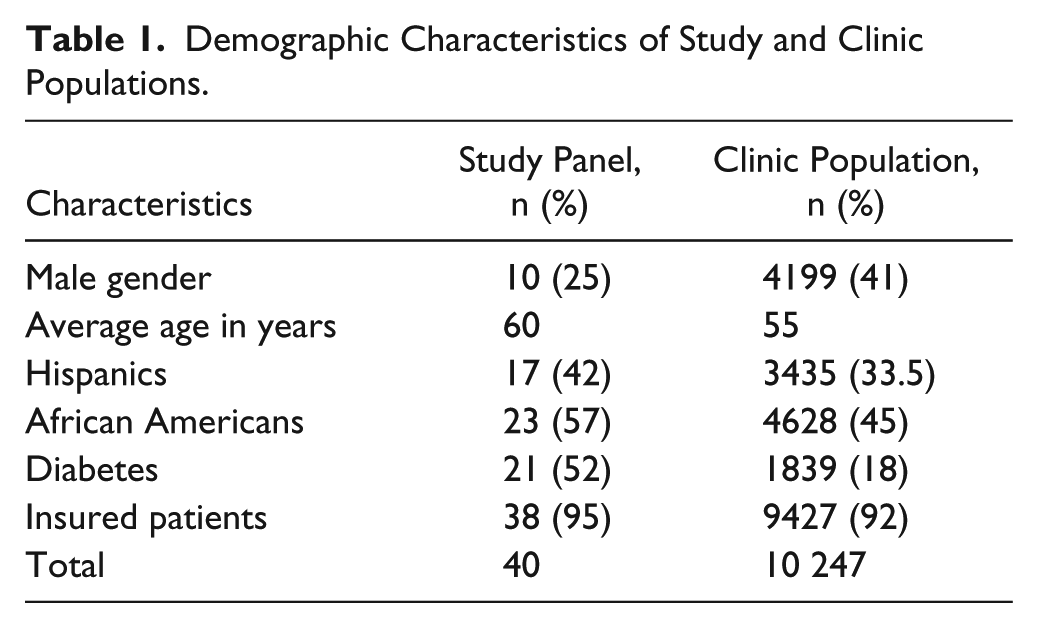
Demographic characteristics of the clinic and of participants are shown in Table 1. Fifty percent of the patients were enrolled in either Medicare or Medicaid health maintenance organization, 25% were enrolled in traditional Medicaid, 20% had private insurance, and 5% were uninsured. Recorded comorbidities included diabetes (52.5%), renal disease (17.5%), or both (15.0%). None of the participants had controlled blood pressure at enrollment, and 11 (27.5%) had gained control by the end of the pilot (McNemar’s χ2 = 27, P < .001). The average systolic blood pressure decreased by 16 mm Hg from 156.5 to 140.5 mm Hg (P < .001; Figure 1), and the average diastolic blood pressure decreased by 3.8 mm Hg from 85 to 81.2 mm Hg (P = .03; Figure 2).
Demographic Characteristics of Study and Clinic Populations.

Systolic blood pressure at several time points before and after the initiation of the intervention.

Diastolic blood pressure at several time points before and after the initiation of the intervention.
The mean number of clinic visits between enrollment and follow-up was 6 (range 1-12). Almost all (97.5%) patients received nutrition counseling and 85% received exercise counseling. The majority (72.5%) received medication adjustment, and 40% received medication adherence counseling.
Provider Interviews
All team members were interviewed. One physician who was not on the team was also interviewed to gain perspective on the program’s impact on clinicians without a specific investment in the project. Project successes included improved provider communication, patient education, and patient activation. Challenges centered on scheduling conflicts and use of the registry (Table 2).
Themes and Quotes From Provider Interviews.

Two physicians estimated that they spent 1.5 to 2 hours per week during the first few weeks on the project followed by 1.5 to 3 hours per month afterward. A third resident physician spent 4 to 5 hours per month on the project. Two nurses each spent 0.5 to 1 day twice a month on the project, and the registrar spent 1 to 1.5 hours per week on the project. All other respondents indicated that the project did not appreciably increase their workload or detract from their other duties.
Discussion
The results of this pilot project indicate that panel management can improve blood pressure control in a difficult-to-reach population with limited resources. We found similar improvements compared to other hypertension quality improvement projects. Walsh et al, 19 in a systematic review of 82 quality improvement studies, found a 16.2% increase in patients with blood pressure control, 4.5 mm Hg improvement in systolic blood pressure and 2.1 mm Hg improvement in diastolic blood pressure. 19
In general, this approach was well accepted by clinic staff. Information on specific staffing requirements for implementing panel management is lacking in the literature. This pilot generated estimates of the number of hours each staff member contributed. Taken as a whole, these results suggest that in order to be viable on a larger scale, health information technology needs to be used more efficiently and management and administrative support for scheduling need to be strong and consistent.
Limitations of this pilot include the pre-post design that lacked a control group for comparison. Also, we used a convenience sample of patients enrolled in the SBPM program who were selected to be likely to comply with frequent follow-up. The most vulnerable patients with financial barriers to treatment and poor follow-up were not captured in this sample. Finally, clinic staff member interviews may have been biased due to courtesy bias.
Primary care practices, with appropriate staff supports, could use this model to improve their own clinical practice. Even providers without access to an electronic health record–based registry can create a registry using commercially available software to track patients and improve care.* Functional, user-friendly registries that populated automatically from the electronic medical record could substantially improve the efficiency for panel management.
Footnotes
Acknowledgements
The authors would like to thank Angela Aguasvivas, Minerva Calderon, Dr Shadi Chamany, Dr Ellen Cohen, Grace Cruz, Victoria Foster, Dr Jayanthi Loganathan, Dr Andrea Lyman, Dr Suresh Nayadu, Kinjal Patel, Dr Amparo Ramirez, Dr Venkat Sahasranaman, Dr Abayomi Salako, Kendall Sims, Stella Yi, Susan Leung Yuen, and the staff of the Dr Martin Luther King Jr clinic for their contributions to this work.
Authors’ Note
At the time of this study, Dr Chuang was a resident in Public Health and Preventive Medicine at the New York City Department of Health and Mental Hygiene, Drs Alvi and Yandrapu were residents in Internal Medicine at Bronx-Lebanon Hospital, and Dr Dalal was the Medical Director of Quality Improvement in the Bureau of Chronic Diseases at the New York City Department of Health and Mental Hygiene.
Declaration of Conflicting Interests
The author(s) declared no potential conflicts of interest with respect to the research, authorship, and/or publication of this article.
Funding
The author(s) received no financial support for the research, authorship, and/or publication of this article.
*
Low-cost registry software that may be useful for small practices can be found through i2iSystems at http://www.i2isys.com/products-detail/646710-i2i-tracks. A review of various free access and low-cost registry software programs can be accessed through the California Healthcare Foundation at ![]() .
.