
Abstract
Background
Visual impairment ranks fourth among illnesses feared by Americans, only after AIDS, cancer, and Alzheimer’s disease. 1 Among Medicare beneficiaries, vision loss increases health care costs, with more than 90% of the increase related to non-eye concerns such as physical injury, falls or depression.2,3 Visual impairment alone is associated with increased 5-year mortality, which may be related to increased accidents.4-7
Worsening vision has been shown to be associated with increased rates of depression, loss of independence, increased need for community support services, and increased reliance on family in caregiving roles.2,8-16 Furthermore, visual impairment contributes to nursing home placement in older populations, with the odds of requiring skilled nursing or long-term care placement increasing 2.5- to 3-fold with visual impairment.3,17
Loss of vision that impedes the ability to appropriately take prescribed medications can quickly snowball into acute exacerbations of chronic illness and end organ damage that are costly to both the health care system and overall patient quality of life. 18 A study of inhaler misuse found that only 61% of those with adequate vision were medication misusers compared with 95% in the poor vision group. 19
Like medication misuse, falls may necessitate expensive medical procedures and erode a patient’s ability to remain independent within the community. Studies of community-dwelling elderly and nursing home residents have demonstrated that visual impairment is associated with increased risk of falls and is an independent risk factor for hip fractures.18,20-28 Not only is hip fracture expensive, with estimated costs of $81, 300, but patients with hip fracture have reduced life expectancy of 25% compared to age- and gender-matched peers.29,30
Currently, the US Preventive Services Task Force has concluded that there is insufficient evidence to recommend for or against screening visual acuity for the improvement of outcomes in older adults. 31 With no formal recommendation to screen the population at large for visual impairment, physicians may not be prompted to inquire about vision symptoms.
Without physician prompting, patient reporting of visual impairment symptoms is limited. 32 Surprisingly, patient self-referral to ophthalmology or optometry in light of visual impairment symptoms is also limited. In 1 study of community-dwelling adults older than 65years, 72% had impaired vision despite use of corrective lenses and had not sought out evaluation. 33 Likewise, 51% of patients presenting for outpatient care for routine general medical issues were discovered to have clinically important ocular pathology after vision screening. 34 A similar study in hospitalized patients found half had impaired vision, with 79% of those impairments being correctable. 35 One author has estimated that 88% of older people with treatable visual disorders do not seek out eye care services. 36
A family physician may be a patient’s point of first contact when a vision issue arises. The need for a primary care referral, lack of established relationship with an eye care provider, cost, or limited ophthalmological resources to meet demand may preclude patients from seeking out ophthalmology as a point of first contact. 37 Furthermore, primary care screening with formal ophthalmologic referral procedures has been effective at identifying serious causes of eye disease. 38
Vision screening requires a reliable, efficient test that can be implemented in a primary care office. Although efficiency and reliability of a test are influenced by many factors, we chose to study only the time required to administer 3 common vision screening tests. The specific aim of our study is to determine the time required for adults older than 50 years to complete 1 of 3 vision impairment assessment tools in a family medicine residency office.
Methods
Subject selection criteria and sample size justification
The study was conducted in the ambulatory office of a family medicine residency program and included patients 50 years and older with no cognitive or physical deficits that would impair ability to follow directions and complete screening tasks. Sample size was calculated using data from a previous pilot study conducted by the authors. To achieve 85% power, each screening method needed 23 participants (N = 69).
Sampling procedures
During May 2011 to June 2011, all patients presenting for care and meeting the inclusion criteria were approached regarding participation in the study. Before the start of the study, 69 envelopes were sealed containing 1 of 3 vision screening tests. After providing informed consent, the participant and research assistant drew a premade packet at random from the remaining study packets. A card within the envelope revealed if the patient would complete the Functional Vision Screening Questionnaire (questionnaire), mixed contrast sensitivity reading card (card), or visual acuity testing using a Snellen eye chart (Snellen); 23 participants completed each test, with each participant completing the test he or she was randomized to receive. The time to complete each test was measured with a handheld stopwatch and recorded by the researchers. Patients received a $15 incentive in the form of a grocery store gift card for their participation. The study was stopped once 69 participants were enrolled.
Screening modalities
The Functional Vision Screening Questionnaire is a 15-question, paper-based, validated tool used to identify visual impairment that warrants a comprehensive, clinical eye evaluation. Each item asks about a functional indicator of vision problems. A score of 9 or more has a sensitivity of 0.72 and a specificity of 0.94 for visual impairment. The questionnaire was completed by patients in a private examination room without assistance.
The mixed contrast sensitivity reading card evaluates for impairment with either acuity or contrast sensitivity. The card contains pairs of sentences, composed of progressively smaller font, with 1 sentence printed in high-contrast black font and 1 printed with lower contrast gray font on a white background. The smallest high-contrast sentence that can be correctly read correlates to a specific visual acuity. The difference between the smallest high-contrast font sentence and the smallest low-contrast font sentence that can be read evaluates contrast sensitivity impairment. This test was also administered in a private examination room but required a trained research assistant to administer the test to the patient.
The Snellen evaluation of visual acuity requires patients to stand 20 ft from the chart and read sequences of letters that are printed in progressively smaller font sizes. The smallest line that can be accurately read correlates with visual acuity. During our study, the Snellen chart was mounted to a wall, and patients completed the assessment in the hallway as is normal practice in the office. The time to administer the Snellen assessment included the time for the patient to walk to the chart in the hallway and return to his or her examination room.
Interobserver reliability
Each vision assessment was timed by an independent observer. Several observers assisted with data collection. Before data collection, each observer timed practice trials of each of the 3 screening modalities to ensure a 90% agreement on times noted. Interobserver reliability was calculated using point-by-point interobserver agreement. Reliability checks were performed after every 8 patients screened in each subgroup.
Data analysis procedures
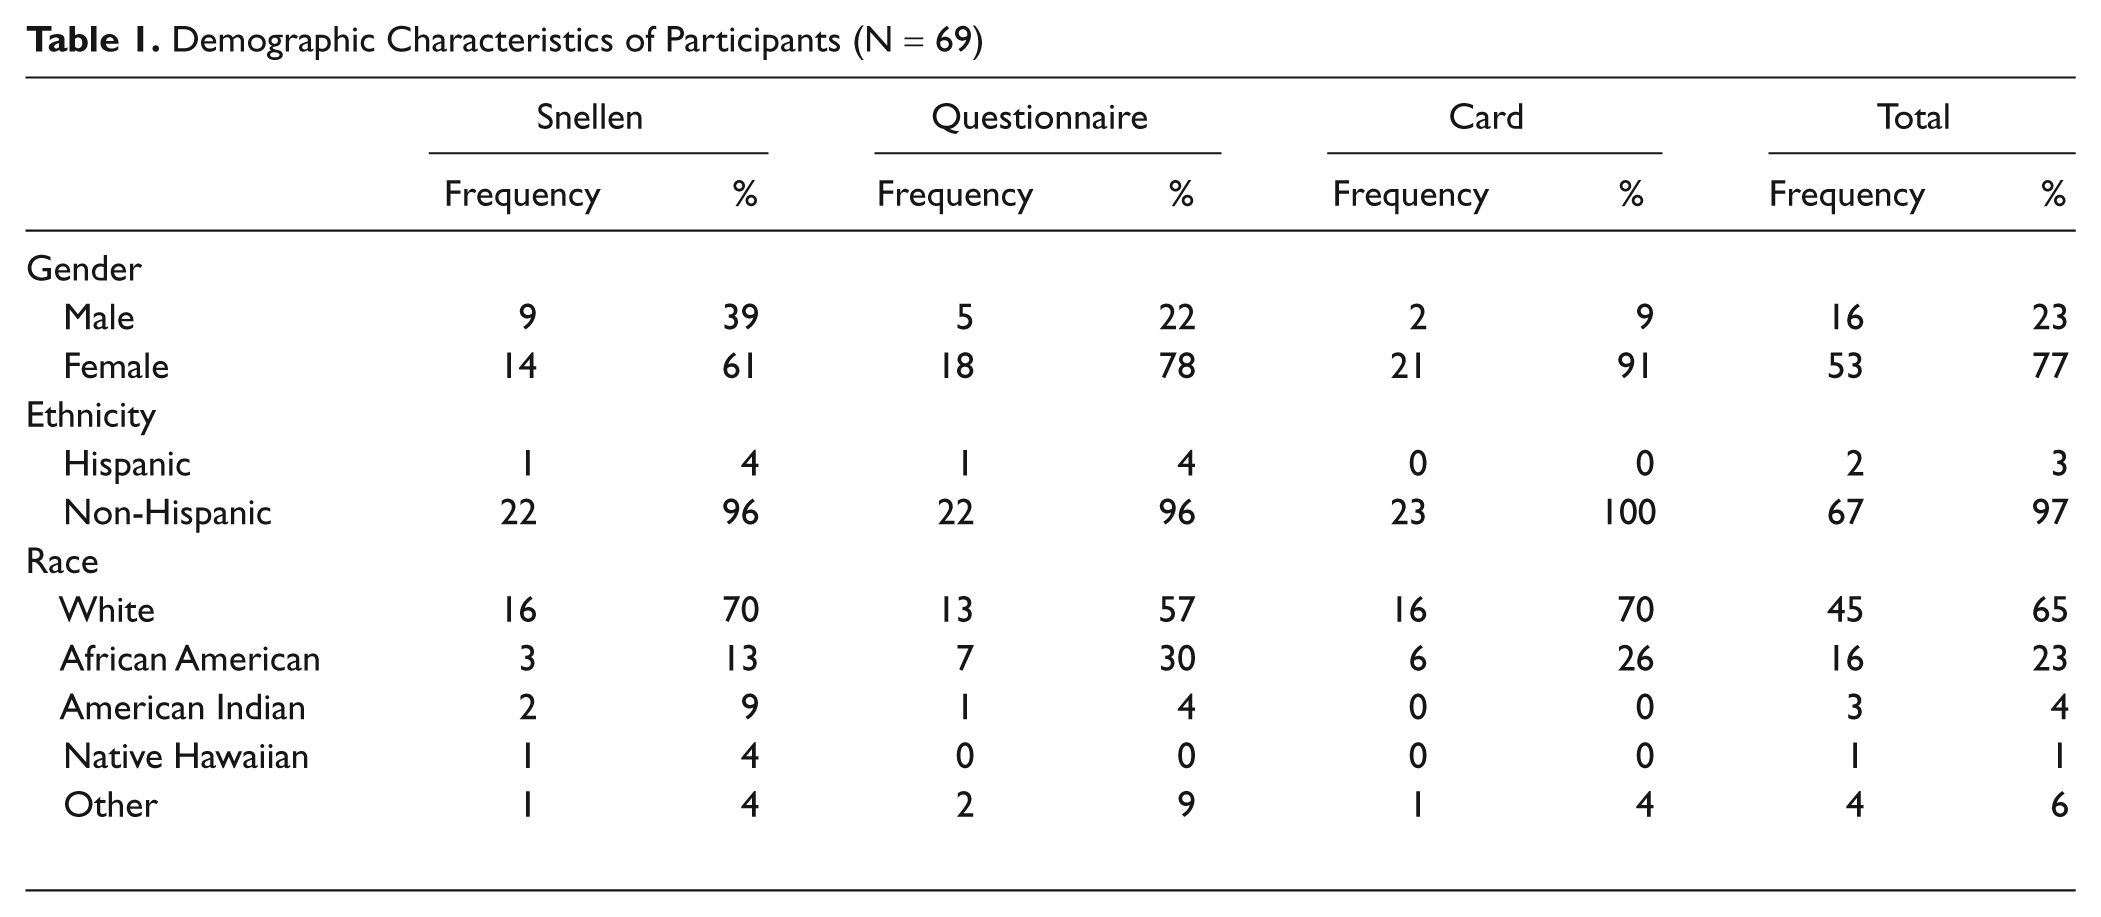
Data analysis was carried out by PROC GLM in SAS software for Windows (version 9.2). The frequency and proportion of participants with various demographic characteristics in each subgroup were determined. Table 1 includes these descriptive statistics. An initial analysis of variance (ANOVA) was performed and found significant differences in the time to completion of each test. A post hoc Tukey studentized range test was then conducted to determine between which tests a significant difference exists.
Demographic Characteristics of Participants (N = 69)
This study was approved by the University of Kansas School of Medicine–Wichita Institutional Review Board.
Results
Sixty-nine patients participated in the study, with a mean age of 63 years (SD, 10 years; range, 51-90 years). The majority of participants were female (77%), white (65%), and non-Hispanic (97%). Participants were randomly assigned to the 3 assessment groups. Table 1 describes the demographic characteristics of participants.
Table 2 lists the mean time to complete each screening modality. The Snellen required 159 seconds, including the time spent walking to and from the examination room. With the elimination of the walking time, 79 seconds was required to complete testing using the Snellen chart.
Mean Time to Complete Vision Assessment
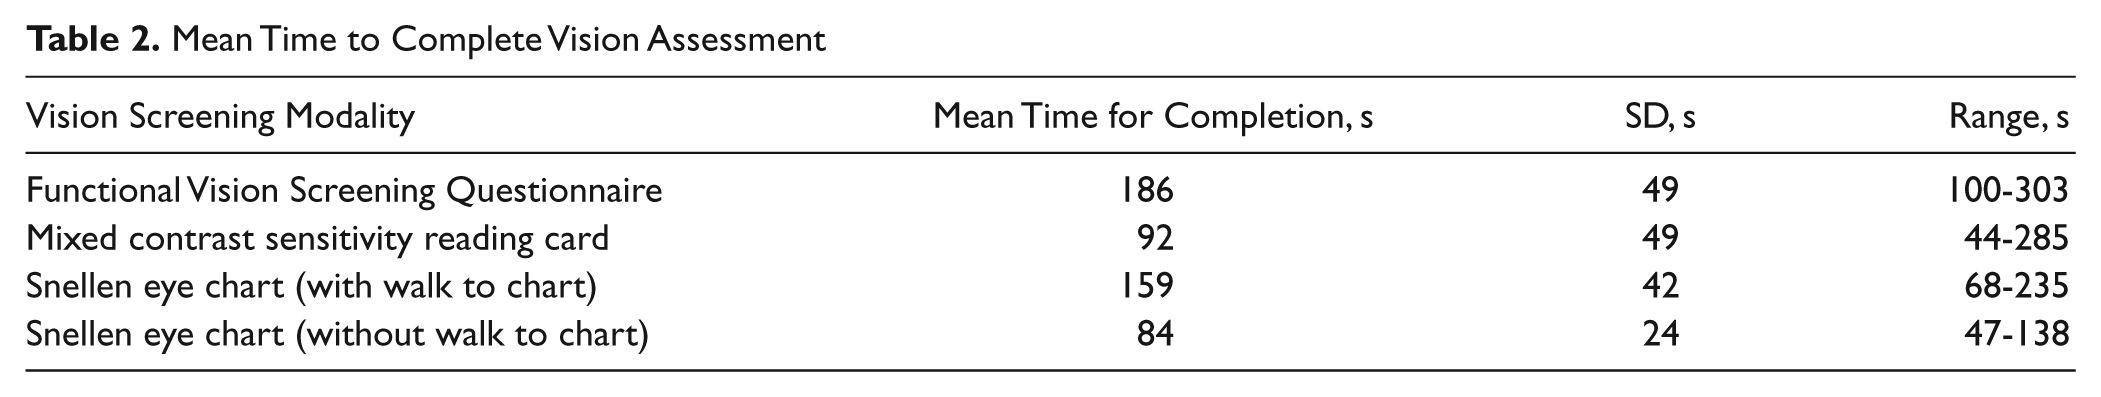
Analysis of variance revealed a statistically significant difference among these 3 methods on the total time needed to complete each test (F=25, p<0.05). Tukeystudentized range test was then conducted to identify the source of the difference. Table 3 describes the results of the Tukey’s studentized range test.
Tukey’s Studentized Range Test Results

A statistically significant difference exists between the time to complete the questionnaire and time to complete the card (95% confidence interval [CI], 61.24 to 127.11 seconds). Similarly, a significant difference exists between the time to complete the Snellen and time to complete the card (95% CI, 34.2 to 100.06 seconds). In both instances, the card required less time to complete. No significant difference exists between the time to complete the Snellen (with walking) and the time to complete the questionnaire (95% CI, –5.89 to 59.97 seconds).
Discussion
Significantly less time was required to complete the card than to complete either the Snellen or the questionnaire. On face, this would suggest that the card would be the most efficient modality for primary care–based screening. However, an assessment of the efficiency of a screening modality within a primary care office must include far more than the time to administer the test.
Prior studies have demonstrated that a family physician conducting all recommended routine screens for an average patient panel would spend 7.4 hours each working day providing only preventive services. 39 Given such time constraints, physicians must prioritize patient problems and competing interests to determine which screens are most appropriate for each patient. Currently, no recommendation for universal vision screening exists from the US Preventive Services Task Force. Prior studies suggest many patients do not report visual impairment nor do they seek out care from an eye care provider for visual screening. Without a primary care–based screening recommendation, a number of patients may experience significant preventable physical and emotional consequences of impaired vision. However, a primary care–based screening program will only be successful if a test can be found that requires minimal time yet remains highly reliable.
Although 92 seconds may seem to be a relatively short time if screening is requested for a single patient, the additive effect of 92 seconds for every patient in a universal screening protocol results in a considerable time investment for a practice. Prior studies have suggested that vision screening all adults within a practice on an annual basis may require more than 5 hours per year of clinical time. 39 Perhaps none of the vision screens tested requires a short enough time to be successfully adopted for population screening in a busy practice. Further work is needed to determine how long is too long for a new vision screening test. Will physicians implement a test that requires 84 seconds to administer, or will a faster modality be needed to ensure widespread adoption?
Moreover, is universal screening the right approach? Is there a subpopulation of patients who would benefit from further screening? Poverty, classification as an ethnic minority, and female gender have been associated with higher rates of visual impairment and lower rates of adequate vision correction.36,40-44 Further work is needed to determine if a particular subgroup would be most likely to benefit from screening in a primary care office setting.
Not only does the total time required affect adoption of a screening test but so too does the physical configuration of an office itself. For instance, the Snellen chart time to completion included time to walk to and from the position of the chart in the hallway and required 159 seconds. When the walking time is eliminated, the Snellen chart becomes the least time-intensive screening modality at 84 seconds versus the 92 seconds required for the card. As a result, the size of the office and distance of any individual examination room from the Snellen chart may influence the time needed to use this test.
Similarly, for some offices, the portability of the card will be an advantage; in others, there may be little to gain from using the card as opposed to the Snellen given the size or configuration of the office space. Modalities such as the questionnaire that can be completed in the waiting room or before the visit with use of Internet or email do not require staff time and thus may be more efficient for the office. Although patient-completed modalities such as the questionnaire may require minimal staff time to administer, challenges still remain. Are patients willing to complete the questionnaire before the appointment, and is the information sufficiently reliable for screening purposes?
This study is limited by the generalizability of the findings. The majority of participants were white, non-Hispanic, and women. Furthermore, the setting of the study in a family medicine residency program may also limit generalizability to other settings.
Conclusions
This study evaluated the time required for completion of 3 different vision screening tools in a primary care setting. Statistically significant differences in administration time were found, but the real-world significance of these findings may be limited depending on the population served, degree of vision screening performed, and office configuration. Furthermore, our study is limited to an analysis of time required for completion only. The ease of use of each screening tool and the reliability of the tool to accurately detect visual impairment were not assessed. As different eye diseases may be more likely to be detected with a particular type of screen, the population served and the disease prevalence may play important roles in selection of a screening test. Clearly, differences in these areas would also influence the choice of screening modality in a clinic.
Primary care vision screening may detect impairment in patients and prevent significant morbidity and mortality. Without primary care–based screening, patients may be missed by the medical system as they may not report changes in vision or seek out eye-specific care. Yet primary care screening can only be effective with a rapid and reliable screening tool. Although our study quantifies the time required for administration of 3 common screening modalities, further work is needed to elucidate the reliability and ease of use of each of these modalities in a primary care setting. Future work to define who might benefit most from screening as well as evaluating the reliability of vision screening tools to detect problems with visual acuity will be important. A larger question is, how long is too long? With limited clinical time, when does a screening test take too long to complete such that physician or patient compliance falls? Ultimately, effective implementation of vision screening in the primary care office may require the development of innovative testing modalities that require less time and account for normal office function.
Footnotes
The author(s) declared no potential conflicts of interest with respect to the research, authorship, and/or publication of this article.
The author(s) disclosed receipt of the following financial support for the research, authorship, and/or publication of this article: This work was supported by the University of Kansas School of Medicine–Wichita, Dean’s Fund Internal Seed Grant.