
Abstract
Excessive body weight has become a worldwide epidemic. The World Health Organization 1 reports that 1 billion adults are overweight, more than 300 million are obese, and overweight and obesity account for more than 2.6 million deaths each year. Excessive body weight is a risk factor for many chronic diseases, such as cardiovascular diseases, type 2 diabetes, hypertension, liver diseases, and prostate, breast, and colon cancer. 2 The European Union estimates the combined direct and indirect costs of obesity to be ε33 billion a year, 2 whereas in the United States the total cost of obesity is estimated to be $139 billion annually. 3 The prevalence of obesity and overweight in Canada—as in many countries—has increased in the last 3 decades. For example, the percentage of obese adult Canadians almost doubled between 1978 and 2004. The adult obesity prevalence rate increased from 13.8% in 1978 to 23.1% in 2004. 4 This is accompanied by an increase in the average body mass index (BMI) of the Canadian population (see Figures 1 and 2).

Body mass index (BMI) classification in Canada during 2000 to 2008 for age 18 to 65 years. Authors’ calculation based on Canadian National Population Health Survey. Normal weight (18.5 ≤ BMI ≤ 24.9), overweight (25 ≤ BMI ≤ 29.9), and obese (BMI ≥ 30).

Mean body mass index of the Canadian population for (18 ≤ age ≤ 65). Authors’ calculation based on Canadian National Population Health Survey.
Obesity could result from lifestyle, environmental influences, and genetic and socioeconomic factors. Empirical evidence suggests that behavioral changes in food consumption (eg, switching to cheap, high energy-dense food) and sedentary activity resulting from technological change have immensely contributed to this epidemic.5-8 Several studies have linked obesity and overweight to the eating pattern of individuals, which affects the intake side of the energy balance equation.9-12 This includes the amount and type of food consumed, timing and eating frequency, distribution of meals over the day, and the frequency of eating outside the home. 13 Ma et al 13 found that obesity risk is negatively related to the number of eating times per day and positively associated with skipping breakfast and the frequency of eating away from home. In a related study, McCrory et al 14 found a positive association between the frequency of consuming restaurant food and body fatness in adults. Asfaw 15 examined the relation between processed food and obesity among Guatemalans and found that the risk of obesity and overweight is directly related to household expenditure on highly and partially processed foods. Individuals are likely to eat more quantity if offered a greater variety of food.16,17 Using a sample of primary care patients in the midwestern United States, Rohrer et al 18 found that individuals with food self-control problems are more likely to be obese.
In Canada, food purchased from restaurants accounts for more than 30% of the average weekly food expenditure per household. 19 In a review of Canadians’ eating habits, Garriguet 20 observed that more than 25% of Canadians aged 31 to 50 years exceed the safe limit of total calories derived from fats. Health Canada 21 reports that Canadian eating habits do not fully meet Canada’s food guide to healthy eating recommendations for vegetables, fruit, milk, and grain products.
Studies show that eating behavior is largely determined by demographic factors like age and gender,22,23 psychological factors, 24 socioeconomic class, 25 health status, and physical symptoms. 22 In a study among 1641 employees in the German metal industry, Reime et al 22 found that healthy eating behavior is significantly affected by physical symptoms, age, gender, and concern about health.
Several economic models have been proposed concerning how individuals allocate their financial and time resources to maximize health outcome. In these models, individuals are able to make optimal decisions on what to consume, in relation to their desired weight outcome. Recently, Ruhm 26 extended the traditional economic framework by allowing for the possibility that individual weight outcomes could also be determined by biological and environmental cues. These cues can subvert the decision part of the brain and may lead to wrong decisions. According to this model, advances in food engineering by producers may have contributed to the difficulty of resisting food cravings, hence increasing growth in obesity. The objective of this study is to examine the effect of eating behavior on obesity prevalence among Canadians, using panel data methods to account for individual-level unobserved characteristics.
Data
This study uses 4 waves (2002, 2004, 2006, and 2008) of the Canadian National Population Health Survey (NPHS). The NPHS is a nationally representative longitudinal survey of the Canadian population that collects vital information on health-related behavior as well as corresponding economic and sociodemographic variables. We limit our sample to individuals aged 18 to 65 years. After exclusion of missing observations, the unbalanced panel sample includes 29 722 person-year observations.
Study Outcome: Obesity
The study outcome, obesity, is a binary indicator for obesity prevalence. It is defined in the most commonly used classification (BMI ≥ 30).
Independent Variables
The key independent variable in this study is individual self-reported nutritional status (eating habit). In each wave (since 2002) of the NPHS, survey participants were asked to rank their eating habits. Individual answers were represented in 5 groups: excellent, very good, good, fair, and poor. We used 4 groups in our analyses, with the fair and poor groups combined as 1 category, fair/poor (referenced group). Much of the recent literature has focused on the mediating effect of food consumption on the relationship between economic factors and body weight.27,28 Also, studies have examined the association between some specific types of food consumption (eg, fruit and vegetables) and the risk of obesity. We hypothesize that to the extent to which an individual self-reported eating pattern captures behavioral responses to environmental, economic, and other decision-making factors, it may represent a more comprehensive measurement. In addition to examining eating habits, this study follows the standard practice in the obesity literature by using a number of control variables. Gender is captured by a dummy variable (male = 1, female = 0); marital status is represented by 3 dummy variables: married, separated, and single (reference group); 4 dummy variables represent individual educational attainment: less than secondary, secondary, some postsecondary (reference group), and postsecondary. Age is represented in years; household income is represented by 4 dummy variables: low income, middle low income, middle high income (reference group), and high income; ethnicity is captured by a dummy variable (immigrant = 1, Canadian born = 0); smoking status is classified as never smoker (reference group), current smoker, and former smoker; similarly, never drinker (reference group), current drinker, and former drinker represent drinking status; health status is represented by the individual health utility index, which is a more objective measure than self-rated health; individual physical activity level is represented by 3 groups: active, moderate, and inactive (reference group); provincial or regional effects are captured in 5 categories: Quebec, Ontario, Atlantic (comprising New Brunswick, Prince Edward Island, Nova Scotia, Newfoundland, and Labrador), Western (Alberta, Saskatchewan and Manitoba), and British Colombia (reference group); year dummies are included in all regressions to capture time trend in obesity.
Estimation Methods
The empirical model is based on a framework whereby individuals engage in activities that directly or indirectly affect their well-being (health outcomes). 5 To examine the relationship between eating behavior and obesity, we estimate the following reduced form linear probability model:

where i, j, and t represent, respectively, individual, province of residence, and time period. Obese represents obesity prevalence; food represents the category of eating habits; X is a vector of other control variables, including age, income, sex, education, marital status, ethnicity, physical activity status, smoking, and drinking status; and τ represents the year effects. The province fixed-effect variable, Q, is included to capture regional and other cultural factors that may influence an individual’s body weight. The standard residual term, ε ijt , is adjusted for clustering at the individual level.
Because most of the existing literature uses a cross-sectional framework, we first estimate Equation 1 by a baseline model, using ordinary least squares (OLS). OLS estimates from Equation 1 may result in a confounding bias when unobserved individual-specific characteristics are crucial in the determination of the outcome variables. For example, the observed individual covariates may not reflect biological and genetic factors, environmental cues, individual health preference, and other decision-making factors. To account for unobserved individual heterogeneity, Equation 1 can be rewritten as

The error term, ε ijt , from Equation 1 becomes µ i + υ ijt , where µ i represents time invariant individual-specific effects and υ ijt is the standard residual term. We estimate Equation 2 by the random effects (RE) model and fixed effects (FE) model. In the RE specification, µ i is assumed to be uncorrelated with other covariates in the model and the individual effect is permitted to be correlated with the covariates in the FE model. Longitudinal attrition (nonresponse) bias would result if the response pattern of individuals has an effect on the outcome variables. To test nonresponse bias, we use the simple-additional variable test by Verbeek and Nijman. 29 Three variables reflecting survey response pattern are created: the number of waves in which the individual appears, a dummy indicating whether an individual responds in the next wave, and a dummy showing whether the individual responds in all waves. We run separate regressions for the unbalanced sample with each of the attrition variables included. These test results do not reject (at the 10% significance level) the null hypothesis of no attrition bias in every estimation.
Results
Figure 1 illustrates the growth trend in the BMI classification from 2002 to 2008. This reveals a modest change in obesity prevalence in Canada. The summary statistics of the variables used in the multivariate analyses are reported in Table 1. The unconditional results show that 19.3% are obese. About 8% of the weighted sample reported excellent eating habits, 32% reported very good, 44% reported good, and 17% reported fair or poor. Almost 49% of the sample is female. In terms of educational attainment, 12% have less than secondary education (high school), 13% completed secondary education, 29% have some postsecondary education, and 45% have completed 1 or more postsecondary degrees.
Summary Statistics
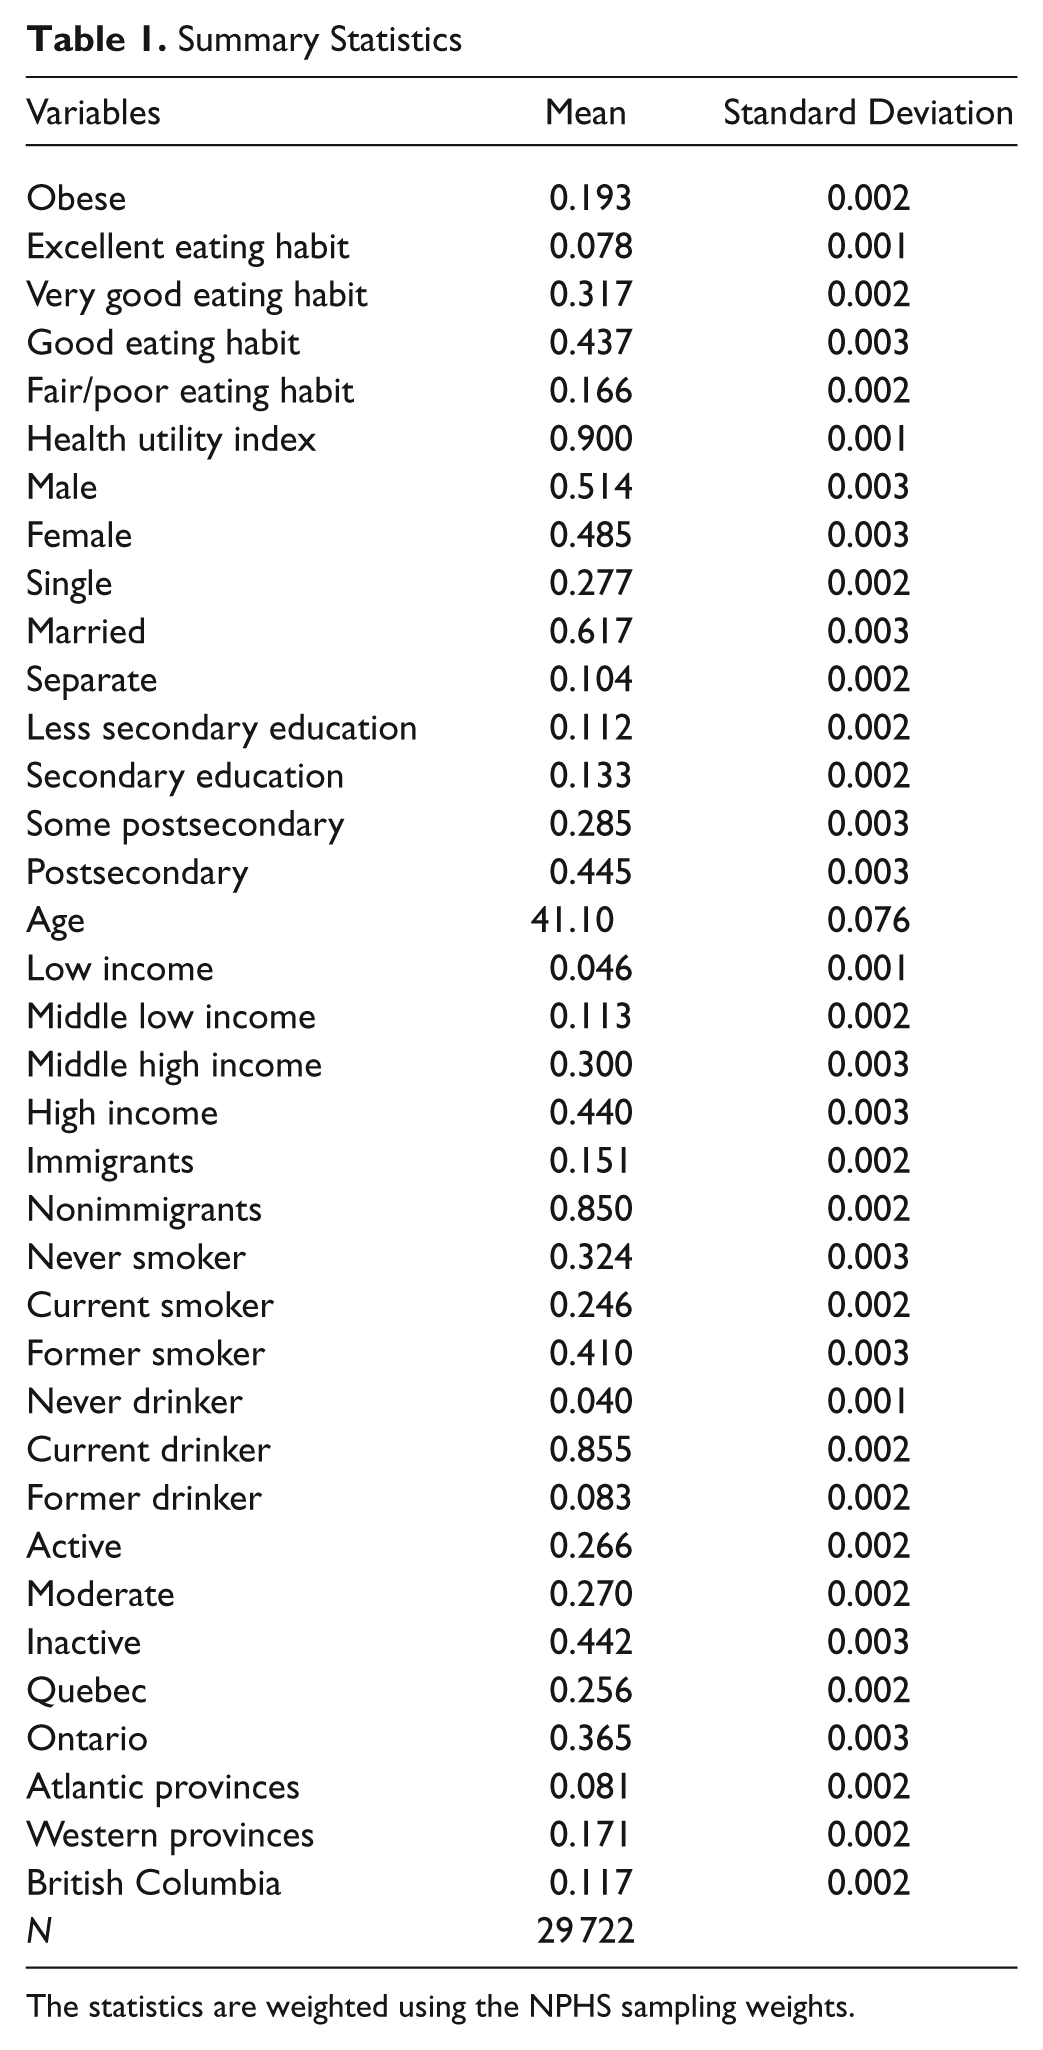
The statistics are weighted using the NPHS sampling weights.
The cross-sectional OLS and panel estimation (RE and FE) results for the whole sample are reported in Table 2. We find a statistically significant association between eating behavior and obesity prevalence. The cross-sectional model overestimates the effect of eating behavior on the likelihood of being obese. In all model specifications, individuals who reported excellent, very good, and good eating behavior are less likely to be obese compared with those with fair or poor eating behavior. For example, the OLS estimates in Table 2 (column 2) are as follows: excellent (β = −0.194, P < .01, confidence interval [CI] = −0.23 to −0.16), very good (β = −0.192, P < .01, CI = −0.22 to −0.17), and good (β = −0.112, P < .01, CI = −0.14 to −0.09). For other covariates, the results in general show a positive and statistically significant effect on obesity prevalence for each of male (β = 0.023, P < .017, CI = 0.04 to 0.042), married (β = 0.036, P < .01, CI = 0.012 to 0.060), age (β = 0.004, P < .01, CI = 0.003, 0.004), and former smoker (β = 0.032, P < .01, CI = 0.012 to 0.052). Being a current smoker (β = −0.026, P < .034, CI = −0.050 to −0.002) compared with the reference group (never smoker) reduces the probability of being obese. The physical activity (active and moderate) and immigrant (β = −0.048, P < .01, CI = −0.078 to −0.019) variables have expected negative signs. In the OLS and RE results reported in columns 1 and 2, individuals with active (β = −0.039, P < .01, CI = −0.056 to −0.021) and moderate (β = −0.019, P < .01, CI = −0.035 to −0.003) physical index are less likely to be obese compared with individuals with sedentary behavior. The health utility index (β = −0.099, P < .01, CI = −0.156 to −0.043) is negatively related to obesity prevalence, meaning individuals with high functional health are, on average, less likely to be obese. The year dummies show a significant positive trend in obesity prevalence. Socioeconomic status variables (education and income) are in general not statistically significant.
Linear Probability Model for Obesity Prevalence (Whole Sample)


Robust standard errors in parentheses. Although not reported, conditional panel logit model gives the same conclusion that eating behavior has a statistically significant effect on obesity risk. This suggests that the results are robust to model specification.
P < .01.
P < .05.
We also examine the heterogeneous effect of eating behavior on obesity prevalence by gender, and the results are reported in Table 3. The results obtained are similar for males and females: eating behavior is a significant determinant of obesity. Compared with individuals with fair or poor eating behavior, those with excellent, very good, and good eating behavior are less likely to be obese. The results for other covariates are largely similar to the whole sample estimation.
Linear Probability Model for Obesity Prevalence by Gender
Robust standard errors in parentheses. Although not reported, conditional panel logit model gives the same conclusion that eating behavior has a statistically significant effect on obesity risk. This suggests that the results are robust to model specification.
P < .01.
P < .05.
P < .1.
Discussion
Given the increasing obesity rates in many countries and their adverse consequences, policy makers continue to evaluate a number of ways to circumvent this growing trend. Several studies have linked obesity and overweight to the eating pattern of individuals, such as the amount and type of food consumed, timing and eating frequency, distribution of the meals over the day, and the frequency of meals eaten outside the home. 13 This study contributes to the literature in several ways. First, the analysis is based on a nationally representative sample, whereas most previous studies used samples that are not necessarily representative of the population, like focusing on teens or university students (eg, references 13 and 30). Second, the longitudinal structure of the data set enables us to control for the individual-level unobserved characteristics that may affect the way eating behavior is related to body weight. Third, we believe that to the extent to which an individual self-rated eating pattern captures behavioral responses to environmental, economic, and other decision-related factors, such self-rated eating pattern may represent a more objective measure of food consumption. Although self-rated health has been validated as a good proxy for individual health status, further research is needed to evaluate the accuracy of self-rated eating behavior. One limitation of this study is the use of the self-reported BMI, which could be subject to measurement error. However, the panel structure of the data helps to mitigate this problem. Moreover, as long as the errors are not systematic, consistent estimates can still be obtained.
From an economic perspective, obesity in itself may not be a problem as long as there is no market failure in the form of externalities, imperfect information, and consumer irrationality; otherwise, intervention measures will be needed and justified. It has been reported that health care expenditures of obese individuals are 42% greater than those with normal weight. 31 If the costs of financing the health care system, whether financing is from public or private sources, are not differentially higher for those with excessive body weight, nonobese people will be subsidizing the health care cost of those who are obese and a negative externality is created, justifying an intervention. Accordingly, some attempts have been made recently to internalize the health care costs induced by obesity. For example, the state of Arizona proposes charging a lump sum fee for obese individuals.
Given the substantial evidence that higher fast-food prices reduce BMI, especially among teens,27,32 several calls have been made to impose higher taxes on energy-dense food like fast food while subsidizing the cost of less energy-dense food like fruit and vegetables to affect eating behaviors and induce individuals to substitute healthy food for unhealthy ones. Following the idea of Gruber and Koszegi, 33 if individuals are sophisticated about their self-control problems and responsive to food prices, taxes could act as a self-control device for them. Hence, high taxes on unhealthy fast food can help in mitigating the rising trend in obesity. However, if individuals are highly unresponsive to taxes or have severe self-control problems, then a tax on fast food will reduce the monetary well-being of those individuals without altering their eating behavior. Other ways of encouraging healthy eating behaviors include providing subsidized meal programs in schools and universities to provide students with healthy food, restricting the kind of food supplied in these educational places to include only healthy foods, and providing gyms in schools. Moreover, education programs that raise awareness of the benefits of physical activity and the health implications of food choices, as well as compulsory warning labels about the health risks on food packing, similar to the one on cigarettes, may help to mitigate obesity rates.
Conclusion
We find evidence that eating behavior has a significant impact on obesity prevalence. Individuals who reported excellent, very good, and good eating behavior have a lower risk of obesity compared with those with fair or poor eating behavior. The conclusion of this study is similar to that of a recent study by Rohrer et al, 18 who examined the association between uncontrolled eating and obesity in adult primary-care patients. The authors found that individuals who have self-control problems concerning food are more likely to be obese. The findings of the current study suggest that improving the eating behavior of individuals could help reduce excessive body weight and its induced health risks.
Footnotes
Acknowledgements
This article uses Statistics Canada confidential data, and the opinions expressed do not represent the views of Statistics Canada. We are thankful to two anonymous referees for their valuable comments. We are grateful to Tatyana Koreshkova, Gordon Fisher, Ian Irvine, and Nikolay Gospodinov.
The author(s) declared no potential conflicts of interest with respect to the research, authorship, and/or publication of this article.
The author(s) received no financial support for the research, authorship, and/or publication of this article.