
Abstract
Netizens' demand for popular science could be seen as one important social representation of the public demand for science popularization in the information age. Based on the information searching behaviour of netizens, this paper uses two indicators (demand strength and breadth) to analyse and describe netizens' demand for popular science. It examines the features, the intrinsic structure, the developing trends and group-to-group differences of netizens' demand for popular science. The results reflect younger, more mobile and fragmented tendencies in science communication in the information society, revealing the features of netizens' concerns and knowledge of popular science.
The demand for popular science can be broadly defined as the demand of the public for education, dissemination and expanded services of science and technology. The traditional practice of demand research mainly uses questionnaires to investigate the public's attitudes and views on the contents, channels and forms of specific popular science themes, and to evaluate the supply–demand relationship and practical effects of popular science (Hu and Shi, 2011; Liu et al., 2012; Li and Ding, 2013).
With the development of the information society, the internet has become an important channel for the public to access scientific and technological information (Ren, 2011). The services and rules of the internet platform have deeply shaped the information behaviour of netizens (CINIC, 2017). Netizens' demand for popular science is scattered among many topics composed of ‘short and instant’ content, knowledge fragments and hyperlinks (Zhao and Shan, 2017). This means that the informatization of popular science demand— that is, the information-seeking behaviour of a large number of netizens—has become an important feature of popular science demand in the information age. Therefore, in conducting research on the popular science demand of netizens, we need to go beyond the means of questionnaires and find a measurement tool with both integrity and consistency.
Search engines are important gateways to internet information, and searching for information is the starting point for netizens seeking popular science information. Therefore, the information-searching behaviour of netizens can be seen as a direct manifestation of informationized popular science demand. By collecting and sorting search data on Baidu and using the popular science search index, this paper establishes a descriptive framework consisting of three tiers (‘themes’, ‘hot topics’ and ‘search items’) based on popular science keywords to describe the overall features of netizens and their demand for popular science, present the structures and features of various popular science needs, and measure the demand strength and level of subdivision of popular science.
Methodology
Measuring netizens' demand for popular science through their search behaviour is based mainly on:
defining the general content domain and its subdivisions, matching it with specific search content, and developing the concept and measurement of demand breadth
developing the concept and measurement of demand strength based on the Baidu Index of specific search content
subdividing and measuring netizens' demand for popular science based on the content domain by combining the indicators of strength and breadth.
Based on a number of popular science texts and with reference to a large number of netizens' search items, we have defined the content domain of popular science through the following steps:
Through content analysis of important popular science texts such as the reports on science and technology published in People's Daily and the archives of the ‘Scientists Meeting the Media Face-to-Face’ program, we selected a group of ‘seed’ words on popular science, which provides the initial structure of a seed thesaurus and an open thematic framework.
By matching the first group of seed words with the database of Baidu searches, we located other high-frequency words (‘derived’ seed words) through a second screening of the extracted search items.
By combining the initial and derived seed words, and through review, merger and selection by experts in the relevant fields, we established a database of popular science hot topics; and based on content analysis of popular science texts and search items, we developed a framework of popular science themes.
Based on the search data, we introduced two indicators—‘strength’ and ‘breadth’—to present the structure of netizens' demand for popular science (Table 2). Demand strength refers to the urgency of a particular demand, which is represented by the number of searches 2 for specific content and further quantified into the ‘search index’. Demand breadth refers to the subdivision of a particular demand, which is represented by the ‘search difference’ of specific content and further quantified into the number of ‘search items’ in the search data.
Measurement indicators for popular science demand
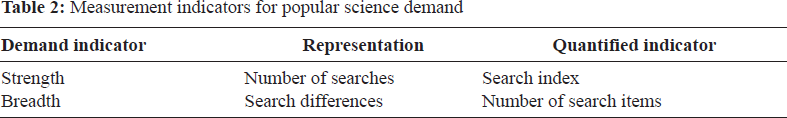
Measurement indicators for popular science demand
This paper uses the Baidu Index as the quantitative basis of demand strength. The Baidu Index is a measurement indicator based on the search data of netizens. Its value is proportional to the total amount of search requests. The index can be used to quantify the search trends of key words. 3 In order to capture the hierarchical structure of popular science demand, the professional edition of the Baidu Index (hereafter referred to as the popular science search index) is used to provide a systemic picture of netizens' demand for popular science.
The demand strength of popular science is proportional to the popular science search index. The search index of all items in the content domain of popular science is included in the search data. The search index of a hot topic is equivalent to the sum of the search indexes of the items contained in the topic, and the search index of a theme is equivalent to the sum of the search indexes of the hot topics contained in the theme. Such an approach produces a systematic measurement of the demand strength of popular science (Table 3).
Quantified strength and breadth of popular science demand
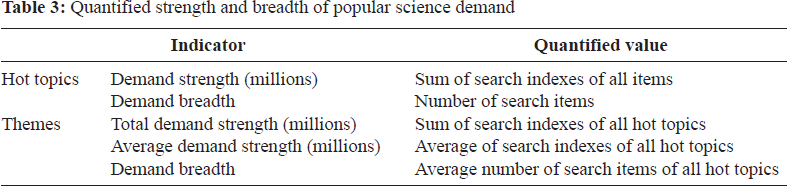
Quantified strength and breadth of popular science demand
The concept of demand breadth is directly related to the number of search items. Search items are information searched by netizens in search engines, and may be words, phrases or discourse fragments. Their contents reflect the questions that netizens want answers for. The more search items under a popular subject and the more questions raised about that subject, the higher the degree of subdivision of the relevant popular science demand. As a result, the number of search items generated through massive searching is a fair description of the demand breadth of popular science.
The demand breadth of a popular science hot topic is expressed by the number of search items it contains. Correspondingly, the demand breadth of a popular science theme is represented by the average number of search items contained in the hot topics under the theme (the average breadth of multiple hot topics). 4
The representation of different groups' popular science demand
We have introduced the target group index (TGI) to represent the popular science demand of different netizen groups. TGI, which reflects the tendency of a particular group relative to the general population, is used to observe the strength or weakness of the target group in a specific field. TGI is defined as:
TGI = 100 x the proportion of people with a particular feature in the target group / the proportion of people with such a feature in the total population
In our analysis of popular science demand, TGI stands for the demand strength excluding the group effect; that is, the average demand strength of individuals within a group. As such, it is more precise in presenting the average activity of individuals within a group and the demand difference among various groups. The following is an example of the TGI of the demand of adolescents under 19 years of age for knowledge about ‘depression’:
TGI< 19, depression = 100 x (DS< 19, depression / number of netizens under 19) / (DS overall, depression / total number of netizens) 5
In most cases, the average demand strength of individuals within the target group can be expressed as:
TGI = 100 x (proportion of demand of target group / proportion of population of target group)
Results and analysis
This section analyses the characteristics of netizens' demand for popular science from four perspectives: the groups' features, the intrinsic structure, the developing trends and the differences between various groups.
Features of netizens' demand for popular science among different groups
Based on search data, we located ‘popular science netizens’ by examining their search contents and concluded the overall features of netizens' demand for popular science according to the demand strength of different groups.
Netizens with popular science demand tend to be younger
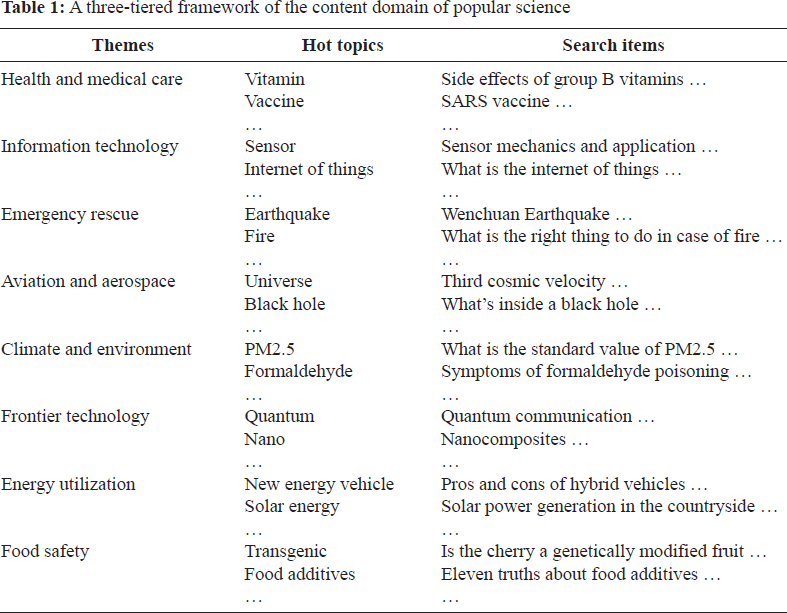
The data shows that 91.7% of all popular science netizens are under 40 years old, and 8.3% are over 40 years old (Figure 1). Therefore, netizens with popular science demand tend to be younger. Among those aged 39 and below, those aged 20–29 have the strongest overall demand for popular science.
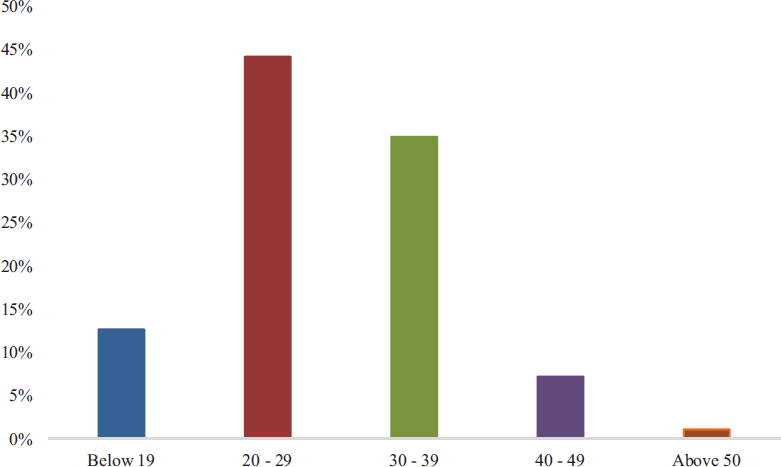
Age structure of netizens' demand for popular science (2016)
Among all popular science netizens, males account for about 67.8% (Figure 2). This data shows that male netizens are the main source of demand for popular science, and the overall demand strength of males is twice as strong as that of females.
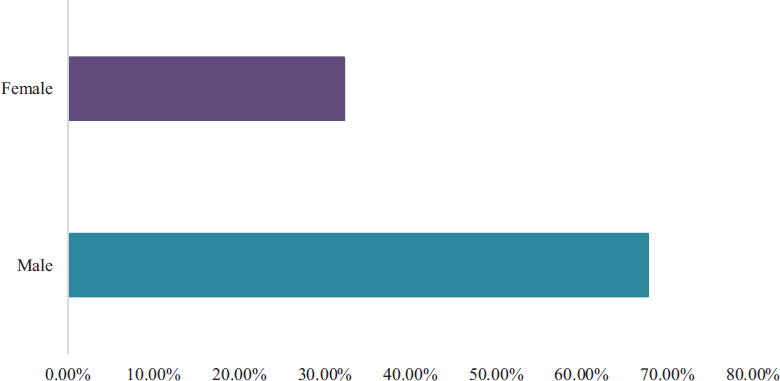
Gender structure of netizens' demand for popular science (2016)
The data from 2016 shows that the distribution of netizen demand for popular science in China (Hong Kong, Macao and Taiwan not included) is unbalanced. The overall strength of popular science demand in the top 10 provinces is close to 64% of that of the whole country, and that of the bottom 10 provinces accounts for only 7.5% (Figure 3). Overall demand is notably lower in Ningxia, Qinghai and Tibet due to the small number of netizens (Zhao and Shan, 2017) and low level of informatization (CINIC, 2016) in those regions.
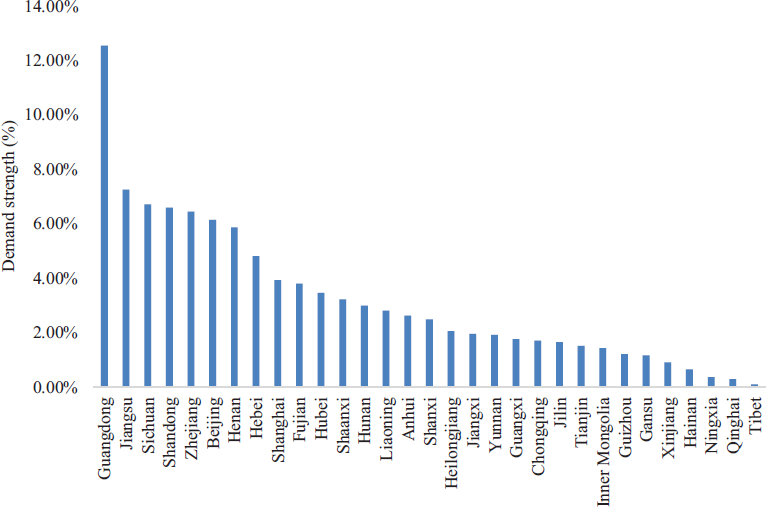
Regional structure of netizens' demand for popular science (2016)
In 2016, about 69.0% of the demand strength of popular science came through mobile devices, and about 31.0% came through personal computers (PCs) (Figure 4).
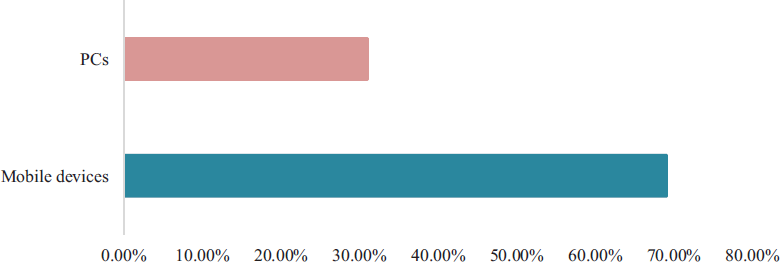
Conduits for netizens' demand for popular science (2016)
Based on the 2016 data, we analysed the intrinsic structure of netizens' demand for popular science in the two dimensions of theme and hot topic, and located its two characteristics: the intrinsic connection between demand strength and demand breadth, and the long-tail structure of demand.
The thematic structure of demand
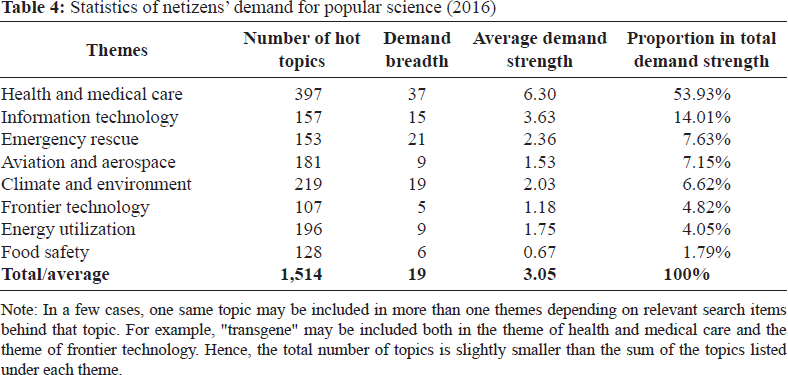
Table 4 provides the descriptive statistics of the 2016 data of netizens' demand for popular science. The eight popular science themes contained 1,514 hot topics, with an average demand strength of 3.05 and an average demand breadth of 19.
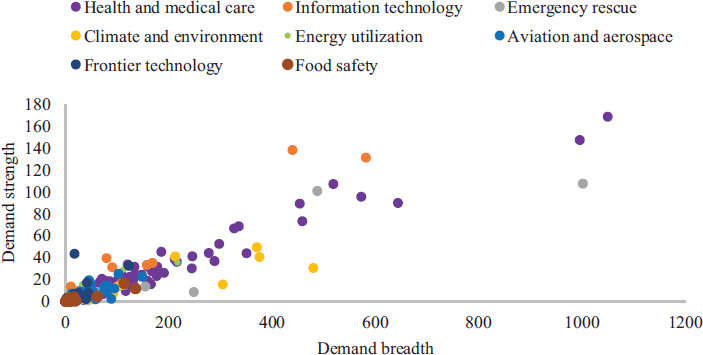
The following analysis uses the strength and breadth of demand to give a full picture of the substructure of popular science themes. The eight themes are divided into four echelons (Figure 5). Health and medical care is in the first echelon, with strong and highly segmented demand. The second echelon includes three themes, with high demand strength for information technology and high demand breadth for emergency rescue and climate and environment. Aviation and aerospace and energy utilization are in the third echelon, with lower strength than the second echelon, and about half of its breadth. Frontier technology and food safety are in the fourth echelon, with about half of the breadth of the third echelon.
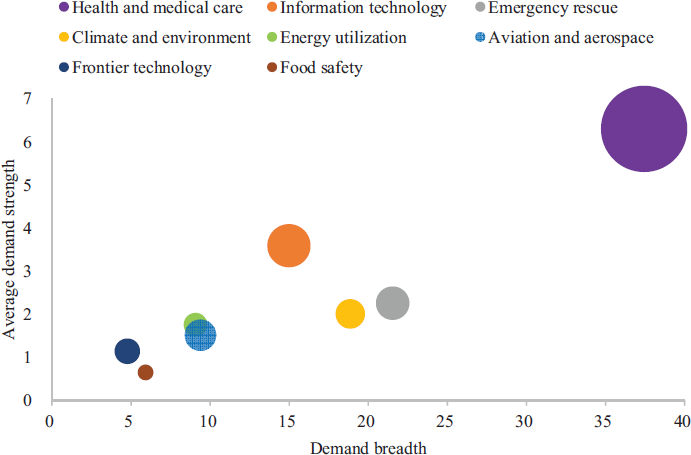
Thematic structure of netizens' demand for popular science (2016) Note: The x-axis and y-axis represent the demand breadth and average demand strength, respectively, and the size of the circle reflects the overall demand strength of the theme.
The structure of the 1,500+ popular science hot topics is shown in Figure 6. Most of them (86%) are concentrated in the interval with the breadth of 1 to 20. The results of the analysis show that the demand strength and breadth of popular science hot topics are positively correlated; the correlation coefficient is r = +0.94 (P < 0.05). If the 208 topics with 20+ breadth are selected, the correlation coefficient is r = +0.93 (P < 0.05); if the 28 topics with 200+ breadth are selected, the correlation coefficient is r = +0.82 (P < 0.05). Such correlation, to a certain extent, reveals the formation mechanism of popular science hot topics: the increase in demand strength means higher attention, and if the higher attention brings new cognition, new demands (breadth first) will be generated, which in turn increases demand strength; if the attention is not translated into new cognition, the demand breadth will not increase (strength first), but will restrict further expansion in demand.
Hot topics structure of netizens' demand for popular science (2016)
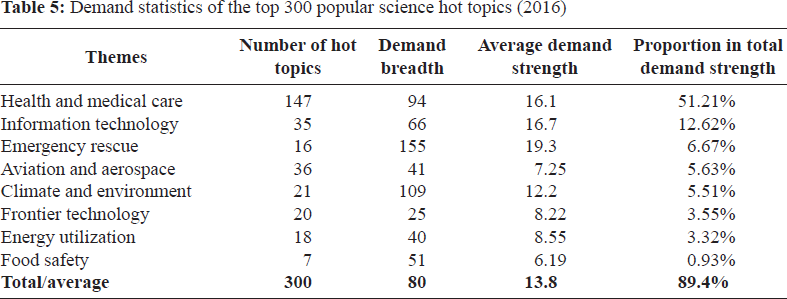
The statistics of the top 300 popular science hot topics, sorted in order of demand strength, are listed in Table 5. Compared to Table 4, the average demand strength and breadth of the 300 topics were more than four times those of all topics. Among them, the demand breadth of health and medical care, emergency rescue and climate and environment was higher than the total average; the average demand strength of health and medical care, information technology and emergency rescue was higher than the total average.
Statistics of netizens' demand for popular science (2016)
Statistics of netizens' demand for popular science (2016)
Note: In a few cases, one same topic may be included in more than one themes depending on relevant search items behind that topic. For example, “transgene” may be included both in the theme of health and medical care and the theme of frontier technology. Hence, the total number of topics is slightly smaller than the sum of the topics listed under each theme.
Demand statistics of the top 300 popular science hot topics (2016)
Of all the 1,500+ hot topics, the demand strength of the top 300 accounted for nearly 90% of the total demand strength. The distribution of the strength of demand displayed a long-tail structure (Figure 7). As far as the supply side of popular science is concerned, the hot topics constitute the main body of netizens' demand for popular science, which needs to be further studied in their social context.
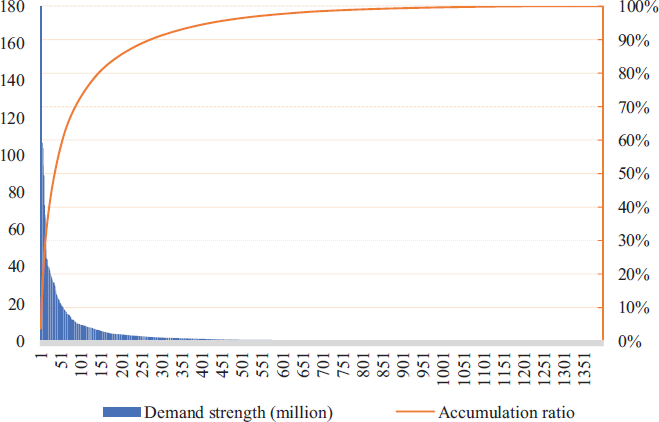
Long-tail structure of netizens' demand for popular science (2016)
Our analysis of post-2011 data shows that increased mobile device use, online medical services, frontier technologies and environmental concerns are the four main trends driving the development of netizens' demand for popular science.
Mobile device use is a long-term trend in demand
From 2011 to 2016, the total strength of netizens' demand for popular science increased from 970 to 5,190, up by 430%, including a 230% increase on PCs and a 1,270% increase on mobile devices. The growth of demand on mobile devices is significantly higher than that on PCs, and its share in the total increased from 29.1% to 69.0%. There is thus a clear trend towards mobile device use (Figure 8).
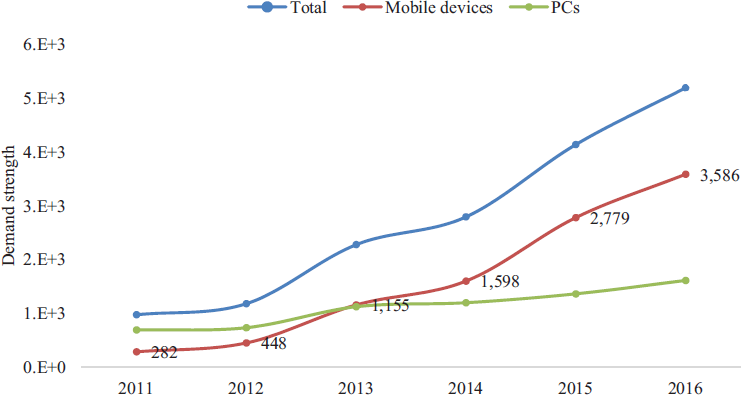
Trends in netizens' use of different devices
The post-2011 data shows that searches related to health and medical care were the highlights in the eight themes, accounting for 53.1% of the total demand strength (Figure 9).
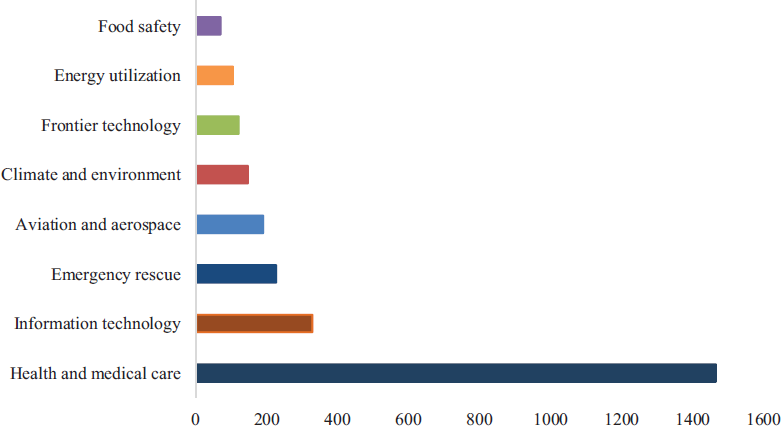
Total demand strength of various themes (2011–2016 average)
Various diseases constitute a main category of hot topics under the theme of health and medical care. Taking 2016 as an example, there were 397 hot topics under that theme, of which 130 were directly related to diseases. The total demand strength, which stood at 1,510, accounted for 62.0% of the theme. The average demand strength of disease-related subjects was 66, and the average demand breadth was 11.6; the average demand strength of non-disease-related subjects was 23, and the average demand breadth was 3.70; there were 57 cancer-related subjects, with total demand strength of 319, average demand strength of 28 and average demand breadth of 5.59 (Figure 10).
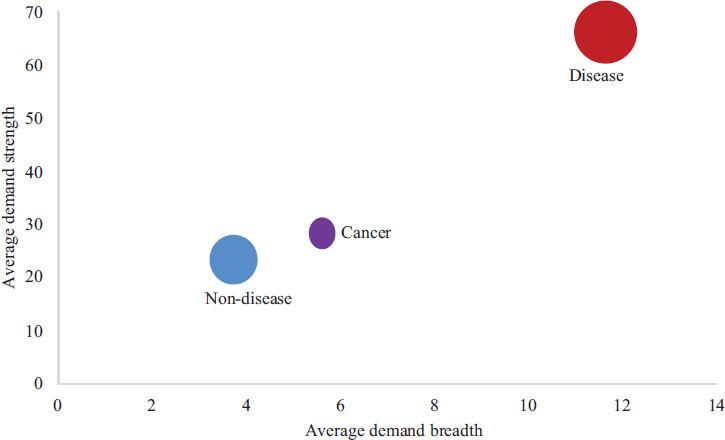
Demand structure for health and medical care (2016)
From 2011 to 2016, frontier technology was the fastest growing popular science theme, and its demand strength increased from 19 to 211, up by more than 10 times (Figure 11). In recent years, hot topics under the theme of frontier technology, such as artificial intelligence, materials, biology and quantum physics, have spread on the internet at a faster pace, triggering growing attention and discussion of technological developments. The 107 hot topics under this theme had an average demand strength of 1.18 and a demand breadth of 5, which shows that netizens are generally unfamiliar with this theme, and there is thus a huge space for growth in demand.
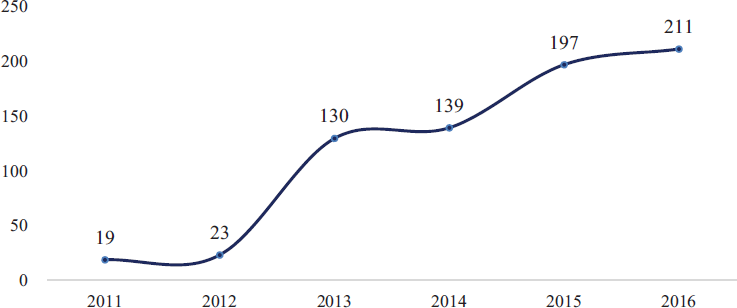
Total demand strength under the theme of frontier technology (2011 to 2016)
Compared with other popular science themes, the demand strength of the emergency rescue and climate and environment themes was more frequently affected by extreme weather, geological disasters and other natural events (Figure 12).
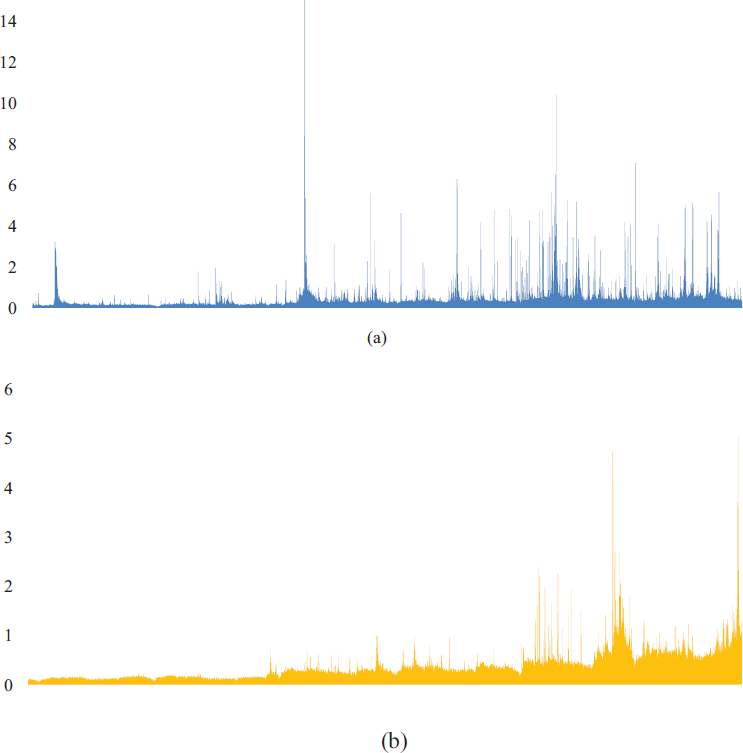
Daily demand strength (millions) of (a) emergency rescue and (b) climate and environment (2011 to 2016)
Under the theme of emergency rescue, earthquakes, typhoons and floods ranked among the highest in both demand strength and breadth; under the theme of climate and environment, smog, air quality and particulate matter (PM2.5) ranked among the highest in both demand strength and breadth. Netizens' interest in these topics was mostly triggered by related events, which could quickly bring secondary attention onto similar topics. Data suggests that, on most occasions, the peak of demand for a particular topic appeared within the first week following the related event. This shows that popular science demand under the themes of emergency rescue and climate and environment had the features of both long-term homogeneity and short-term randomness, and therefore requires rapid responses that are professional and systematic.
To further reveal the detailed characteristics of netizens' demand for popular science, we used the average demand strength (demand TGI) of the top 300 popular science hot topics to analyse the demand difference among netizen groups. We found that there was a notable difference in the demand TGI among different groups, which showed high degree of variation of their interest in popular science topics.
Age-to-age differences in demand
Comparing the demand TGI of netizens from all age groups, we found that individuals' demand for popular science was the strongest in the 30–39 and 40–49 year age groups, and was notably higher than the average; individuals' demand was relatively weak in the 20–29 age group, and lower than the average; it was weakest in the under-19 and over-50 groups, and significantly lower than the average (Figure 13). Netizens aged 30 to 39 years were particularly interested in information technology, energy utilization and food safety. Netizens aged 40 to 49 years were particularly interested in emergency rescue and energy utilization. There was no obvious concentration of interest in themes among netizens in other age groups.
Judging from the demand TGI, there is notable variation of interest in the 300 hot topics among netizens of all age groups. Taking the 30–39 age group as an example, many of the subjects that drew their interest were health issues related to marriage and childbirth (Figure 14). Compared with netizens aged under 20, such a tendency reflects the particular popular science demand they have developed at a specific stage of life. Other hot topics, such as internet conference, Tiangong-1 (China's first space station), aircraft carriers and polar light, represented the younger face of the 30–39 age group in information aesthetics.
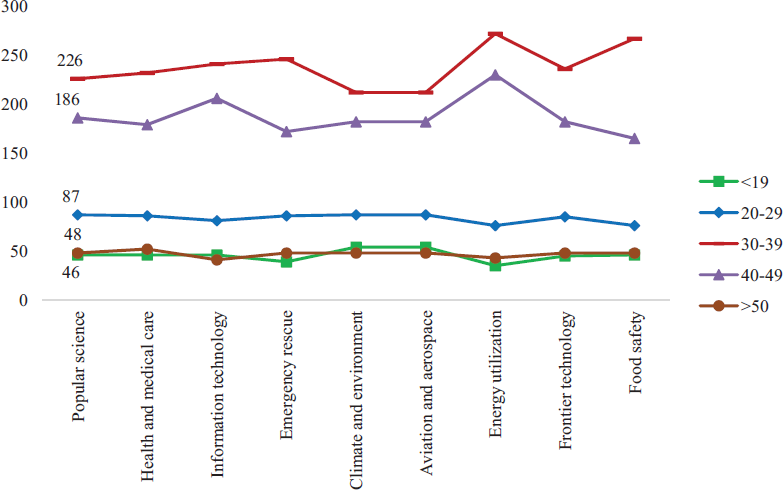
Age-to-age differences in netizens' demand for popular science (2016)
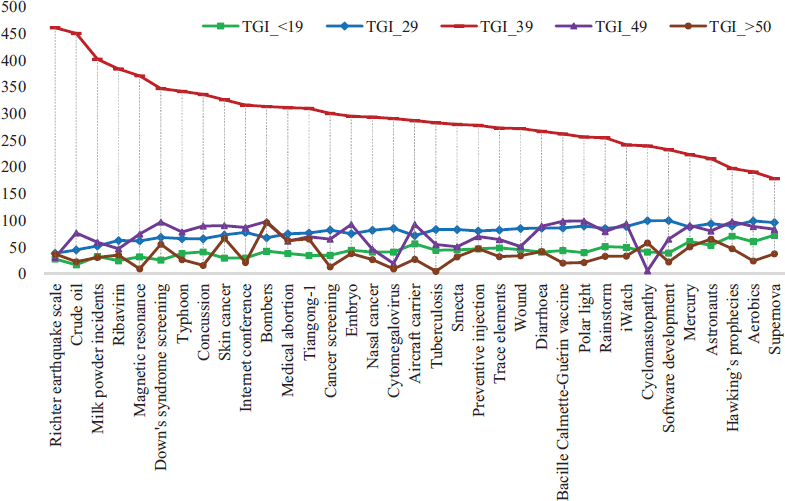
Demand TGI of netizens aged 30–39 for popular science subjects (TGI<19, 20–29, 40–49, >50 < 100, 2016)
Comparing the demand of male and female netizens, we found that the demand TGI of female netizens was 123 and that of male netizens was 92, which speaks to stronger individual demand of female netizens. Moreover, the demand TGI of female netizens for health and medical care and food safety was significantly higher than that of male netizens (Figure 15).
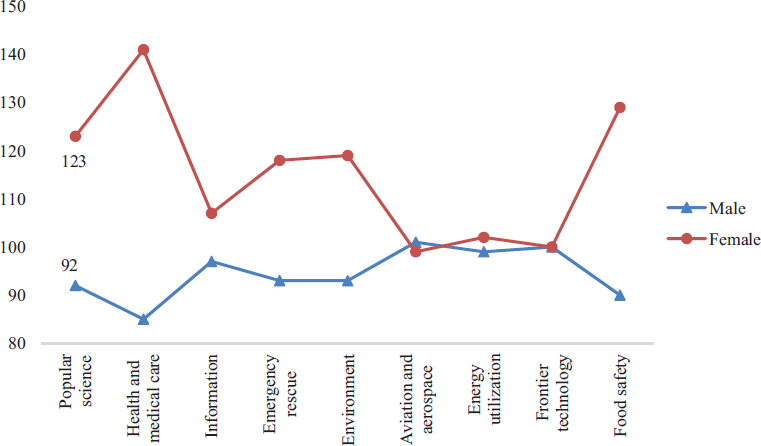
Gender differences in netizens' demand for popular science (2016)
Compared with male netizens, female netizens were particularly interested in safety issues (health and the environment), which was more evident at the level of hot topics. In the order of demand TGI of female netizens, the top 50 of the 300 topics almost all came from the health theme; most were about diseases, nutrition, health preservation and other physiological and psychological questions (Figure 16). As the gender difference of demand TGI suggests, when male TGI was less than 80, female TGI was all over 150, which clearly reveals the feminine features of these subjects.
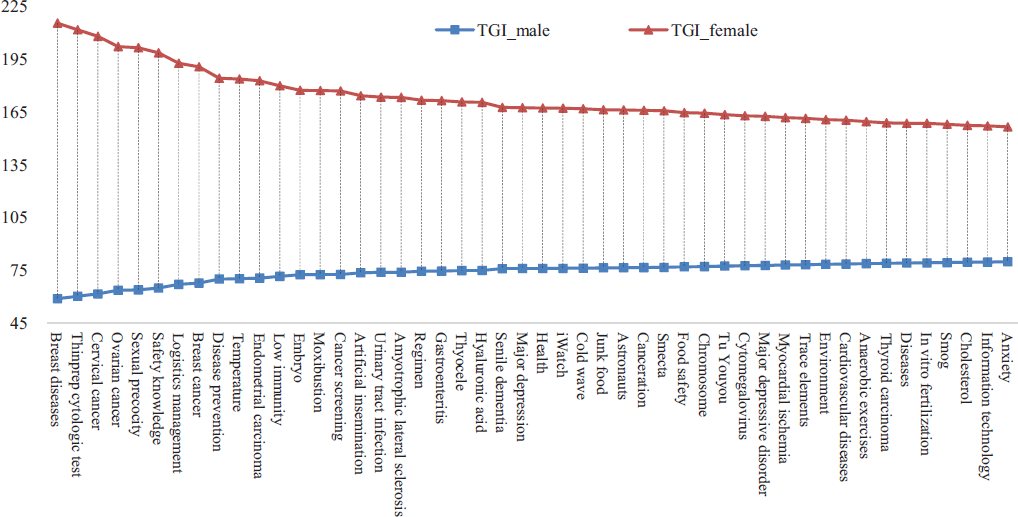
Demand TGI of female netizens on hot topics (TGI male < 80, 2016)
The subjects for which the demand TGI was relatively higher among male netizens were concentrated in aviation and aerospace, information technology and frontier technology, including aircraft carriers, quantum physics and the space station (Figure 17). Comparing the TGI differences of male and female netizens, we can see that these subjects do carry some masculine features, but not as prominently as the group features of female netizens.
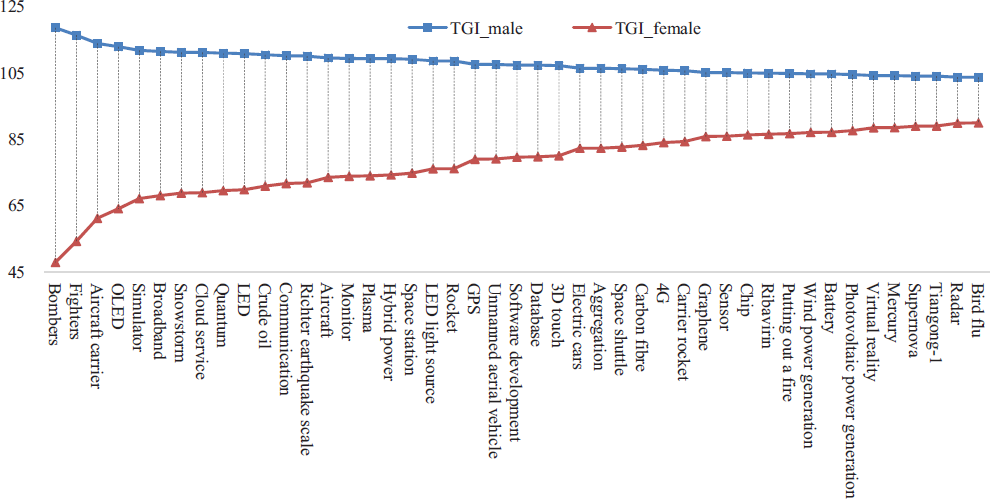
Demand TGI of male netizens on hot topics (TGI female < 90, 2016)
Comparing the demand TGI of netizens from different regions, we found that there was a significant difference in the strength of individuals' demand for popular science. The distribution of demand TGI in Figure 18 is different from the distribution of demand strength in Figure 3. For example, compared to overall demand strength, the rankings of Beijing, Shaanxi, Sichuan and Tianjin in individuals' demand strength went up, while those of Shanghai, Guangdong and Shandong came down. This is because TGI excludes the influence of the number of netizens on overall demand strength and is therefore more accurate in reflecting the strength of the individual demand of netizens from different regions.
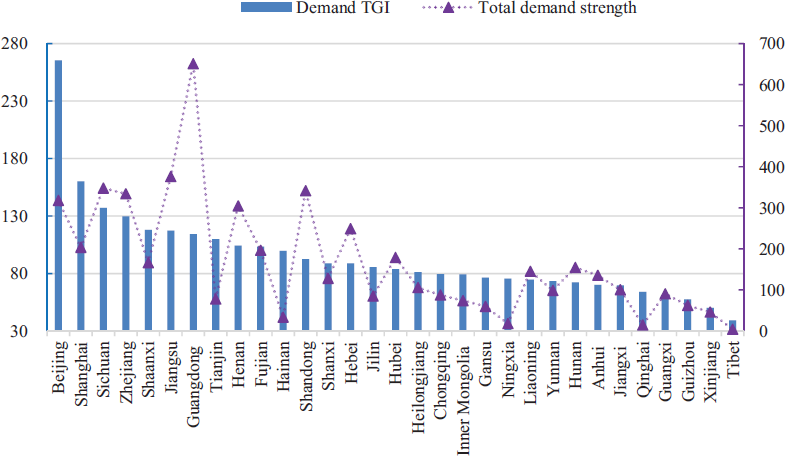
Regional differences in netizens' demand for popular science (2016)
In addition, netizens from different regions demonstrated a visible variation of interest in different hot topics, which may be related to their local conditions, such as health services, technologies, industries, climate and environment. The subjects of particular interest to netizens from different regions can be found in DSP (2016).
There was a notable difference in the ways netizens accessed information under different themes. For the themes of health and medical care, emergency rescue, climate and environment, they were notably more active on mobile devices than on PCs, while on the other themes they were no more active or even less active than on PCs (Figure 19). Although netizens' demand for popular science came primarily through mobile devices, PCs remained an important means of access.
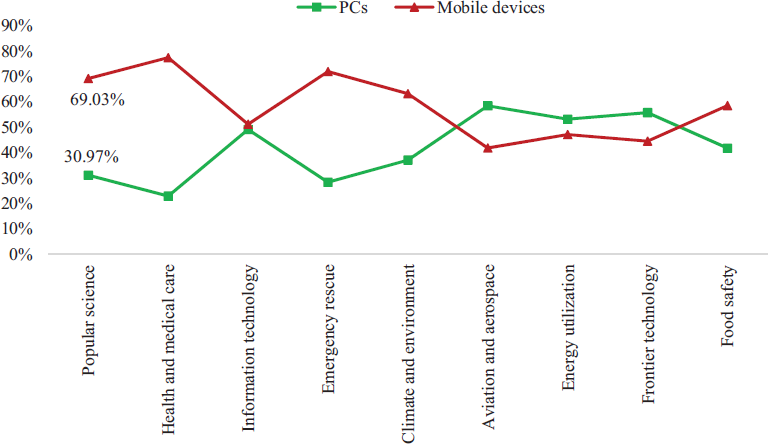
Demand strength of themes on PCs and mobile devices (2016)
In terms of hot topics, the fields where PC users were more active than mobile device users were concentrated in information, intelligence, new energy and other emerging technologies (Figure 20). On the whole, the demand through mobile devices aimed mainly to address personalized and life-based scenarios, which were still about health and environmental safety, while PC users had a broader perspective for popular science and a clearer direction of learning and personal interest.
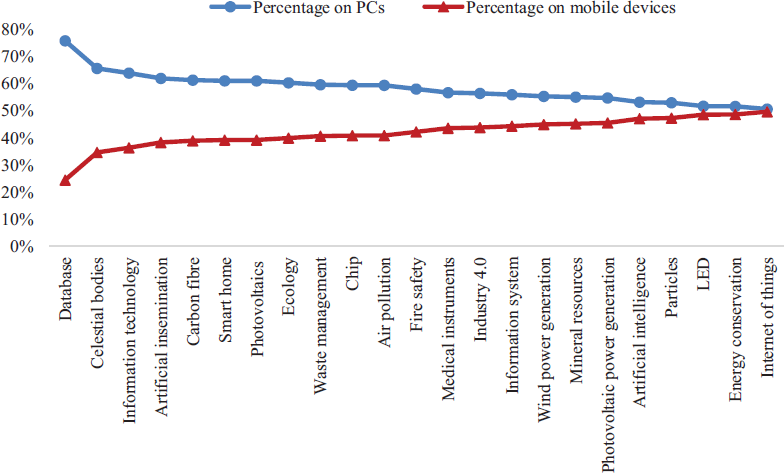
Popular science hot topics that were accessed on PCs and mobile devices (2016)
Web 2.0 has led to more active information behaviour, strengthened information exchanges and sharing among netizens, and encouraged them to get to know themselves through mutual observation, thus stimulating the aggregation of demand and the formation of new demand. Netizens' demand for popular science is also constantly being subdivided and reconstructed. Based on the above perspective, this paper analyses the structure and characteristics of that demand by establishing the link between search behaviour and popular science demand. The following findings can help us reflect on the supply–demand relationship of popular science in the information age:
Structurally, popular science content is increasingly accessed using mobile devices, is dominated by young and male netizens and is regionally unbalanced.
There is a strong correlation between the strength and breadth of netizens' demand for popular science, which is related to the formation mechanism of popular science hot topics.
There is a long-tail structure in the demand for popular science, in which 20% of hot topics constitute its head.
There are four main trends in post-2011 demand: mobile device use, online medical services, frontier technologies and environmental concerns.
There are visible group differences in demand: female netizens are more active than male netizens, the 30–49 age group is more active than other groups, and the netizens in Sichuan, Zhejiang, Shaanxi and Jiangsu have the same level of activity.
Measured by the average demand strength of individuals, there is visible variation of different netizen groups' interest in popular science hot topics.
Mobile device use to meet the demand for popular science is more evident in the field of health and environmental safety. PC users remain an important source of high-end popular science interest.
The internet has built a network of personal relations and behaviours and propelled a structural change in demand for popular science. Our analysis shows that the netizen group with such demand is younger, that its information-seeking behaviour is highly segmented, and that the formation and aggregation of popular science demand are driven by male and young netizens. Excluding the effect of group size, minority groups of netizens, such as female netizens and those aged 30 to 49 years, although without a dominant role in setting the information agenda, happen to be the more active part of the popular science audience on the internet. The adolescent and elderly groups are notably less active. These characteristics, which have deviated from the social context of popular science in the traditional form (older, younger, homogenization, etc.), present the first supply-side challenge to science popularization.
In terms of the intrinsic structure of popular science demand, the group effect leads to a convergence and homogeneity and the differences among groups lead to the subdivision of individuals' demand, shaping the long-tail structure of demand. The very existence of the long tail means that there are two ways to improve communication efficiency: to meet the head needs of the main audience, or to explore the tail needs of the active audience.
Reconstructing the integrity of popular science demand
Mobility and fragmentation are important features of informatization. Mobile applications have severed the spatial link between scenarios and demand, and fragmented information has severed the temporal link between demand and behaviours. As a result, it is difficult for individuals to effectively organize their behaviour and manage their demand and to establish a continuous response to demand with behaviours. Therefore, the second supply-side challenge to science popularization is to help the audience reconstruct the integrity of popular science demand and maintain the self-consistency of demand elements such as scenarios, behaviour, time and space, so as to establish a demand model that can adapt to mobility and fragmentation.
Such a demand model can only be realized through two pathways: technology and knowledge. The technology pathway leads to information management, behaviour history, scenario recognition and intelligent recommendations, while the knowledge pathway leads to the ground layer of data and algorithms (that is, holistic research and the systematic integration of popular science demand).
Rebalancing popular science supply and demand
The third supply-side challenge to science popularization is the rebalancing of supply and demand. According to the analysis of netizen demand for popular science in this paper, there are three impediments to the supply–demand balance of popular science information:
The selectivity of netizen groups. Given the varying sizes, levels of activity and aesthetic preferences of different groups, whether science popularizers focus on the head or the tail of the long-tail structure, and whether they focus on meeting existing demand or exploring new demand, not only concerns the allocation of resources but also affects the efficiency of communication.
The two-dimensional structure of demand. The strength and breadth of popular science demand each represent the aggregation and subdivision of popular science hot topics. In areas where demand strength is more important, collaborative communication should be enhanced, while in areas where demand breadth is more important, creating differentiated content should be the priority. As a matter of fact, these two strategies are yet to be effectively combined in practice.
The retreat of the public agenda. As the public agenda on the social networks is restricted by the policy and media environment, mobile media platforms are flooded with themes on private life, which have, to a certain extent, decoupled science communication from social issues and public policies and weakened the public appeal of popular science campaigns. On popular themes such as climate, the environment and energy, maximizing the public functions of science communication will help display the science behind the themes and inspire the public to deal with practical problems with a scientific attitude.
Data statement
If not specifically noted otherwise, all data used in this paper is derived from Baidu Index (Professional Edition for Science Popularization), jointly built by the Department of Science Popularization of the China Association for Science and Technology, Baidu Data Research Center and China Research Institute for Science Popularization.
Footnotes
1
By the end of December 2016, the content domain of popular science defined by the above procedure contained eight themes, 1,500 hot topics and 28,000+ search items, which established the database for subdividing and measuring netizens' demand for popular science.
2
Close to the concept of ‘page view’, ‘number of searches’ here means the sum of all IP searches.
4
The number of hot topics included in each popular science theme varied. Therefore, the average demand breadth of multiple hot topics was used to measure the degree of demand for a theme.
5
DS in the formula means demand strength.
Author biographies
Liming Wang is an assistant researcher at China Research Institute for Science Popularization. His research interest is in the effective communication of science within the social network.
Qi Zhong is a research fellow at China Research Institute for Science Popularization. Her research interest is in the relationship between media and science and its evolvement.