
Abstract
Purpose
Despite the growing emphasis on promoting school collaborations, few quantitative studies have investigated the relationship between school-to-school collaboration and student learning, particularly outside the United Kingdom and the United States. This study examines the effects of Shanghai's Strong School Project (SSP), a policy initiated in 2018 to improve low-achieving schools through partnerships with high-performing schools, on students’ academic achievement and explores potential mediating factors.
Design/Approach/Methods
We used data from the 2018 and 2021 waves of the evaluation of middle school quality in Shanghai, including test scores in Chinese, English, Math, and Sciences, and surveys of students, teachers, and principals. Our analysis employed difference-in-differences (DID), propensity score matching combined with DID analysis (PSM-DID), and causal mediation analysis within the framework of DID.
Findings
School-to-school collaboration through SSP significantly enhanced test scores in all four subjects. The most pronounced effect was in Math, with a 0.67 standard deviation increase, followed by Chinese at 0.63 standard deviation. Causal mediation analysis indicated that improvements in academic performance primarily stemmed from enhanced peer relationships and principal leadership.
Originality/Value
This study provides quantitative evidence linking school-to-school collaboration with student learning outcomes, highlighting positive associations between collaboration and school outcomes in China, adding to the predominant literature from the United Kingdom and the United States.
In recent decades, the practice of improving low-performing schools through school-to-school collaboration has gained popularity worldwide. These collaborations often partner low-performing schools with high-performing ones, focusing on enhancing school leadership and teaching practices to initiate positive changes within weaker schools by sharing best practices and resources (Chapman & Muijs, 2014; Wu et al., 2024). These collaborations can take various forms, ranging from symbolic partnerships to deep collaboration, often described as federations, partnerships, networks, or confederations. School-to-school collaboration initiatives have emerged in diverse contexts, including the United States, Europe, Chile, and China (Pino-Yancovic et al., 2020; Wu et al., 2024).
One prevalent model in school-to-school collaboration, particularly in cases that focus on improving underperforming schools, involves a uni-directional flow of resources. In these cases, high-performing schools provide leadership, teacher development, and instructional improvement support to weaker schools. This model is driven by the need for significant capacity-building in underperforming schools, where knowledge and resource transfer flow primarily in one direction (Chapman & Muijs, 2014; Wu et al., 2024). The Strong School Project (SSP) in Shanghai reflects this model, where leadership and advanced teaching resources are transferred from stronger to weaker schools to enhance student outcomes.
Despite the increasing use of school-to-school collaborations as a policy tool, there is a lack of quantitative studies examining their impact on student learning, particularly outside the United Kingdom (Armstrong et al., 2021). Most existing quantitative research focuses on U.K.-based initiatives, where school collaboration is central to national education policy (Chapman & Muijs, 2014; Muijs, 2015). As these initiatives gain popularity worldwide, it is essential to understand their effects in different educational contexts, especially since underperforming schools often struggle with inadequate teaching competence, low job satisfaction, and weak leadership. Understanding how school-to-school collaboration influences academic performance in low-achieving schools is key to developing effective school improvement policies.
This study utilizes a comprehensive dataset on student achievement in mathematics, Chinese, English, and science, as along with background information on students, teachers, principals, and parents from all middle schools in Shanghai from 2018 to 2021. We investigate the impact of the SSP—a government-led initiative—on student outcomes. Using statistical models such as difference-in-differences (DID) and propensity score matching combined with DID analysis (PSM-DID), we identify significant test score improvements in low-performing schools after 3 years of participation in the SSP. Additionally, causal mediation analysis within the DID framework is employed to uncover the mechanisms behind these effects.
Literature review
Defining school-to-school collaboration
School-to-school collaboration refers to partnerships between schools aimed at improving educational outcomes through the sharing of resources, knowledge, and practices. These collaborations take on various forms, existing along a spectrum of engagement ranging from loose associations to deep, interdependent partnerships. The central objective is to leverage the strengths of one or more schools to enhance the performance of others, typically within broader school improvement initiatives (Azorín & Muijs, 2017; Chapman & Hadfield, 2010). Research consistently highlights that such collaborations foster professional development, mutual support, and educational innovation (Chapman, 2015; Pino-Yancovic et al., 2020).
Several conceptual frameworks categorize school-to-school collaboration based on the depth of interaction and the level of reciprocity involved. Early models, such as Little's (1990) and Smith's (2009), distinguish between basic information-sharing activities and deeper forms of teamwork. Similarly, Ainscow and West (2006) proposed a four-tier typology encompassing association, cooperation, collaboration, and collegiality, while Shen et al. (2004) described a continuum ranging from symbolic relationships to simultaneous renewal, where schools engage in shared transformation processes.
While some frameworks emphasize reciprocal resource exchange, others focus on uni-directional support, where higher-performing schools assist weaker ones without expecting reciprocal benefits (Chapman & Muijs, 2014; West, 2010). Such uni-directional collaborations are often seen in targeted intervention programs, particularly in contexts where educational disparities exist.
In China, a distinctive form of school-to-school collaboration has emerged under the umbrella of formal school groupings, often referred to as “education collectives.” Lin et al. (2024) examined these collectives, which typically involve a central organization, such as a university or state-owned enterprise, providing curriculum resources and teaching expertise to participating schools. However, the collaboration discussed in this study, known as the SSP, represents a departure from this model. Unlike education collectives, the SSP was a one-time, 3-year intervention that maintained the existing governance structures of participating schools and did not involve external institutional oversight.
Leadership also plays a critical role in facilitating effective school-to-school collaboration. Recent studies have shifted their focus toward understanding leadership behaviors within these networks. Greany and Kamp (2024), using complexity theory, highlighted the importance of adaptive, facilitative leadership in managing inter-school partnerships. They argued that traditional, top-down leadership approaches are insufficient in complex, multi-school contexts. Instead, leaders must adopt a multifaceted approach that balances operational, entrepreneurial, and enabling leadership styles. Fang et al. (2024) further explored the nuances of leadership within school networks. They found that low-rated leaders exhibited a control-oriented leadership style, characterized by dominating organizational operations. In contrast, high-rated leaders adopted a caring-oriented leadership style, prioritizing the needs, concerns, and situations of their members.
Collectively, these insights underscore that school-to-school collaboration is not a one-size-fits-all endeavor. The effectiveness of these partnerships depends on the depth of interaction, the balance of reciprocity, and the leadership styles employed.
School-to-school collaboration and student learning outcomes
The evidence surrounding the influence of various forms of school collaboration on student learning outcomes is mixed. Existing quantitative studies predominantly come from practices within the United Kingdom, where inter-school collaboration has gained prominence in national education policies over recent decades (Armstrong et al., 2021). Initially, inter-school collaboration in the United Kingdom operated on a voluntary basis. Over the past 25 years, collaborative initiatives among schools often involved short-term financial incentives for participating institutions provided by the government, such as the Beacon Schools initiative and the Network Learning Communities (NLC). A retrospective study conducted by Smith (2015) delved into the Beacon Schools initiative (1998–2004), which aimed to enhance school improvement through promoting diversity, collaboration, and partnerships. Smith analyzed school-level data from 322 secondary schools participating in the program and found limited evidence that the Beacon Schools initiative led to improvements in student outcomes.
Another notable collaborative initiative was the NLC program, active in the United Kingdom from 2002 to 2006. Through this program, groups of schools volunteered to propose networked learning activities aimed at enhancing both student learning and staff professional development. Approved proposals received funding and support from a specialized team to facilitate these collaborative projects. Katz and Earl (2010), in a study of 662 schools across 60 NLC networks, found a positive correlation between engagement in the network and improvements in student achievement when analyzing changes in individual schools’ results over 3 years. However, when comparing student learning gains of 109 NLC schools with national trends between 2003 and 2005, Sammons et al. (2007) found no significant evidence that participation in the NLC led to enhanced student achievement. These contrasting results suggest that program evaluation should include a comparison group, as positive outcomes observed in individual schools through pre-post comparisons may not necessarily exceed the general improvements seen nationwide when compared against the national average during the same period.
School federation represents another form of inter-school collaboration in the United Kingdom, characterized by formal partnerships mandated by legislation between schools. The evidence surrounding the associations between federation and student learning outcomes is relatively consistent. For instance, in both their 2013 and 2014 studies, Chapman and Muijs found that participation in a federation was correlated with improved student achievement, though the effects vary across federation types, with the performance-based federation model showing the strongest positive association with student achievement compared to other federation models. When restricting the analytical sample to a group of rural schools, Muijs (2015) also found that students within 37 partnership schools outperformed their peers in matched comparison schools. Additionally, the positive relationship between school partnerships and student achievement strengthened over a 3-year period. In the context of the United States, Wu et al. (2024) analyzed data from 76 schools nested within 56 districts using social network analysis and found that the effects of school-to-school collaboration hinge upon the strength of the reciprocal relationship between schools.
In summary, within the broad spectrum of school-to-school collaboration, the diverse institutional arrangements of these initiatives lead to varying effects on student outcomes. Even when examining the same initiatives, studies using different methods or focusing on different sub-samples often reach different conclusions, highlighting the complex relationship between school-level collaboration and students’ academic achievement.
Mediating factors that impact student learning outcomes at the school level
Within the sphere of school-to-school collaboration literature, various factors contributing to successful collaboration have been identified in qualitative studies, such as effective leadership, teachers’ job satisfaction, teaching approaches, and students’ perceived school climate (Haynes & Lynch, 2013). However, quantitative studies testing whether inter-school collaboration initiatives enhance students’ academic achievements through these specific school-level variables are lacking. Consequently, this segment of the literature review goes beyond the studies on school-to-school collaboration and draws from more general literature on the associations between principal leadership, teaching approaches, teachers’ job satisfaction, and students’ academic performance.
Principal leadership and students’ learning
Principal leadership is crucial in shaping the learning environment and influencing student achievement. It includes various models, such as instructional leadership, which emphasizes curriculum and teaching practices, and transformational leadership, which focuses on vision-setting and school culture (Leithwood & Sun, 2012; Robinson et al., 2008). Recent perspectives advocate for an integrated approach, in which principals adapt their leadership style to meet their schools’ unique needs (Hitt & Tucker, 2016; Shen & Wu, 2024).
Recent meta-analyses, including those by Shen and Wu (2024) and Wu and Shen (2022), suggest that principal leadership has a moderate positive effect on student achievement, with effect sizes ranging from 0.22 to 0.34 standard deviations. These findings align with earlier studies like Hattie (2008), indicating that while principal leadership can significantly impact student outcomes, it is challenging to identify a single leadership model as most effective. Much of the impact is indirect, as principals shape learning conditions by fostering a supportive climate and guiding teacher development (Grissom et al., 2021; Hallinger & Heck, 1998).
The effectiveness of principal leadership varies by context, such as school location, socioeconomic status (SES), and student demographics, as highlighted by Wu and Shen (2022). Understanding these contextual factors is essential for tailoring leadership practices to diverse educational settings and guiding future research and policy. This focus on context helps ensure that leadership strategies are effective and responsive to the specific needs of schools and their communities (Grissom et al., 2021).
Teaching styles and students’ academic outcomes
Discussions about teaching methods and their impact on student learning outcomes often compare traditional lecture-style presentations with student-centered approaches. Traditional lectures have been criticized for assuming uniform learning paces and lacking mechanisms to gauge student comprehension (Weiss, 1997). Additionally, lectures can quickly lose students’ attention, leading to passive learning and rapid forgetting.
Despite these criticisms, empirical studies have yielded inconclusive findings on whether traditional lectures are inherently detrimental to learning. For example, Schwerdt and Wuppermann (2011) found that traditional lectures were correlated with significantly higher student achievement in the United States. In contrast, van Klaveren (2011) did not find a significant relationship between lecture time and student performance in the Netherlands.
Teachers’ satisfaction and students’ academic outcomes
Teachers’ job satisfaction reflects a sense of fulfillment and gratification from work. It has been shown to have strong implications for teacher retention, attrition, absenteeism, burnout, commitment to educational goals, and job performance (Ingersoll, 2001).The overall consensus is that teachers’ job satisfaction indirectly affects students’ academic outcomes through teachers’ self-efficacy, pedagogical practices, and quality of instruction (Viac & Fraser, 2020). However, depending on the measure of job satisfaction as it relates to different aspects of teachers’ jobs, empirical studies have shown varying relationships between teachers’ job satisfaction and students’ academic outcomes.
In the context of Chinese schools, Gu and Zhou (2020) found that teachers’ self-realization through teaching-related work and their relationships with colleagues and students displayed a significant relationship with students’ performance. By contrast, the satisfaction of school principals or administrative staff, salaries, and professional development opportunities did not have a significant association with students’ performance. A recent review by Hoque et al. (2023) identified four types of relationships between teachers’ job satisfaction and students’ test scores: (i) low satisfaction, high achievement (e.g., Shanghai, South Korea, Japan, Singapore), (ii) high satisfaction, low achievement (e.g., Mexico, Malaysia, Chile, Italy), (iii) high satisfaction, high achievement (e.g., Finland, Alberta, Australia), and (iv) low satisfaction, low achievement (e.g., Bulgaria, Brazil, Russia). These findings suggest that, depending on cultural contexts, the relationship between teacher's job satisfaction and students’ academic performance can vary significantly.
Peer relationships and students’ academic achievement
Student peer relationships have been found to be significantly associated with their academic performance. Positive peer relationships, characterized by acceptance, support, and lack of victimization, enhance academic outcomes, particularly during early adolescence. A meta-analysis by Wentzel et al. (2004) emphasized that being well-liked in school peer groups positively impacts academic outcomes for early adolescents. Conversely, negative peer relationships, such as bullying and victimization, correlate with lower academic performance, as demonstrated by Espelage et al. (2013). These studies also note that self-reported positive peer relationships indicate a positive school climate.
Additionally, peers influence academic engagement. Gremmen et al. (2018) conducted a longitudinal social network analysis, finding that students’ academic engagement and achievement improved when their friends performed better, regardless of classroom seating. In summary, positive peer relationships create supportive environments that foster learning engagement and academic achievement (Țepordei et al., 2023), while negative peer relationships detrimentally affect academic performance (Espelage et al., 2013).
Policy context of the SSP in Shanghai
In Shanghai, admission to public primary and secondary schools is primarily determined by a student's residential address and school district. Historically, stronger schools have been concentrated in central districts with higher housing prices, leading to a significant gap in school quality between different areas, particularly between the city's central and outlying districts. This geographic disparity has contributed to variations in academic performance among schools. According to the 2018 student assessment data used in this study, which includes all middle schools in Shanghai, these differences account for 30% of the variation in overall student academic achievement. While this figure is comparable to the average among Organisation for Economic Co-operation and Development (OECD) countries—29%, based on the 2018 PISA reading scores (OECD, 2019)—Shanghai sought further improvement. This effort was partly driven by the Chinese government’s emphasis on providing high-quality and equitable compulsory education. In response, the city launched a series of initiatives to enhance the performance of underachieving schools and reduce the achievement gap, including the SSP in 2018.
The SSP aimed to improve the quality of approximately 100 low-performing schools by partnering them with high-performing schools (Shanghai Education Committee, 2018). In Shanghai, school quality is often judged based on standard test scores, with one of the most significant exams being the high school entrance exam (Zhongkao), which determines whether a student can attend a prestigious high school. Admission to a top high school, in turn, significantly increases a student's likelihood of entering a top-ranking university. For middle schools, the proportion of students admitted to prestigious high schools is a key indicator of the school's perceived quality, alongside other standard tests. Additionally, district administrators in Shanghai maintain close relationships with schools through regular meetings, school visits, and the organization of district-wide teaching and research groups. This ongoing interaction enables each district to have a thorough understanding of its schools, not only in terms of their performances in standard tests but also regarding teachers’ instructional quality, management efficiency, and other factors.
The criteria for participating in SSP were not stringent. Schools volunteered to participate in the SSP, and each administrative district screened and chose schools based on their performance on aforementioned standardized tests, along with the districts’ extensive familiarity with those schools.
The municipality granted each district autonomy in determining detailed implementation strategies. Based on our thorough review of online news articles, there are two distinct features of this system-wide improvement project. First, it involved a high-performing school principal assuming a part-time management role at a low-performing school. In addition, two advanced teachers were assigned to this low-performing school to assist in professional learning and teaching enhancement. Support teachers not only visited low-performing schools regularly but also engaged in joint activities, including research, teaching collaboration, and in-school teacher training, with teachers from low-performing schools (Liu, 2021). The supporting school typically possesses the capability to assist a low-performing school without compromising its own performance. Specifically, it excels in various domains such as teacher development, effective pedagogy enhancing student learning, and senior management and advanced teacher skills. In addition, partnered schools would share courses, teaching materials, and facilities.
Second, in addition to partnering with low- and high-performing schools, the project also mobilizes resources from the city's universities and other educational institutions. The city's education commission and the district-level education bureau frequently organize seminars, and teaching and research groups to help improve teaching practices as well as the management capabilities of SSP schools.
In addition, it is worth noting that although not all schools participated, some school districts coupled SSP with other interventions, such as the School Federation Project and the District-Run School Program. Both of these initiatives aim to share knowledge and best practices across schools by mobilizing resources, either within a school alliance group or within a district boundary. Despite these similarities, there are a couple of major differences between SSP and these other projects.
To begin with, SSP is a 3-year project initiated by the local government, characterized by strong political commitment and direct funding to low-performing schools. In contrast, the School Federation Project and the District-Run School Program adopt a collaborative model among partner schools without direct government funding and without a set timeline. In addition, under the School Federation Project or the District-Run School Program framework, a well-established, high-performing school typically collaborates with several other schools. Using a “single legal entity” model or a “multiple entities, joint governance” approach, these initiatives have clear governance guidelines, usually established by the core school. In contrast, SSP focuses on a one-to-one collaboration between a strong school and a less-resourced school, without specific governance structures imposed on them.
Despite these distinct differences across projects, when an SSP school participates in these other initiatives, the ability to identify the specific effects of SSP could be confounded. Therefore, we conducted analyses on all SSP schools and performed robustness tests by excluding schools involved in multiple interventions to isolate the effects of the SSP intervention.
While previous studies have explored school improvement through collaborations in Shanghai (Tao, 2022; Teddlie & Reynolds, 2000), they have mostly used qualitative methods. A gap exists in quantitative research on the relationship between inter-school collaboration and student performance. This paper aims to examine this association and identify mediating factors contributing to improved student learning. Specifically, we explore the following research questions: (1) Did school-to-school collaboration through the SSP in Shanghai improve students’ academic achievements in low-performing schools? and (2) What are the mechanisms through which the SSP influences students’ learning outcomes? Below, we provide details of the methodological approach used to address these questions.
Data and methods
Data and sample
Our main data source is the 2018 and 2021 waves of the comprehensive evaluation of the academic quality of middle schools in Shanghai, also known as the Green Index project. This study was conducted in accordance with the Academic Integrity Code of Shanghai Jiao Tong University. The comprehensive evaluation is administered by the Shanghai Municipal Education Commission and designed and implemented by the commission's Teaching and Research Office and Basic Education Quality Monitoring Center. We obtained the data through this Center. However, due to the student data confidentiality agreement we signed, we only received and analyzed school-level data instead of individual student data.
The Green Index project covers all middle schools in Shanghai in both waves, with all students in Grade 9 participating in academic assessments of Chinese, English, mathematics, and science. Additionally, all teachers of students in Grade 9 were surveyed. Apart from direct assessment, accompanying surveys focused on students’ well-being, moral and social behavior, learning motivation, teachers’ teaching style, and principals’ instructional leadership. In total, 645 middle schools and 62,591 students participated in the survey in 2018, and 683 schools and 67,635 ninth-grade students participated in the 2021 survey.
To construct the analytical sample, we made the following decisions: (1) Given the primary research goal of investigating the association between participation in the SSP and student learning outcomes among low-performing schools, data from both rounds of assessments and surveys—one before the project started and one after—are necessary, therefore, we excluded 24 schools that were closed, dismantled, or merged, as well as 62 newly opened schools in 2021. (2) To ensure consistency across subject areas, we excluded eight schools that only participated in one subject area test. (3) Although 122 schools were proposed to participate in the SSP in 2018, the annual special funds to support the project were not in place until late 2019. The 2019 funds were only given to 35 schools that had seriously implemented their strategic plans set out in 2018. These 35 schools were assigned to the treatment group, while the 491 schools that never participated in SSP were included as potential candidates for the control group.
While the main analyses used the 2018 and 2021 waves of the Green Index data, the 2015 data was also available. However, due to significant revisions in the survey questionnaire after 2015, most of the variables used in our analyses were not comparable across all three waves. As a result, we used the 2015 data only to plot trends in test scores for all four subjects (Chinese, English, mathematics, and science) between SSP and non-SSP schools. These trends are presented in Appendix A and discussed in the Findings section.
Analytical methods
To investigate the associations between participation in the SSP and student academic achievement, as well as to identify the mediating factors contributing to student learning outcomes at underperforming schools, we employed three methods for the analysis: (1) DID, (2) PSM-DID, and (3) causal mediation analysis. These methods have been extensively used in prior education literature examining the effects of educational policy changes or interventions (e.g., Henry et al., 2020; Liu, 2022).
DID
We used the DID approach as our baseline model to examine the effects of participating in the SSP on student learning outcomes, with more precise matching between the intervention group and the control group identified in the subsequent PSM-DID analyses. Equation (1) specifies the baseline DID model:

PSM-DID
The DID method relies on the assumption that trends in academic outcomes for SSP and comparison schools would have been parallel in the absence of the SSP intervention. This requires assessing the parallel trends assumption by examining trends before the treatment. However, due to data limitations, we could only examine trends using the 2015, 2018, and 2021 data, making it difficult to establish consistent trends over a longer pre-treatment period. To address this limitation, we employed PSM to create a comparison group of schools that closely resembled SSP schools based on observable characteristics. We then used this matched sample in a DID analysis to ensure a more reliable comparison and strengthen the validity of our findings.
To achieve this, we first estimated a logit model to predict the likelihood of a school participating in the SSP, using a set of observable characteristics measured in 2018, as shown in Equation (2).

The same control variables described earlier, including
In the second step, using the estimated propensity score, we restricted the subsequent DID estimation to schools that are matched in the first step within the common support. Each treated school was then matched with one or more schools in the control group that closely aligned with it in terms of propensity score.

Specifically, we employed kernel matching algebra and calculated the weighted average of all comparable schools in the control group to establish the counterfactual outcome for each treated school. The assignment of weights depends on the choice of kernel function and bandwidth parameters. In our analysis, we employed the Gaussian kernel with a bandwidth of 0.06, and Equation (3) corresponds to the resulting regression equation.
Causal mediation analysis
Lastly, we utilized causal mediation analysis within the DID framework to assess the mediating role of a series of school-level variables in explaining how the treatment—the SSP—affects student academic outcomes. This approach builds on the classical mediation framework proposed by Baron and Kenny (1986) and is further refined by Imai et al. (2010, 2011). Similar approaches, such as those in Henry et al. (2020), have applied mediation analysis within a DID framework to explore mechanisms behind the observed effects of school interventions. Our mediation framework used a series of three regression equations to test each mediator separately, capturing both time dynamics and mediation effects.
First, we estimated Model (4) below to establish the effect of SSP participation on student academic achievement:

Second, we estimated the effect of SSP on each of the four mediators using a similar DID model, replacing the outcome with the mediator:

Third, we adjusted for the mediator's relationship with student test score gains:

We then followed Henry et al. (2020) to test the statistical significance of the mediating effects. We first calculated the partially standardized indirect effect of SSP through each mediator, obtained by multiplying the estimated
Variables and mediators
As outlined previously,
The teacher encourages us to try out different learning methods. The teacher gives real-life examples to help us understand. The teacher asks us to work in groups in class. After the teacher asks a question, he/she gives us enough time to think. The teacher provides individualized evaluations. The teacher encourages everyone to answer questions. The teacher encourages us to share our own views and ideas. The teacher encourages us to solve problems using different approaches. The teacher listens patiently when students are answering questions. The teacher adjusts the difficulty level of questions for different students.
The internal reliability of the teacher's teaching style variable is assessed using Cronbach's alpha, which is 0.97 in this case, indicating a very high level of consistency among the items.
The school has established a curriculum development team responsible for organizing curriculum-related work. The principal effectively leads all teachers in achieving curriculum goals. The school's curriculum and vision are unique. The school's curriculum plan aligns with the school's philosophy and goals for its students. The principal pays great attention to localized and school-based curriculum. The principal is skilled at leveraging various resources within and outside the school to achieve the school's educational goals.
The internal reliability of this variable, as measured by Cronbach's alpha, is 0.96, indicating a high level of consistency among the six items. This suggests that the items reliably measure the underlying construct of principal's instructional leadership.
The appraisal system based on students’ performance puts a lot of pressure on me. I enjoy working in this school. I am not paid well given my workload and contribution to the school. If possible, I would like to work at another school.
Item 3, which is reverse-worded, was reverse-coded to ensure consistency in the interpretation of higher scores as higher levels of job satisfaction. The internal reliability of this scale, as measured by Cronbach's alpha, is 0.71, indicating an acceptable level of consistency among the items.
I get along well with my classmates. I feel happy when I’m with my classmates. My classmates often tease and bully me. My classmates exclude me from their activities. We’re willing to help classmates who are having a hard time.
Items 3 and 4, which are reverse-worded, were reverse-coded to ensure that higher scores consistently reflect more positive peer relationships. The internal reliability of this scale, measured using Cronbach's alpha, is 0.77, indicating an acceptable level of consistency among the items.
Importantly, in the main analyses, the four mediators—teachers’ teaching style, principal’s instructional leadership, teachers’ job satisfaction, and students’ peer relationships—were converted into continuous variables ranging from 0 to 100, and their arithmetic averages were used. Supplementary tables in the appendices present an alternative approach, where the mediators were derived through factor analysis, and factor scores were subsequently utilized in DID, PSM-DID, and causal mediation analysis. The results from these two approaches for constructing the mediators were then compared.
Findings
Descriptive statistics
Table 1 presents descriptive statistics of our DID analytical sample, covering students’ academic outcomes and other school-level characteristics for both the SSP schools and the control group schools (i.e., schools that did not participate in the SSP). Compared to the control group, the SSP schools exhibited lower scores across all four subjects. However, these gaps narrowed between 2018 and 2021, with the most significant reduction observed in the mathematics subject.
Descriptive statistics and t-test results by treatment status.
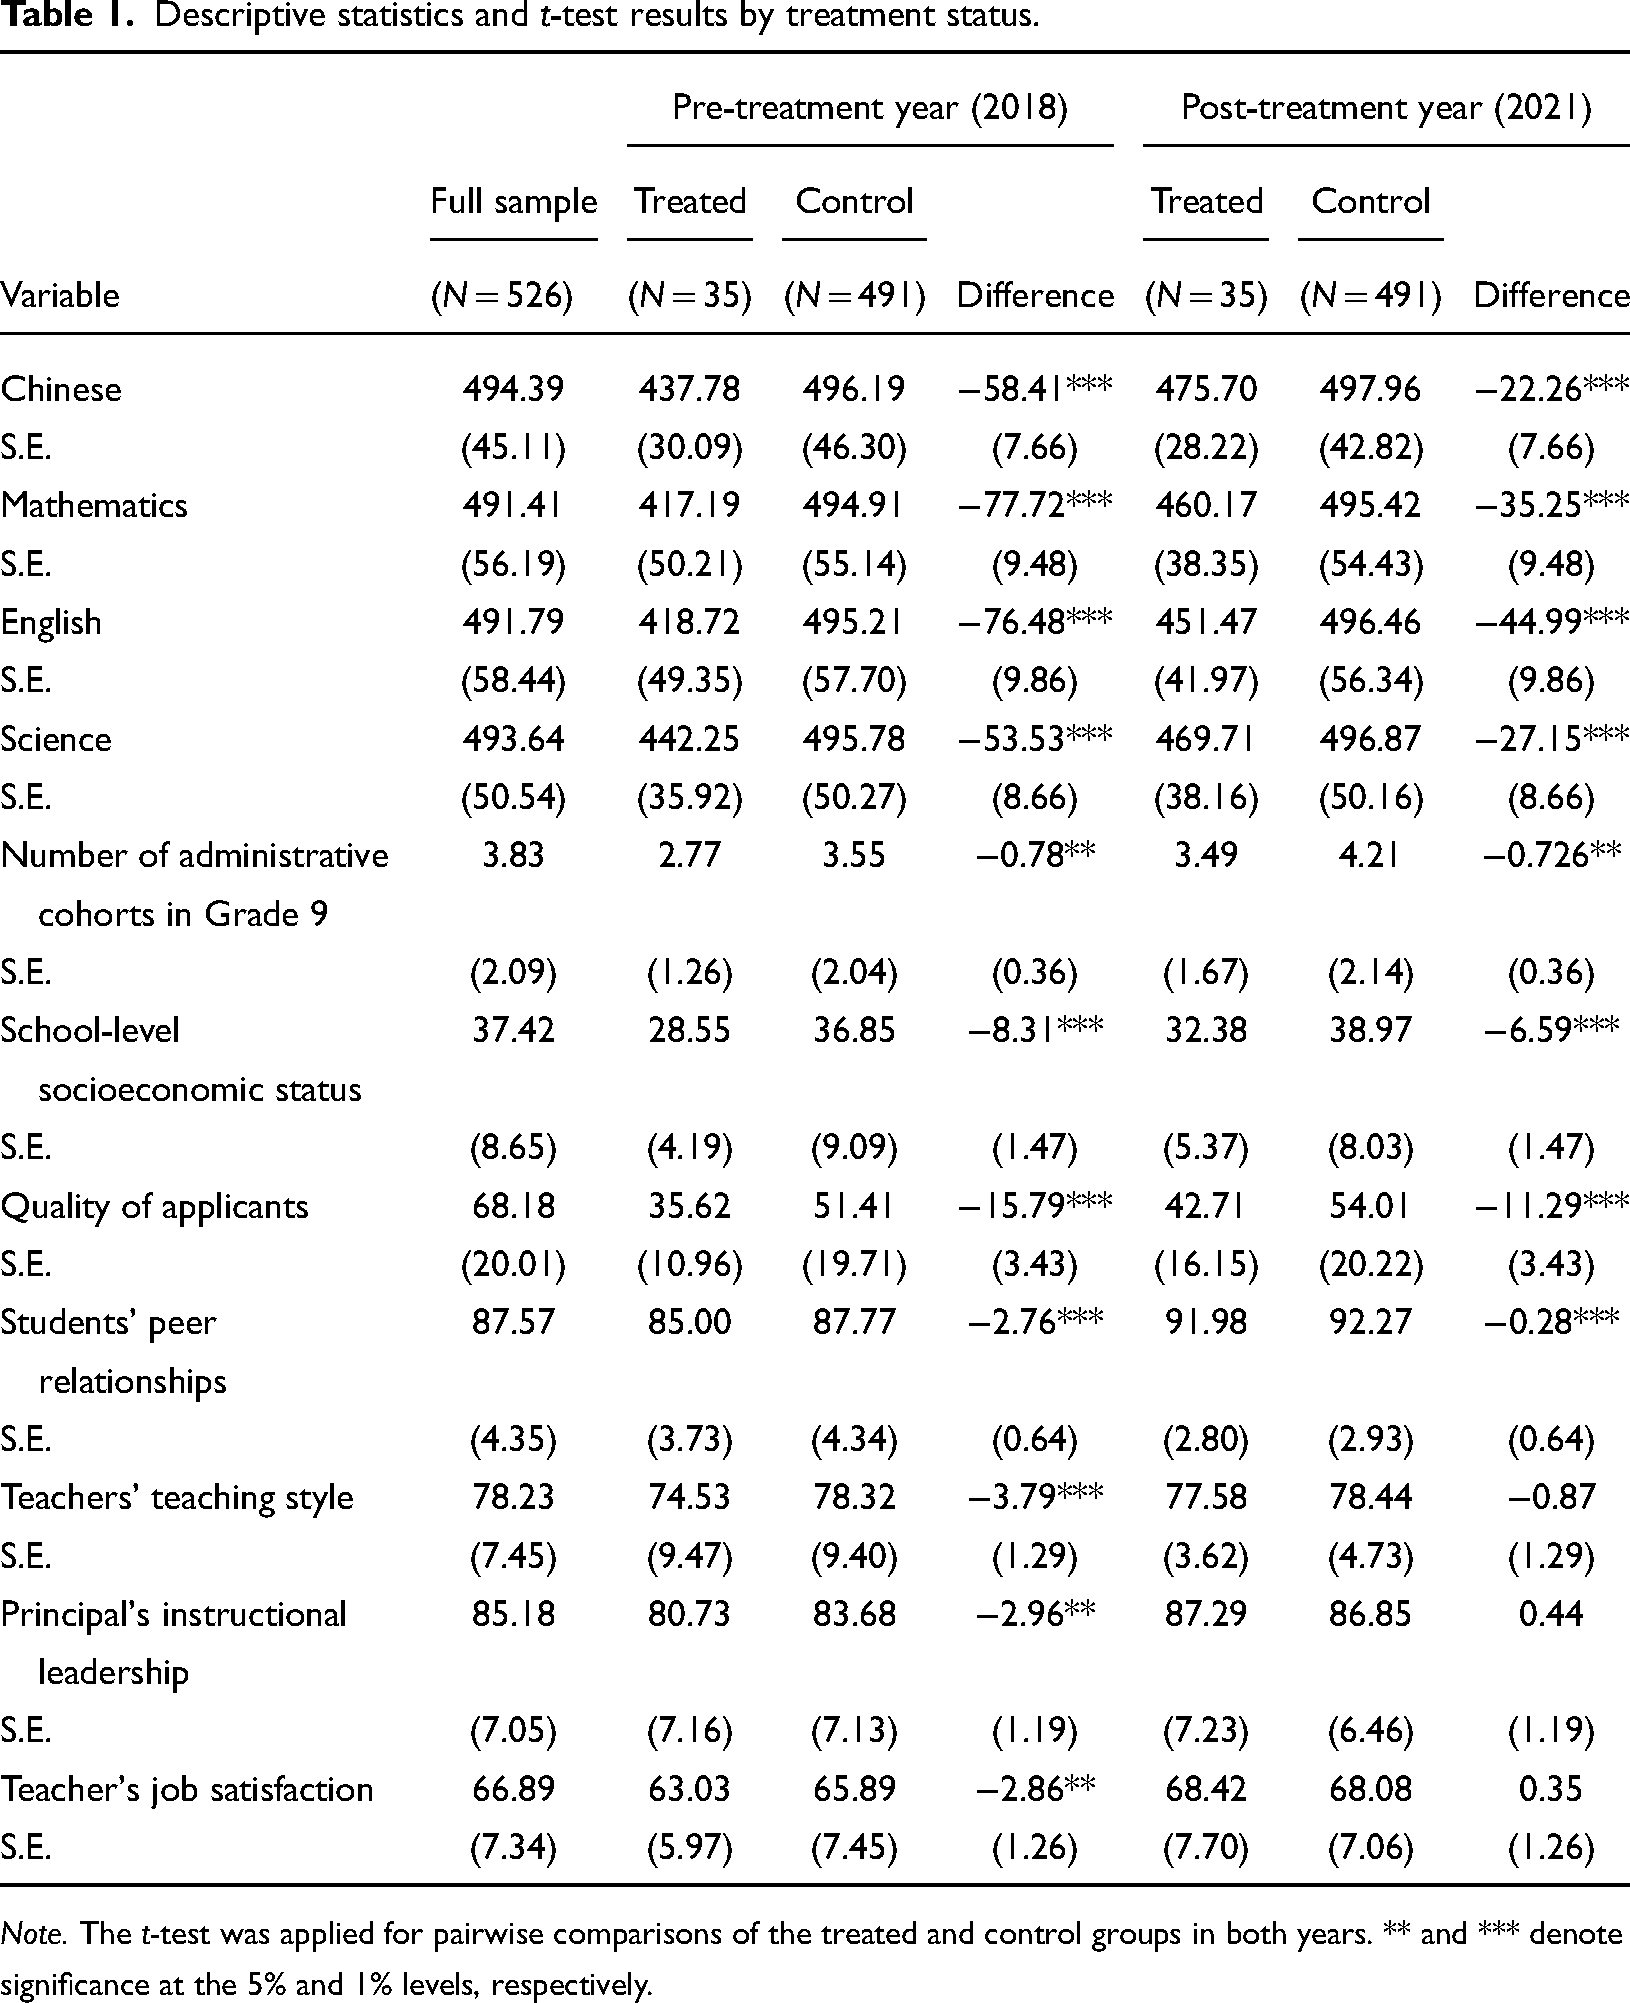
Note. The t-test was applied for pairwise comparisons of the treated and control groups in both years. ** and *** denote significance at the 5% and 1% levels, respectively.
Appendix A presents trends in test scores for all four subjects across three waves, indicating a marked improvement in scores for SSP schools, especially after 2018, suggesting a positive shift. In contrast, non-SSP schools maintained relatively stable performance with smaller gains over the same period.
Table 1 also shows that SSP schools had notably lower levels of SES in both years compared to non-SSP schools. Examination of baseline characteristics reveals that SSP schools had fewer administrative cohorts, lower SES, less emphasis on student-centered teaching, and lower levels of principals’ instructional leadership than control group schools. Importantly, there were notable differences in teaching style between SSP and control group teachers in 2018; control group teachers employed student-centered teaching strategies more frequently and intensively. By 2021, these disparities had become statistically insignificant. Additionally, students’ peer relationships and principals’ instructional leadership showed improvement over time, with the disparities between the treatment and control groups diminishing by 2021.
Matching and balancing tests
Figure 1 illustrates the kernel density of propensity scores for both the treated and control groups before and after matching. It reveals a reasonable region of overlap between these two groups prior to matching, with improved alignment of the propensity score distribution between the two groups after matching. After matching, all 35 schools in the SSP group were successfully matched, and 295 schools in the non-SSP group were matched, resulting in 660 total observations for the second step of the PSM-DID analysis.
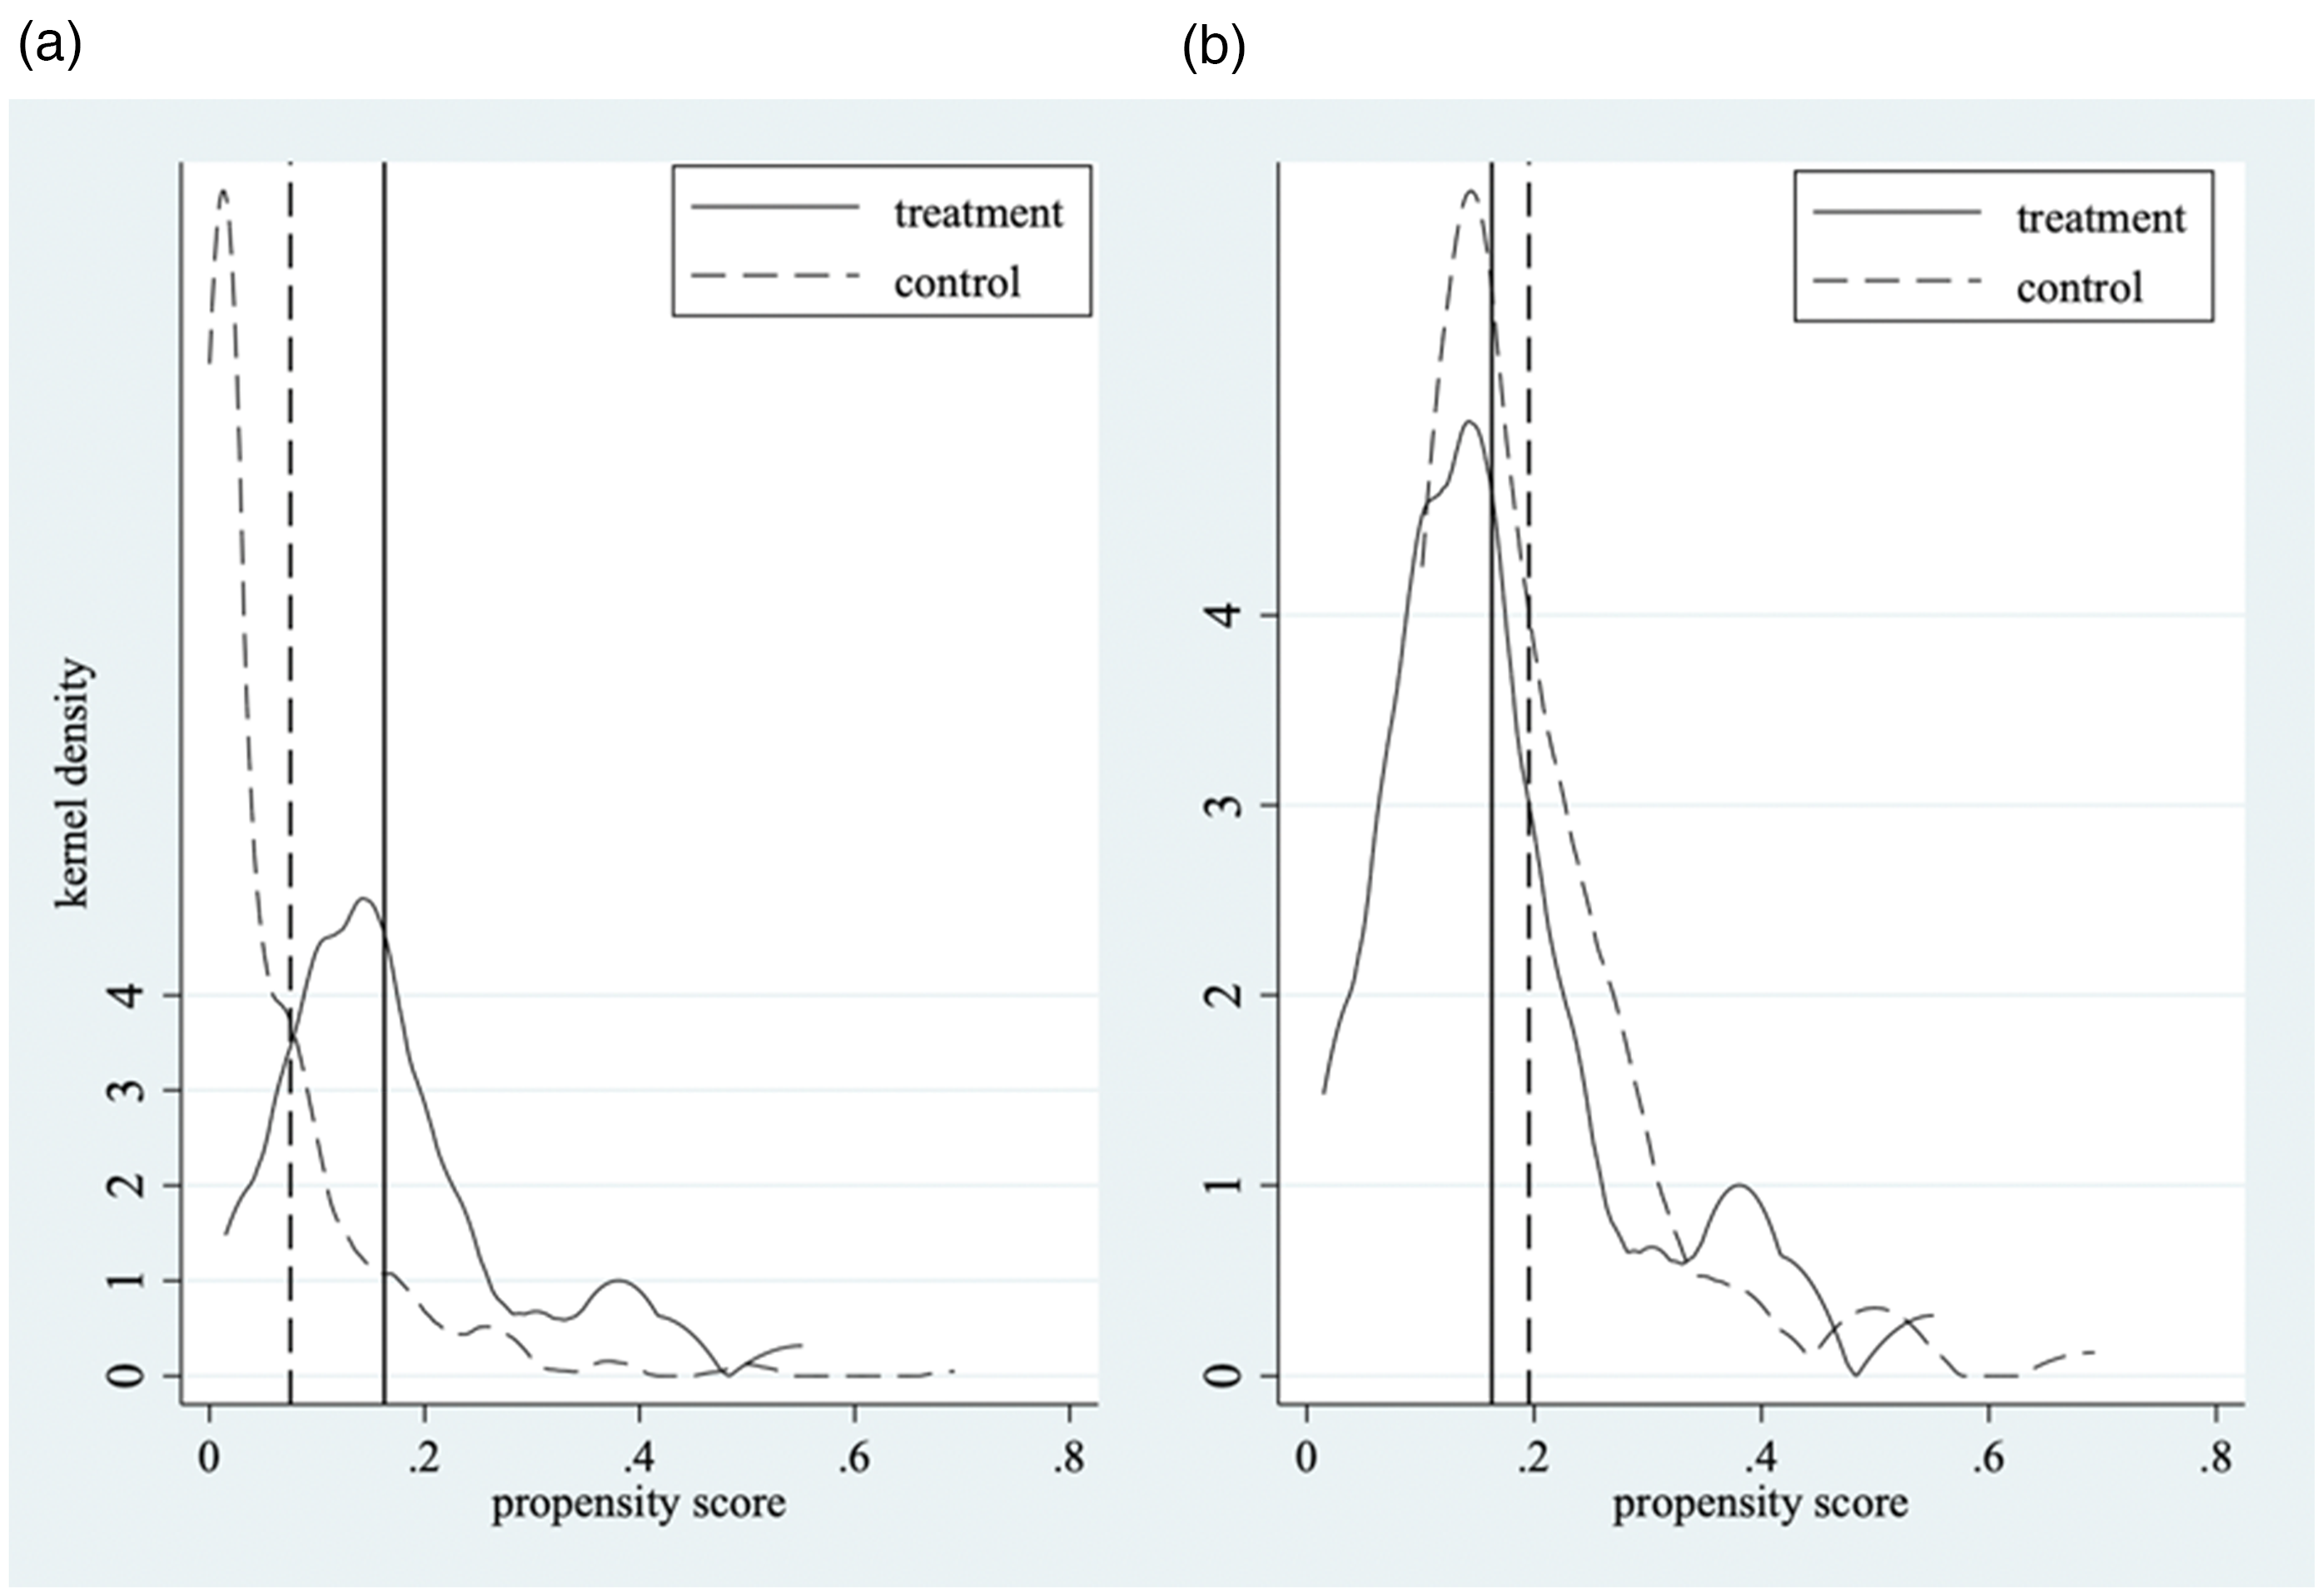
Kernel density of propensity scores for the SSP and control group schools before and after matching. (a) Before matching. (b) After matching.
Table 2 presents the results of the balance test using Gaussian kernel matching. It shows the balance property for each observed covariate between the treated and control groups, along with the reduction in bias obtained through the matching process. Columns (1) and (2) display the means of each characteristic for the treated and control groups. Columns (3) and (4) indicate the significance of the mean differences assessed by the two-sample t-test before and after matching. Column (5) provides the standardized difference in means, often referred to as bias, before and after matching. The findings suggest that through matching, nearly all observable characteristics are well-balanced between the treated and control groups. The initial differences between the two groups are substantially reduced and become statistically insignificant at the 5% significance level.
Balance tests from kernel matching.
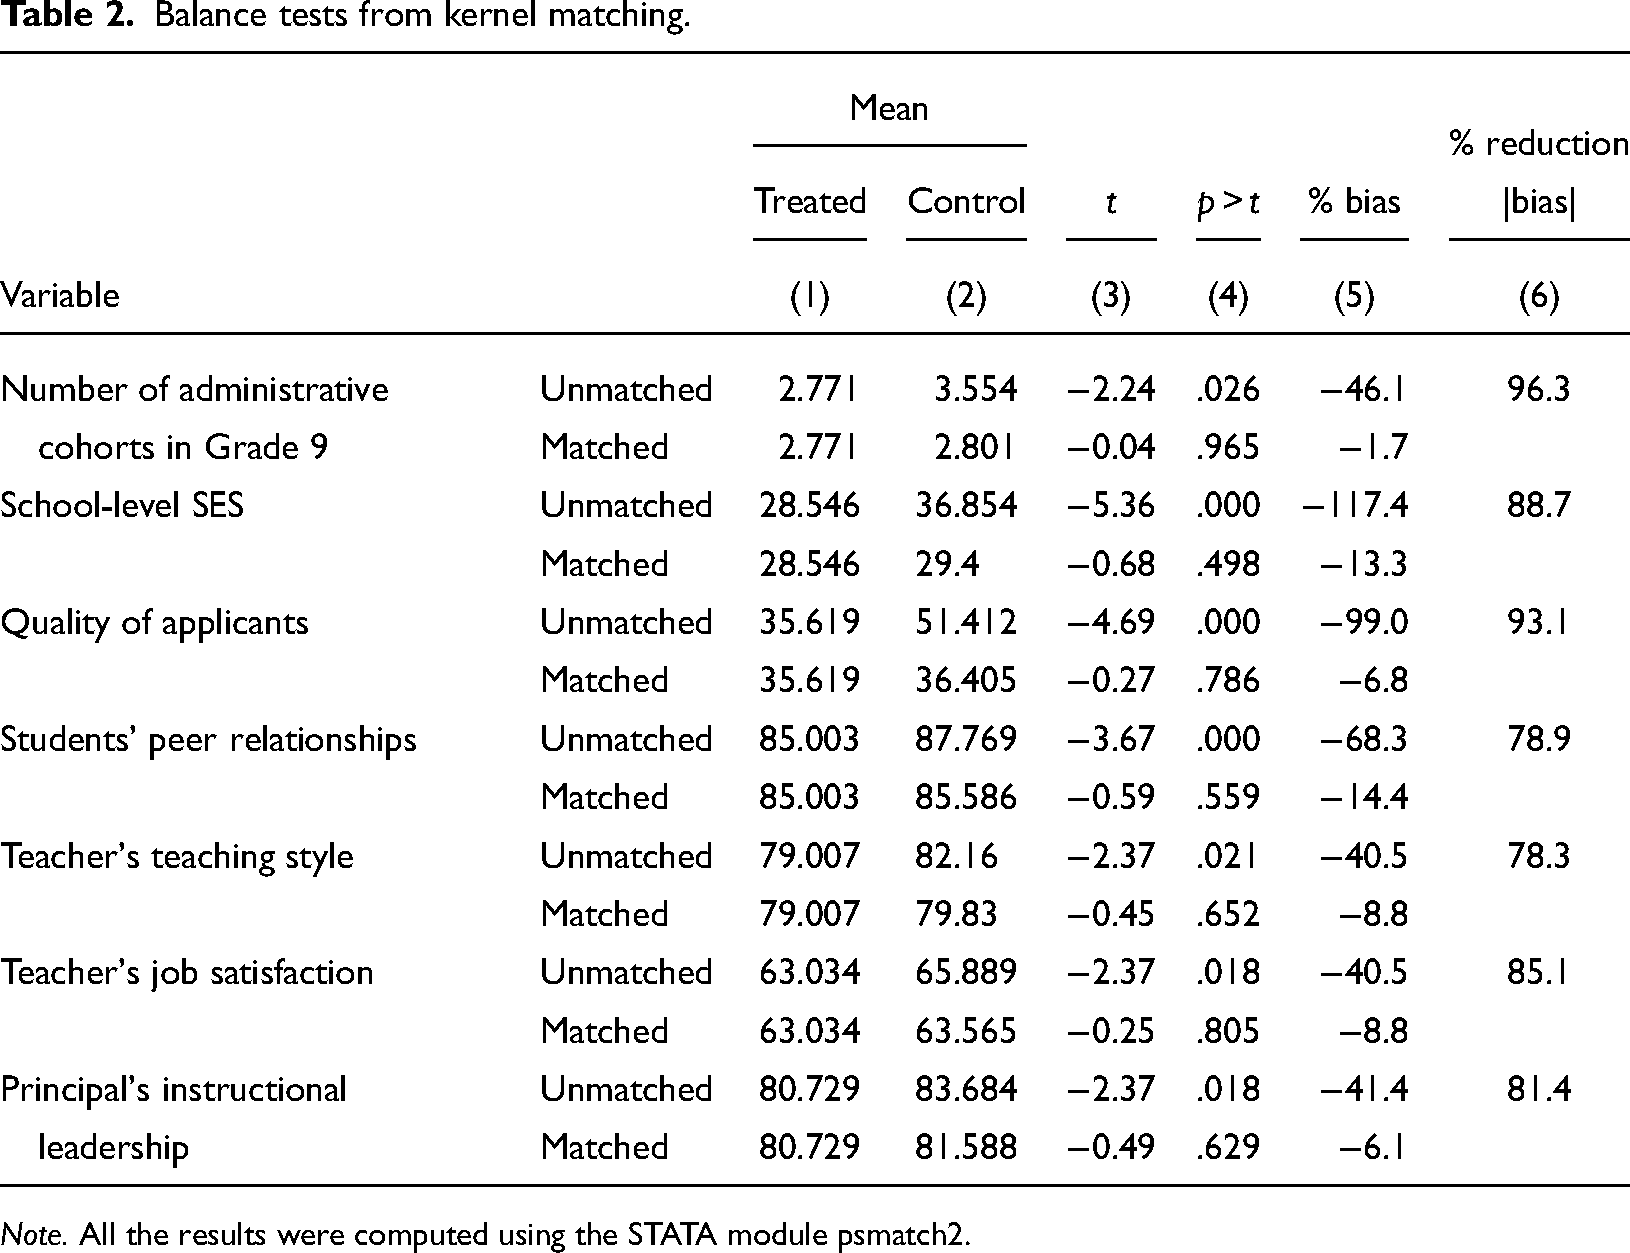
Note. All the results were computed using the STATA module psmatch2.
Participation in the SSP and student learning outcomes at low-performing schools
Table 3 presents the results of both the DID and PSM-DID analyses examining the relationship between participation in the SSP and student scores in Chinese, mathematics, English, and science. The outcomes of the DID analysis are reported in Columns (1), (3), (5), and (7), while the PSM-DID analysis results are shown in Columns (2), (4), (6), and (8). Notably, the PSM-DID analysis matched SSP schools with non-SSP schools based on common support, resulting in a reduction in the number of observations from 1,052 to 660.
DID and PSM-DID estimates of the relationship between participation in the SSP and students’ academic outcomes.
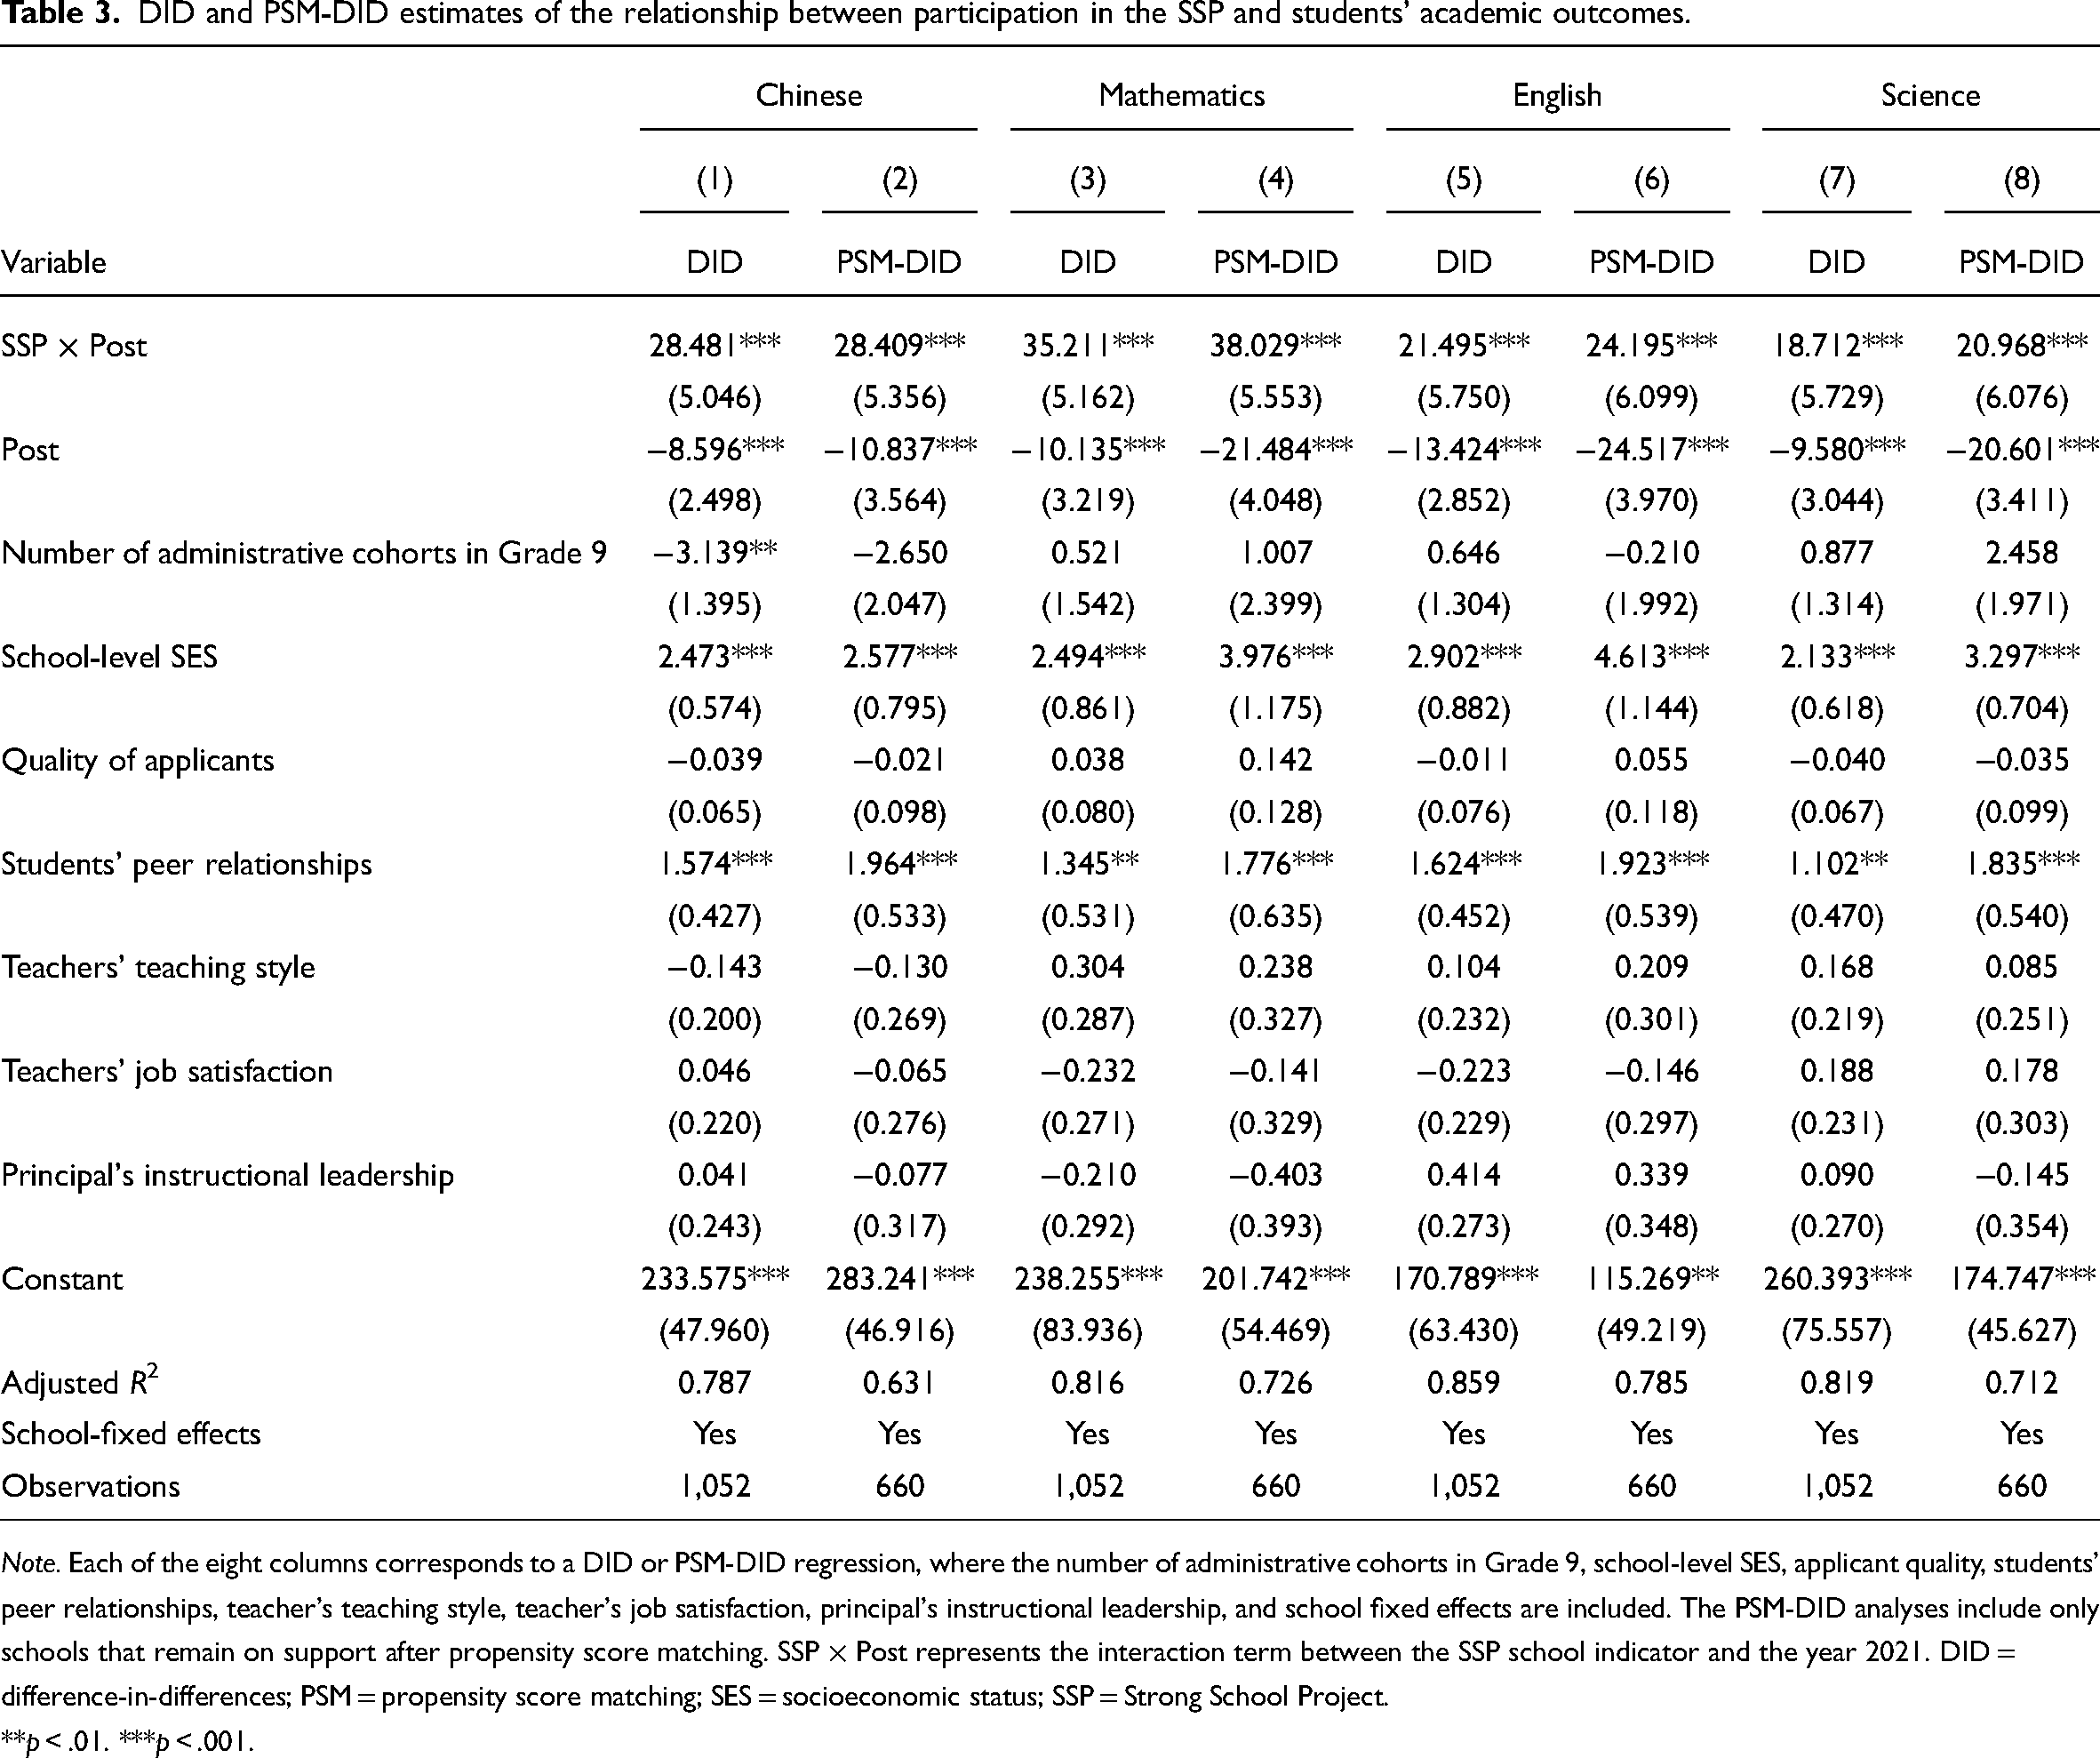
Note. Each of the eight columns corresponds to a DID or PSM-DID regression, where the number of administrative cohorts in Grade 9, school-level SES, applicant quality, students’ peer relationships, teacher's teaching style, teacher's job satisfaction, principal's instructional leadership, and school fixed effects are included. The PSM-DID analyses include only schools that remain on support after propensity score matching. SSP × Post represents the interaction term between the SSP school indicator and the year 2021. DID = difference-in-differences; PSM = propensity score matching; SES = socioeconomic status; SSP = Strong School Project.
**p < .01. ***p < .001.
The upper panel of Table 3 shows that participation in the SSP is associated with increased academic scores across all four subjects. The DID estimates indicate improvements of 28.4, 35.2, 21.5, and 18.7 points for Chinese, mathematics, English, and science, respectively. The PSM-DID estimates indicate even greater gains for mathematics, English, and science, with increases of 38.0, 24.2, and 20.9 points, respectively. When translated into standard deviations, these score improvements correspond to gains of 0.63, 0.67, 0.42, and 0.42 standard deviations in the respective subjects.
The middle panel of Table 3 reveals that school-level characteristics, such as the number of administrative cohorts and school-level SES, are significantly associated with student academic performance. However, principal perceptions of applicant quality and being located in the central district do not significantly affect student performance after accounting for other school-level characteristics.
The lower panel of Table 3 indicates that, after controlling for school fixed effects and including all four mediators in the model, only students’ peer relationships are significantly associated with their test scores.
Appendix B presents the results of the DID and PSM-DID analyses using alternative measures—factor analysis scores, for four key variables: students’ peer relationships, teachers’ teaching style, teachers’ job satisfaction, and principals’ instructional leadership. These alternative measures provide a robustness check for the impact of SSP on student academic outcomes in the four tested subjects. The results largely confirm the findings in Table 3, demonstrating consistent positive effects of SSP participation on student test scores, with significant improvements across the four subjects. The DID and PSM-DID estimates in Appendix B are similar in magnitude and significance to those in Table 3, suggesting the robustness in the effects of SSP on student academic performance.
Mediators of school collaboration and students’ academic achievement
To identify the potential factors through which participation in the SSP improves students’ academic performance, we assessed the potential mediators including principals’ instructional leadership, student-centered teaching style, teachers’ job satisfaction, and students’ peer relationships through DID mediation analyses as outlined in Equations (4), (5), and (6).
Columns (2), (5), (8), and (11) in Table 4 represent the effects of SSP on each of the four mediators: students’ peer relationships, principals’ instructional leadership, teachers’ teaching style, and teachers’ job satisfaction, respectively. The results show that participation in the SSP significantly increased peer relationships, principals’ instructional leadership, and teachers’ job satisfaction for some subjects. Notably, the SSP had a significant positive impact on peer relationships and principals’ instructional leadership. The effects on teachers’ teaching style and job satisfaction were less consistent.
Difference-in-differences mediation models: participation in the SSP, students’ academic achievement and mediators.
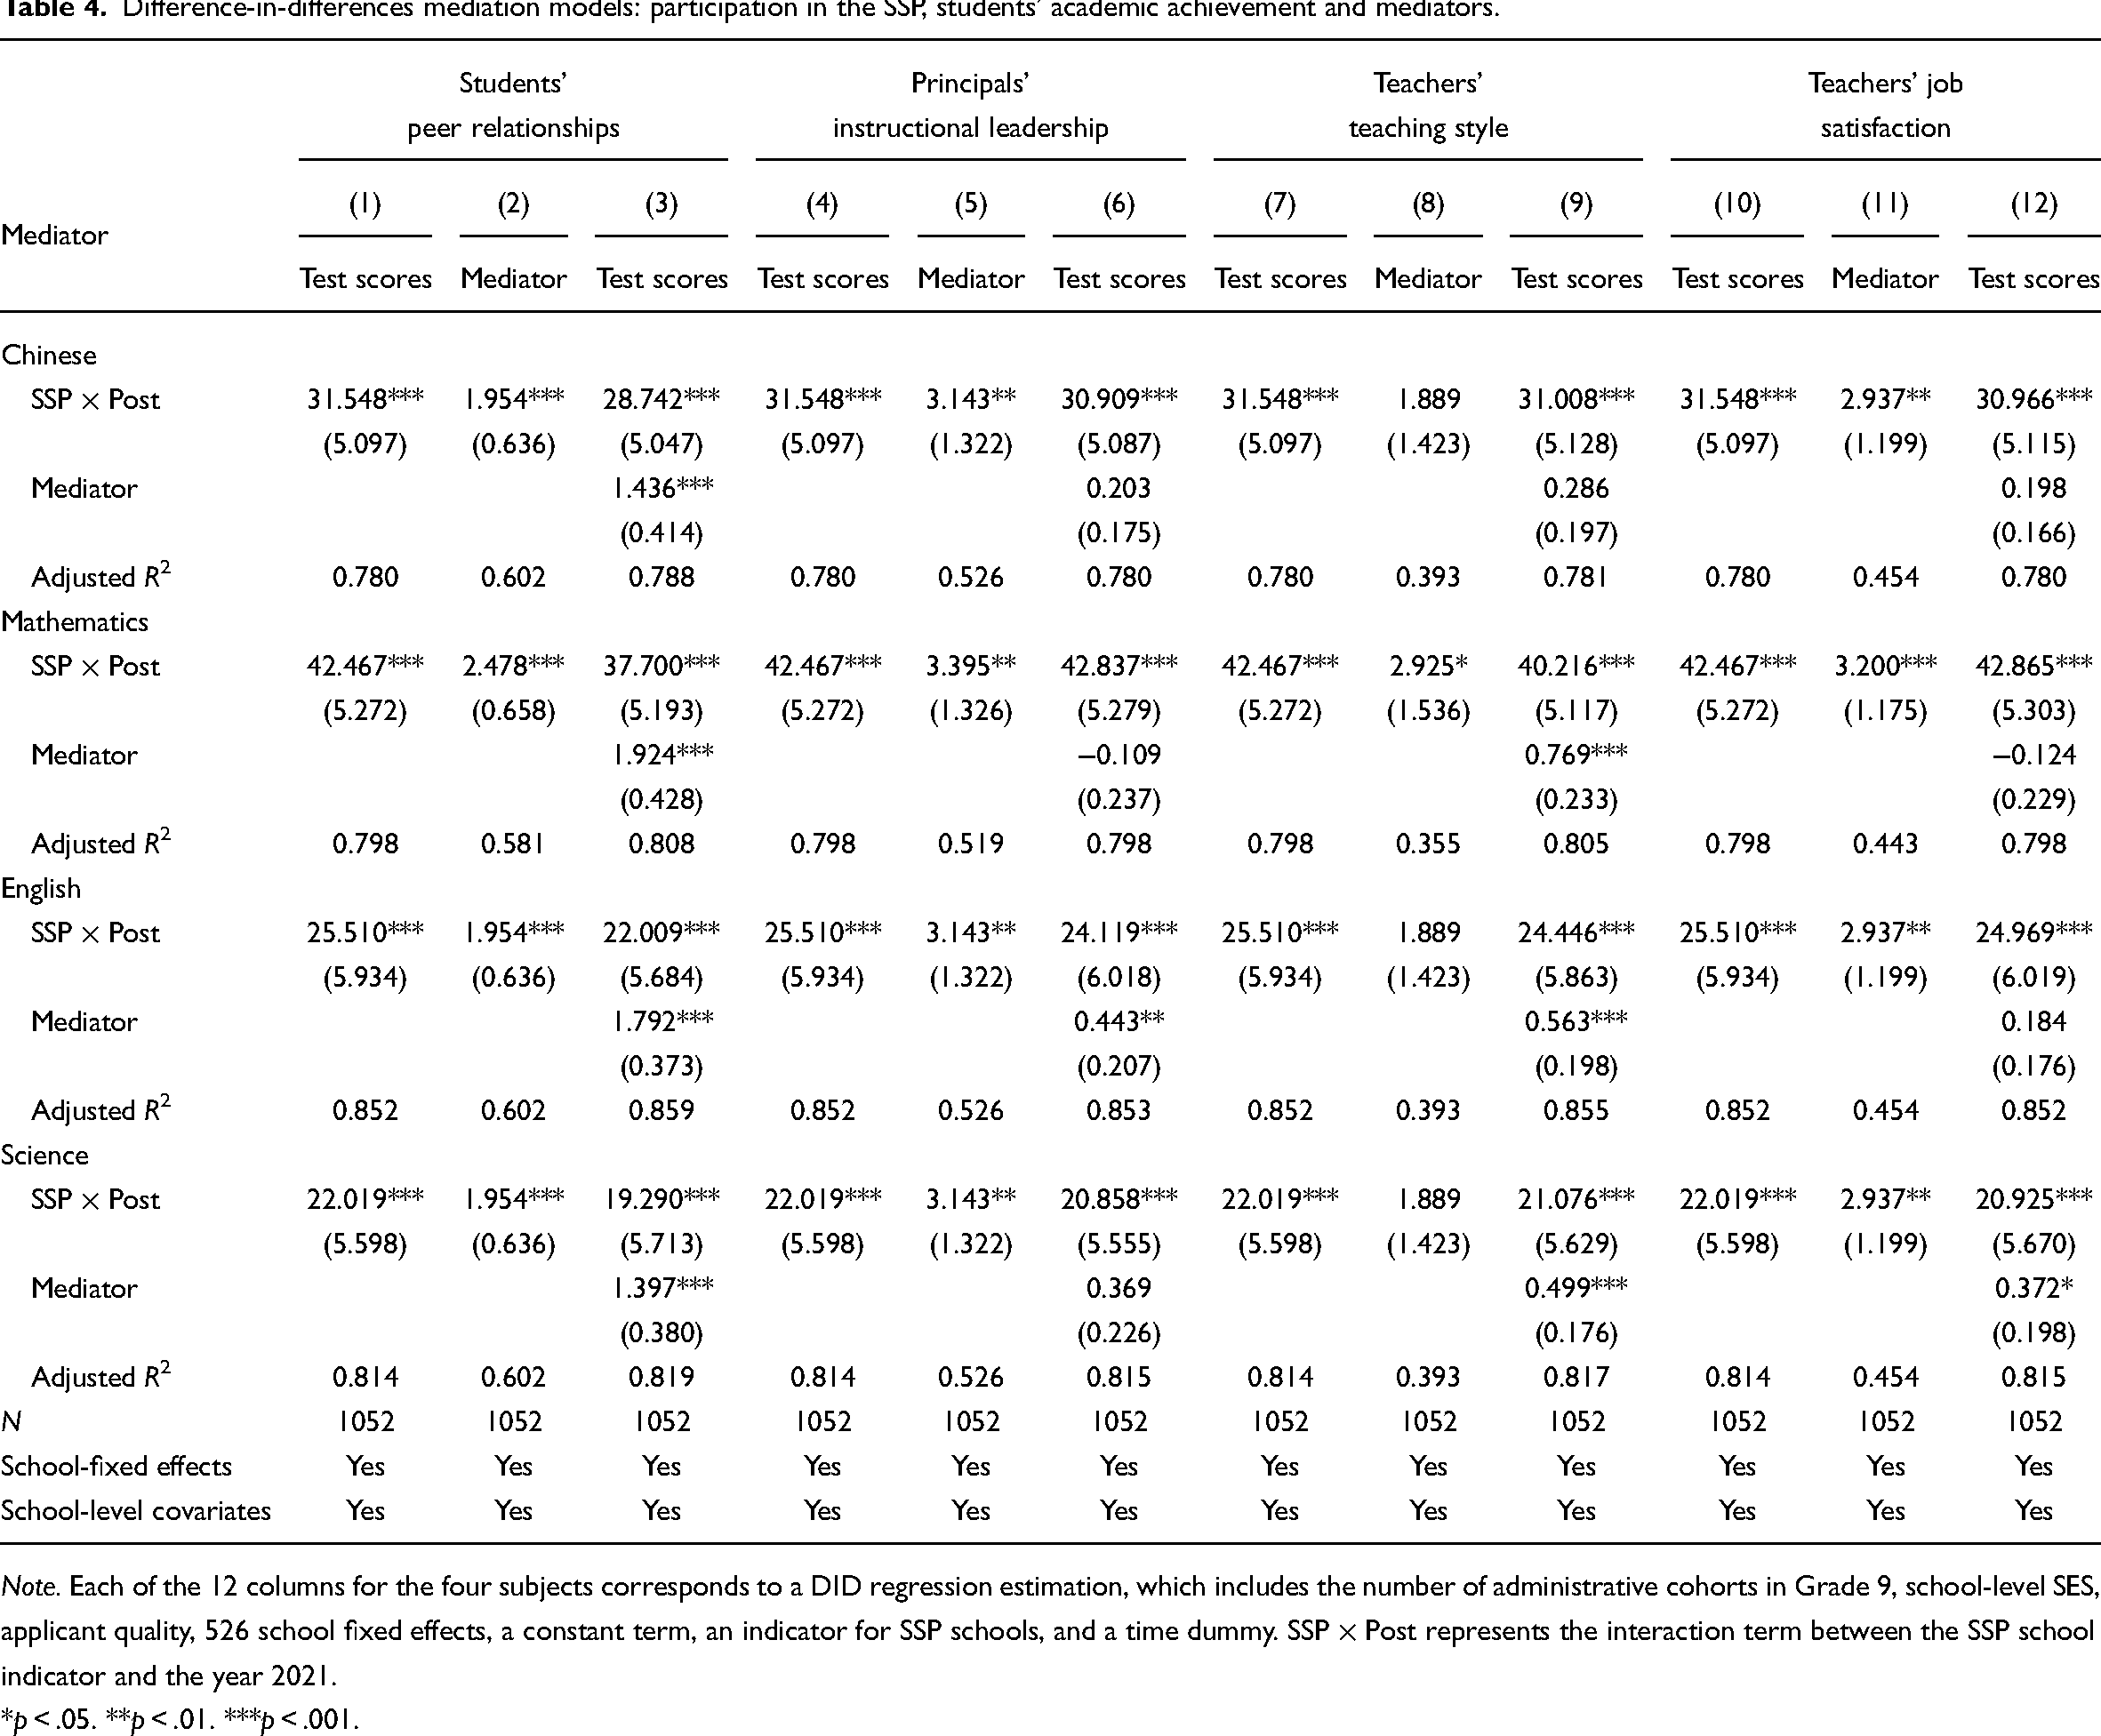
Note. Each of the 12 columns for the four subjects corresponds to a DID regression estimation, which includes the number of administrative cohorts in Grade 9, school-level SES, applicant quality, 526 school fixed effects, a constant term, an indicator for SSP schools, and a time dummy. SSP × Post represents the interaction term between the SSP school indicator and the year 2021.
*p < .05. **p < .01. ***p < .001.
The indirect effects of SSP on student test scores were calculated by multiplying the effect of SSP on each mediator (Columns 2, 5, 8, 11) with the coefficient of each mediator in Columns (3), (6), (9), and (12). The indirect effect through students’ peer relationships appeared to be the largest, about 0.085 standard deviations in mathematics. The indirect effect through principals’ instructional leadership also showed positive contributions, with about 0.024 standard deviations in English, although the effect was less pronounced compared to peer relationships. The indirect effects through teachers’ teaching style and job satisfaction were generally smaller or inconsistent.
Table 5 presents the indirect effects with bootstrapping (2,000 iterations) and bias-corrected bootstrap 95% CIs. The results confirm the relationships described in Table 4, while also quantifying the indirect mediating effects and directly testing their significance. Specifically, improvements in students’ peer relationships and, to a lesser extent, principals’ instructional leadership contribute to the positive effects of the SSP on student learning outcomes. Teachers’ teaching style and job satisfaction did not consistently show significant mediation effects across subjects, with only a few instances of significance.
Mediation effect estimates and bias-corrected bootstrap 95% CIs.
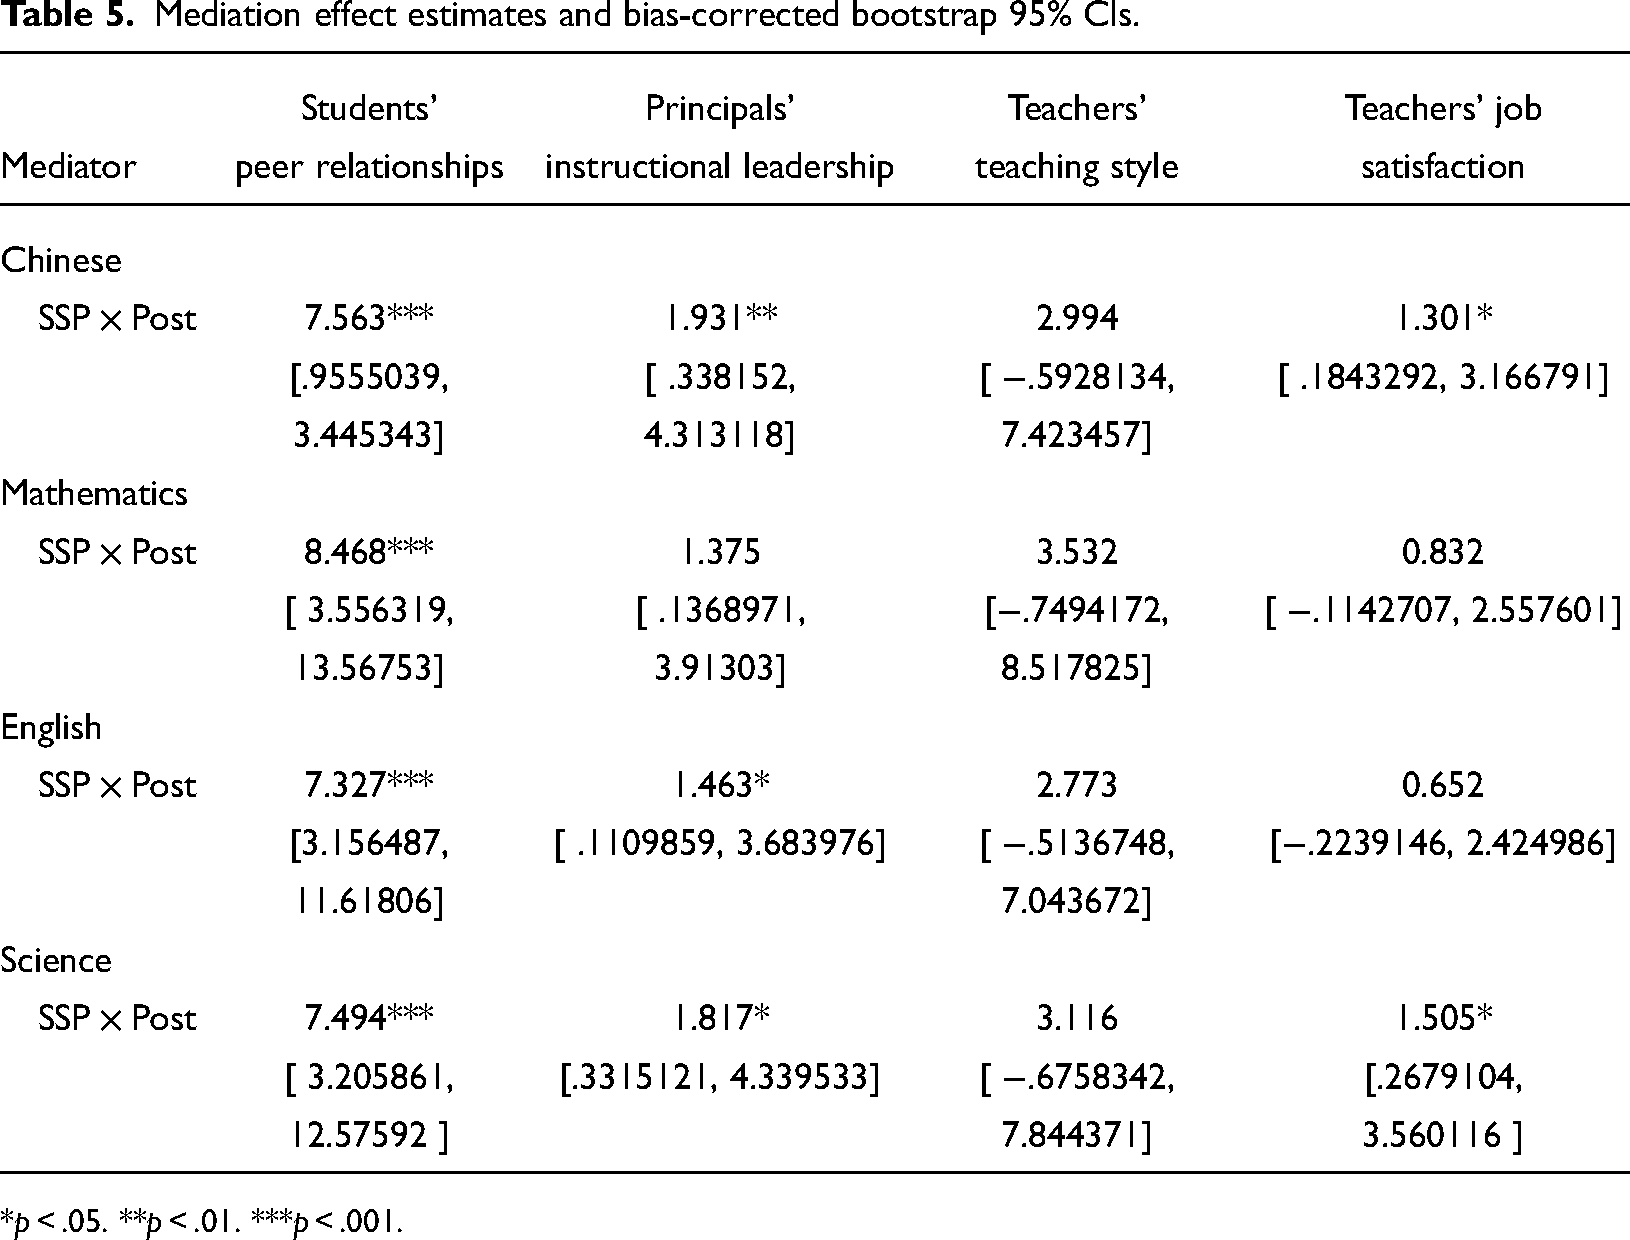
*p < .05. **p < .01. ***p < .001.
Appendix C contains the results of the mediation analysis using different measures for the four mediators. Similar to Table 4, the analyses evaluate how participation in SSP indirectly influences student test scores through changes in the mediators. The results confirm that improvements in students’ peer relationships and principals’ instructional leadership are significant mediators for the positive effects of SSP. These findings are in line with Table 4, supporting the conclusion that the primary pathways through which SSP impacts academic outcomes are through enhancing peer relationships and instructional leadership.
Excluding schools participating in other programs
Considering the fact that between 2018 and 2021, other interventions took place to improve overall school quality in Shanghai, such as the School Federation Project and the District-Run School Program, including those schools in the analysis may have biased our results. Thus, to ensure the robustness of our findings, we excluded such schools and conducted additional analyses. First, we searched documents published by the Shanghai Education Committee and identified the names of the schools participating in either the School Federation Project or the District-Run School Program between 2018 and 2021. We found that among the 35 SSP schools, 13 also participated in either of those two programs; while among the 491 schools in the control group, 212 participated in one of the two programs. Therefore, excluding these 212 schools yielded 314 schools, with 22 in the control group and 292 in the comparison group. We then used the same specifications and ran additional analysis with this sample of schools.
The results of these additional analysis, displayed in Table 6, confirm our main findings. As a matter of fact, both the DID and PSM-DID estimates become larger when excluding schools participating in other school improvement projects. This suggests that our conclusions are not driven by model specification or sample selection.
Robustness check: DID and PSM-DID estimates of the relationship between participation in the SSP and students’ academic outcomes.
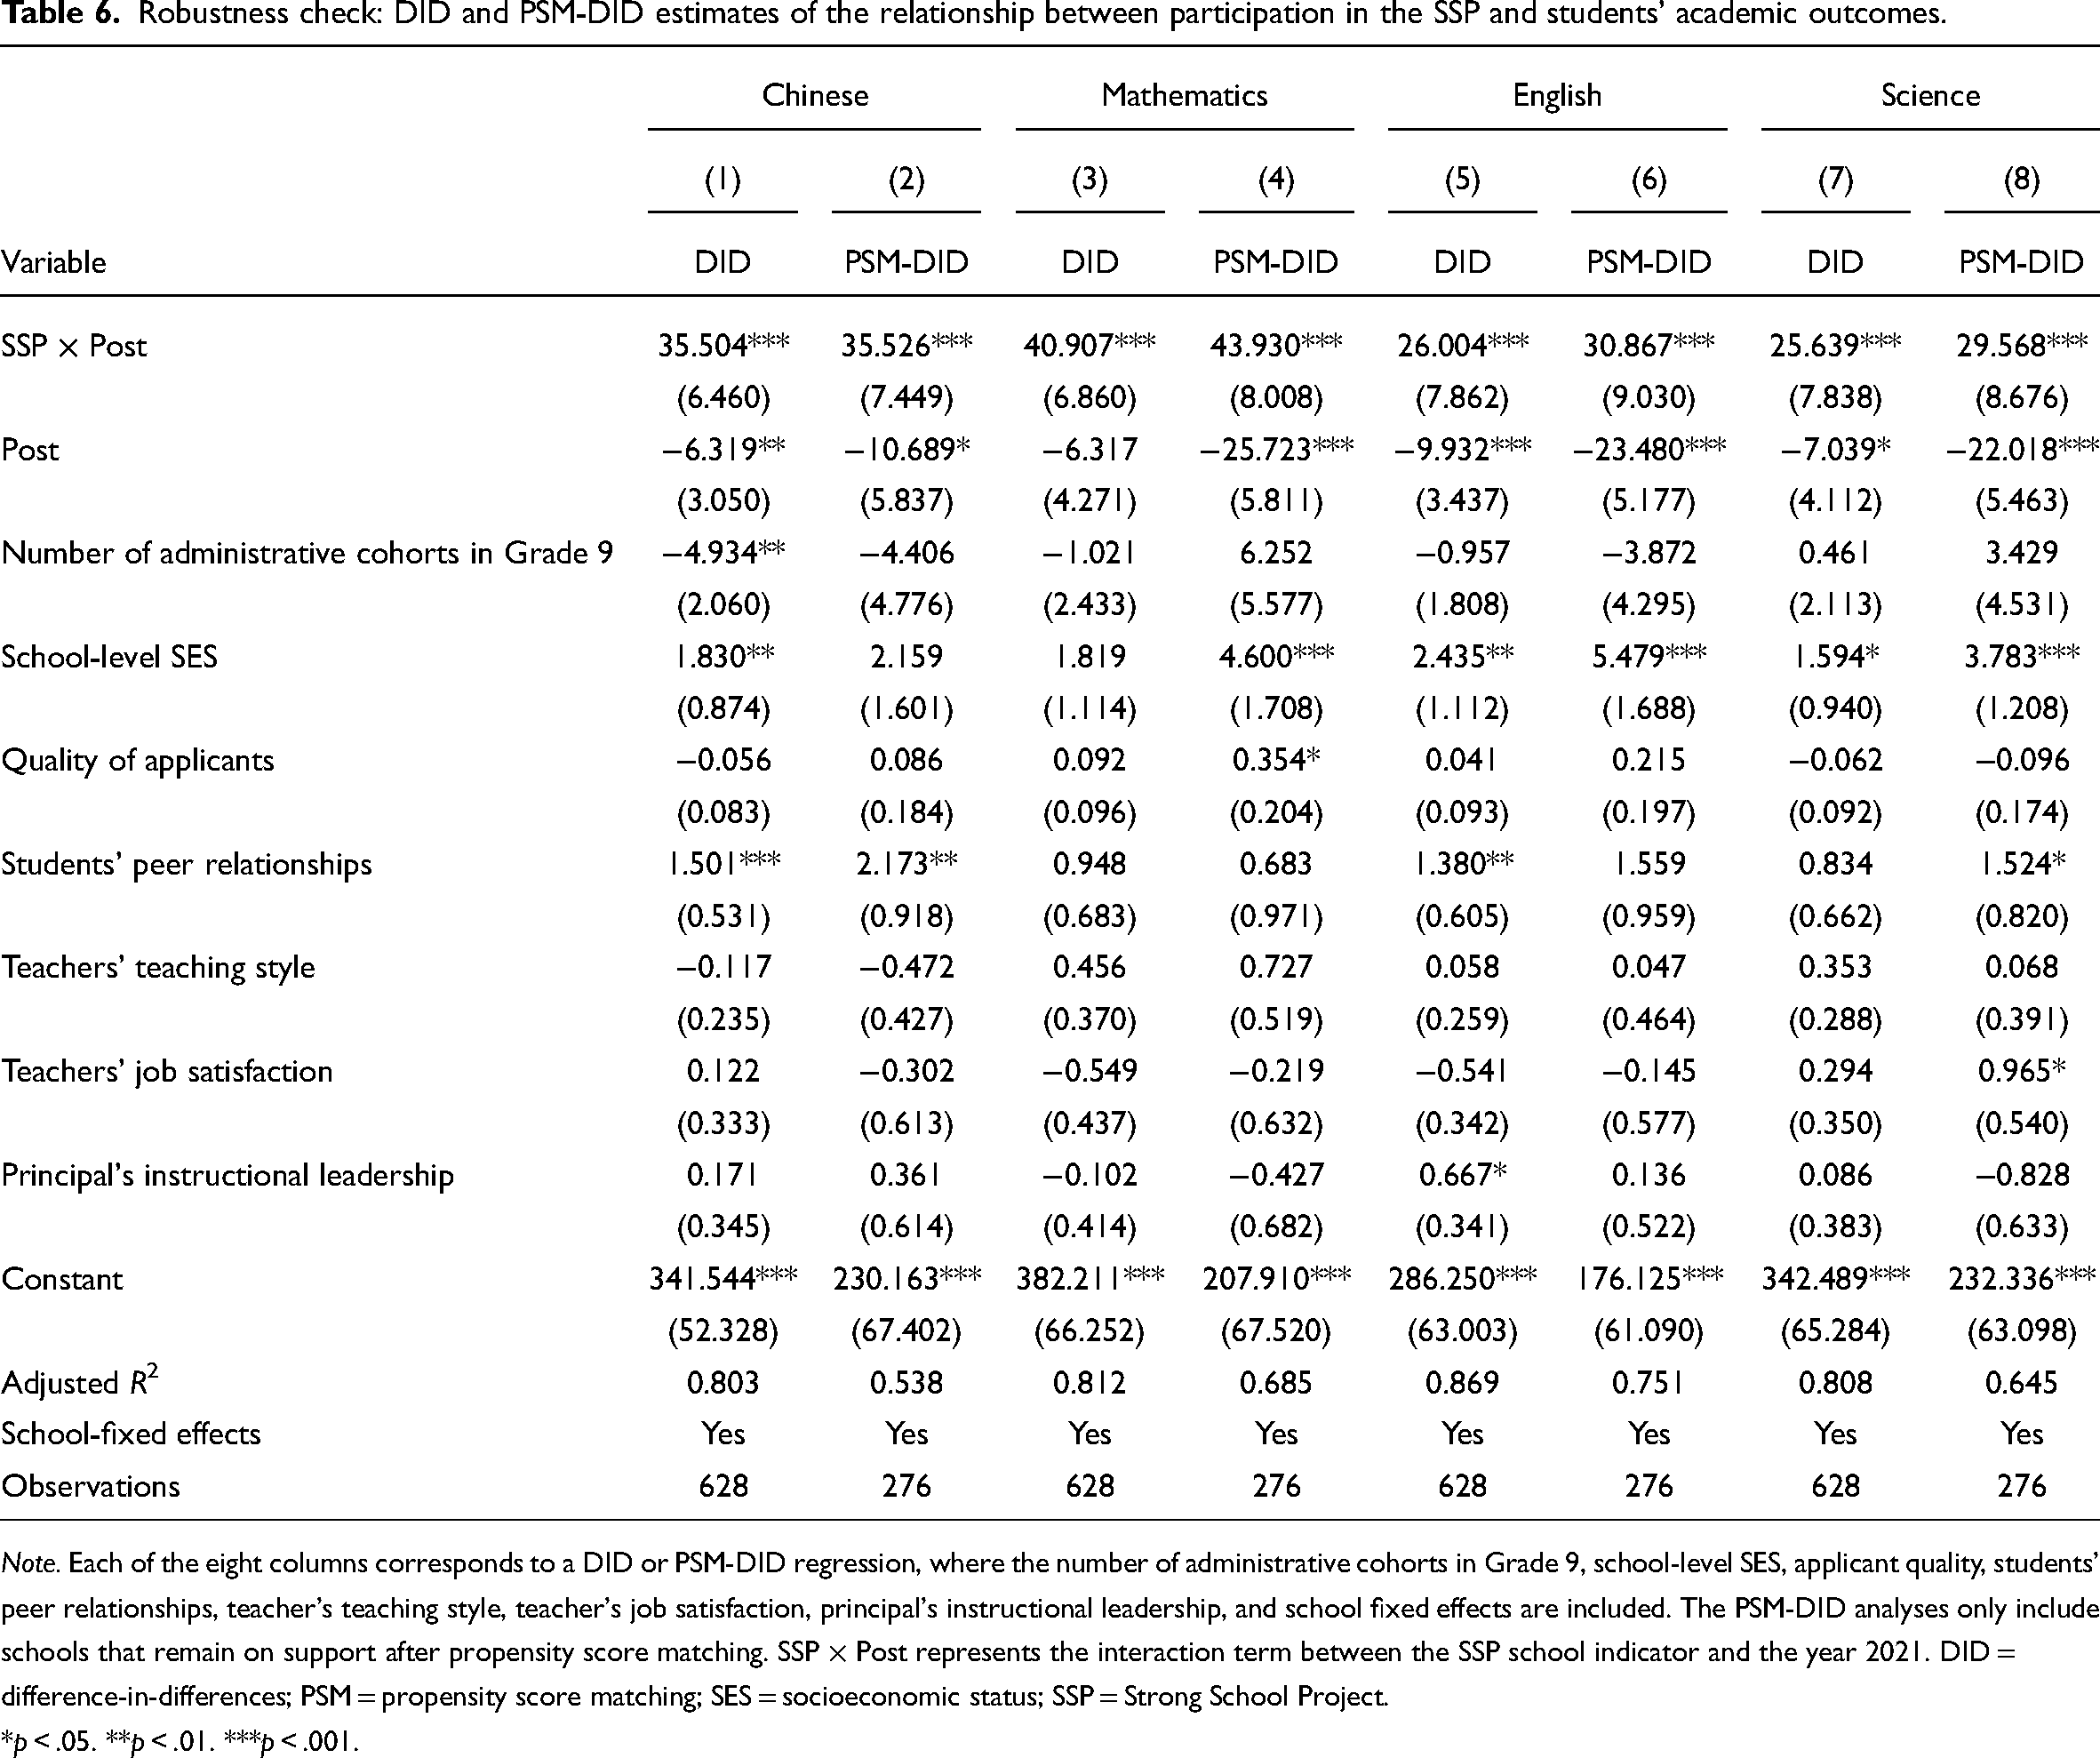
Note. Each of the eight columns corresponds to a DID or PSM-DID regression, where the number of administrative cohorts in Grade 9, school-level SES, applicant quality, students’ peer relationships, teacher's teaching style, teacher's job satisfaction, principal's instructional leadership, and school fixed effects are included. The PSM-DID analyses only include schools that remain on support after propensity score matching. SSP × Post represents the interaction term between the SSP school indicator and the year 2021. DID = difference-in-differences; PSM = propensity score matching; SES = socioeconomic status; SSP = Strong School Project.
*p < .05. **p < .01. ***p < .001.
Discussion and conclusion
Situated within the literature on school collaboration and the school-level factors influencing student learning, this study examined the relationships between inter-school collaboration and student academic outcomes, as well as the mechanisms driving positive learning outcomes. Using two waves of data from the evaluation of middle school academic quality in Shanghai between 2018 and 2021, we analyzed the impact of participation in Shanghai's SSP on student academic outcomes at low-performing schools. We employed DID, PSM-DID, and causal mediation analysis within the DID framework to investigate these relationships.
The results showed that school-to-school collaboration through SSP significantly improved students’ test scores in Chinese, mathematics, English, and science, with the most pronounced effect observed in mathematics (0.67 standard deviation) and the second-largest in Chinese (0.63 standard deviation). Mechanism analyses indicated that improvements in student academic performance primarily stemmed from enhanced peer relationships and principal leadership, with peer relationships having the greater effect.
While student-centered teaching contributed to improvements in all subjects, the SSP did not lead to significant changes in this approach compared to non-participating schools. Contrary to previous findings, teachers’ job satisfaction had a limited impact on student learning outcomes. The implications of these findings for educational research and practice are discussed below.
First, although there have been continuous calls for school collaboration, many prior studies have been descriptive or normative, focusing on mapping collaborations (e.g., Pino-Yancovic et al., 2020) and building effective models (e.g., Hargreaves et al., 2015). Few studies have empirically examined the effect of school-to-school collaboration on student achievement, and most of these were conducted in England (e.g., Chapman & Muijs, 2014; Wu et al., 2024). Our study adds empirical evidence to this area, highlighting the positive association between inter-school collaboration and student outcomes in a Chinese context.
Importantly, our study shows significant direct effects of the SSP on student learning outcomes. However, due to the limitations of our quantitative methods, we are unable to precisely disentangle the specific factors of the SSP that affect student learning. To gain more insight, we interviewed several SSP principals to identify the key factors that may influence student outcomes. From these interviews, we found several critical elements. One key aspect of the SSP is the allocation of approximately one million RMB to each school over a 3-year period for improvement projects. A significant portion of this funding was allocated to enhancing school facilities, including the construction of science laboratories, public libraries, and recreational spaces, as well as the renovation of basketball courts. In addition to these infrastructural improvements, the funds were used to introduce high-quality curricula in subjects designed to engage students, such as robotics, programming, and artificial intelligence. Another critical element of the SSP is the provision of mentoring resources for principals. This mentoring comes from not only experienced principals from high-performing schools but also from university professors specializing in teacher education and leadership. This ongoing support helps guide principals throughout the 3-year period, with some principals noting that they continue to maintain close connections with their mentors even after the program's completion. Furthermore, some SSP schools benefited from participation in the city-wide teacher rotation program, which provided them with curriculum specialists from the Shanghai Education Commission for 3 years. These experts offered support in teacher coaching, curriculum design, and instructional improvements, while also facilitating the involvement of additional citywide specialists to strengthen the overall curriculum and teaching practices.
Together with the broader objectives of the SSP, these factors played a crucial role in improving the learning environment and student outcomes, as evidenced by the significant direct effects observed in our study.
Second, this study goes beyond examining the direct relationship between school collaboration and student academic outcomes by exploring the mechanisms involved. Our analysis revealed that peer relationships are the most critical factor in enhancing student learning outcomes through inter-school collaboration, consistent with previous research (Țepordei et al., 2023).
As previous studies suggest, school-level collaborations do not directly lead to changes at the student level. Instead, fostering positive peer relationships requires a supportive school climate (Long et al., 2021). We hypothesize that the improvement in school climate was a result of activities associated with inter-school collaboration. In interviews with several SSP principals, they commonly expressed that during the school improvement process, their mission was to create a school that students would find satisfying. This mission was reflected in several key actions. First, schools restructured their physical spaces to create environments that are more student-centered. Second, principals emphasized a student-centered approach not only in school space design but also in teacher guidance, encouraging educators to focus on student needs. Additionally, as previously mentioned, schools made broad curricular adjustments, such as introducing innovative courses in science and technology, which enhanced student engagement. Teachers also received continuous professional development, leading to significant improvements in their teaching quality. These changes likely contributed to increased student satisfaction with both the school and their teachers. We argue that the positive peer relationships observed in our study reflect this broader improvement in student satisfaction with their overall school experience. Since our survey did not directly measure overall student satisfaction with the school, the peer relationships may serve as an indirect indicator of this broader enhancement in the school climate.
Overall, we believe that through the SSP, schools effectively utilized external resources, secured funding, and collaborated with experts to implement reforms in human resources and curriculum, thereby creating a student-centered learning environment.
Moreover, while the mediation analyses indicate that principals’ instructional leadership significantly improved due to inter-school collaboration, the interviewed principals emphasized notable improvements in their administrative and managerial skills, which align with the traditional career trajectory of school principals in China. Typically, secondary school principals rise from top-rated teaching backgrounds, excelling in teaching but often lacking comprehensive administrative and managerial training. This disparity highlights the importance of contextualizing leadership practices based on the specific needs of different school environments.
Some principals who previously worked in high-performing schools noted that their experiences did not seamlessly translate to the context of academically weaker schools. These weaker schools often face unique challenges, such as a lack of teacher and student motivation and a shortage of proficient teachers. The demands of these schools call for differentiated leadership practices tailored to their distinct contexts. The findings suggest that a “one-size-fits-all” approach to leadership may not be suitable and leadership development should reflect the unique needs of each school. Principals of weaker schools benefited most from discussions with experts in school management and curriculum, which helped them utilize available resources effectively, integrate curricula, and restore the confidence of teachers and students.
Third, the findings regarding the lack of a significant relationship between teachers’ job satisfaction and student outcomes diverge from much of the existing literature. However, a recent review by Hoque et al. (2023) noted that in East Asian countries/regions, including Shanghai, teachers’ job satisfaction tends to be low while student achievement is high. The principals we interviewed provided additional context, emphasizing the high stakes of the Grade 9 leaving exam, which determines students’ placement in vocational or academic high schools and influences their chances of attending a top-tier university. According to the principals, the pressure at Grade 9 may even exceed that experienced in Grade 12 before the college entrance exam. In Shanghai, teachers are compensated through performance-based pay, which is directly linked to student advancement outcomes. This dynamic suggests that Grade 9 student performance may be positively correlated with teacher pressure, leading to a potentially insignificant or even negative association between teacher satisfaction and student outcomes.
Fourth, despite the evidence that student-centered teaching positively influences learning outcomes in all subjects, participation in the SSP did not result in significant changes in teaching styles compared to control schools. One of the primary goals of the SSP is to enhance school quality by improving teachers’ instructional skills; however, the findings suggest that student-centered teaching did not significantly improve. This calls for further investigation into which activities can effectively promote changes in teaching approaches in low-performing schools.
In summary, these findings underscore the need to further investigate the relationship between school-to-school collaboration and student learning across different educational contexts. Moreover, they highlight the importance of understanding the mechanisms through which low-performing schools can improve through collaborative arrangements.
Despite these contributions, we acknowledge several limitations of this study. First, the lack of multiple waves of data restricts the scope of our analysis. We were unable to examine pre-intervention trends for SSP and non-SSP schools or determine whether the observed positive effects would persist over time, as future data collection is required for such an assessment. Additionally, our analysis focused on Grade 9 data, which may limit the generalizability of the findings to other educational levels. Research indicates that the influence of school leadership and peer relationships varies across educational stages, with younger students being more affected by teachers and principals, while middle school students are more influenced by peers (Cai et al., 2024). Therefore, the impact of school-to-school collaboration may differ at other educational levels, underscoring the need for further research in this area.
Second, the scope of principal leadership measured in this study was limited to instructional leadership, as the surveys accompanying the Shanghai Green Index data primarily focused on principals’ instructional practices. This limitation leaves open the question of whether participation in SSP also enhanced organizational management skills, which may be crucial for addressing the diverse needs of different schools. Future research should examine both instructional and managerial leadership practices to understand their relative significance across varied school contexts.
Third, we acknowledge the influence of district-level differences in leadership activities. Due to the administrative autonomy granted to each district, a wide range of initiatives were implemented to enhance principal leadership. However, without detailed data encompassing all categories of activities across districts, it is challenging to fully assess the effectiveness of these leadership improvement initiatives. This limitation emphasizes the need for more granular data that captures the diversity of leadership practices to understand which approaches are most effective under different contextual circumstances.
Finally, the voluntary nature of participation by SSP schools may have introduced selection bias. Since SSP schools chose to participate, they may have been more motivated or had stronger leadership compared to non-SSP schools. This self-selection could lead to an overestimation of SSP's effects, as these schools may have had characteristics that made them more likely to benefit from the intervention, regardless of the program itself. Future studies could address this limitation by employing methods such as instrumental variables to better account for the potential bias introduced by voluntary participation.
Footnotes
Contributorship
In this project, Maohua Wang was responsible for data access, research design, data analysis, and proofreading of manuscripts. Huacong Liu was responsible for conceptualization, data visualization, drafting, and responding to editorial questions.
Declaration of conflicting interests
The authors declared no potential conflicts of interest with respect to the research, authorship, and/or publication of this article.
Ethical statement
This study was conducted in accordance with the Academic Integrity Code of Shanghai Jiao Tong University. The data used in this study was obtained through the Shanghai Municipal Education Commission Basic Education Quality Monitoring Center. Due to the student data confidentiality agreement the authors signed, only school-level data, instead of individual student data were received and used for the analyses.
Funding
The authors disclosed receipt of the following financial support for the research, authorship, and/or publication of this article: This work was supported by the Shanghai Pujiang Talent Program (grant number 22PJC056).
Appendix A. Trends for test scores in Chinese,Math,English,and Science in 2015,2018,and 2021.
Note. Each of the eight columns corresponds to a DID or PSM-DID regression, where the number of administrative cohorts in Grade 9, school-level SES, applicant quality, students’ peer relationships, teacher's teaching style, teacher's job satisfaction, principal's instructional leadership, and school fixed effects are included. The PSM-DID analyses only include schools that remain on support after propensity score matching. SSP × Post represents the interaction term between the SSP school indicator and the year 2021. DID = difference-in-differences; PSM = propensity score matching; SES = socioeconomic status; SSP = Strong School Project. *p < .05. **p < .01. ***p < .001.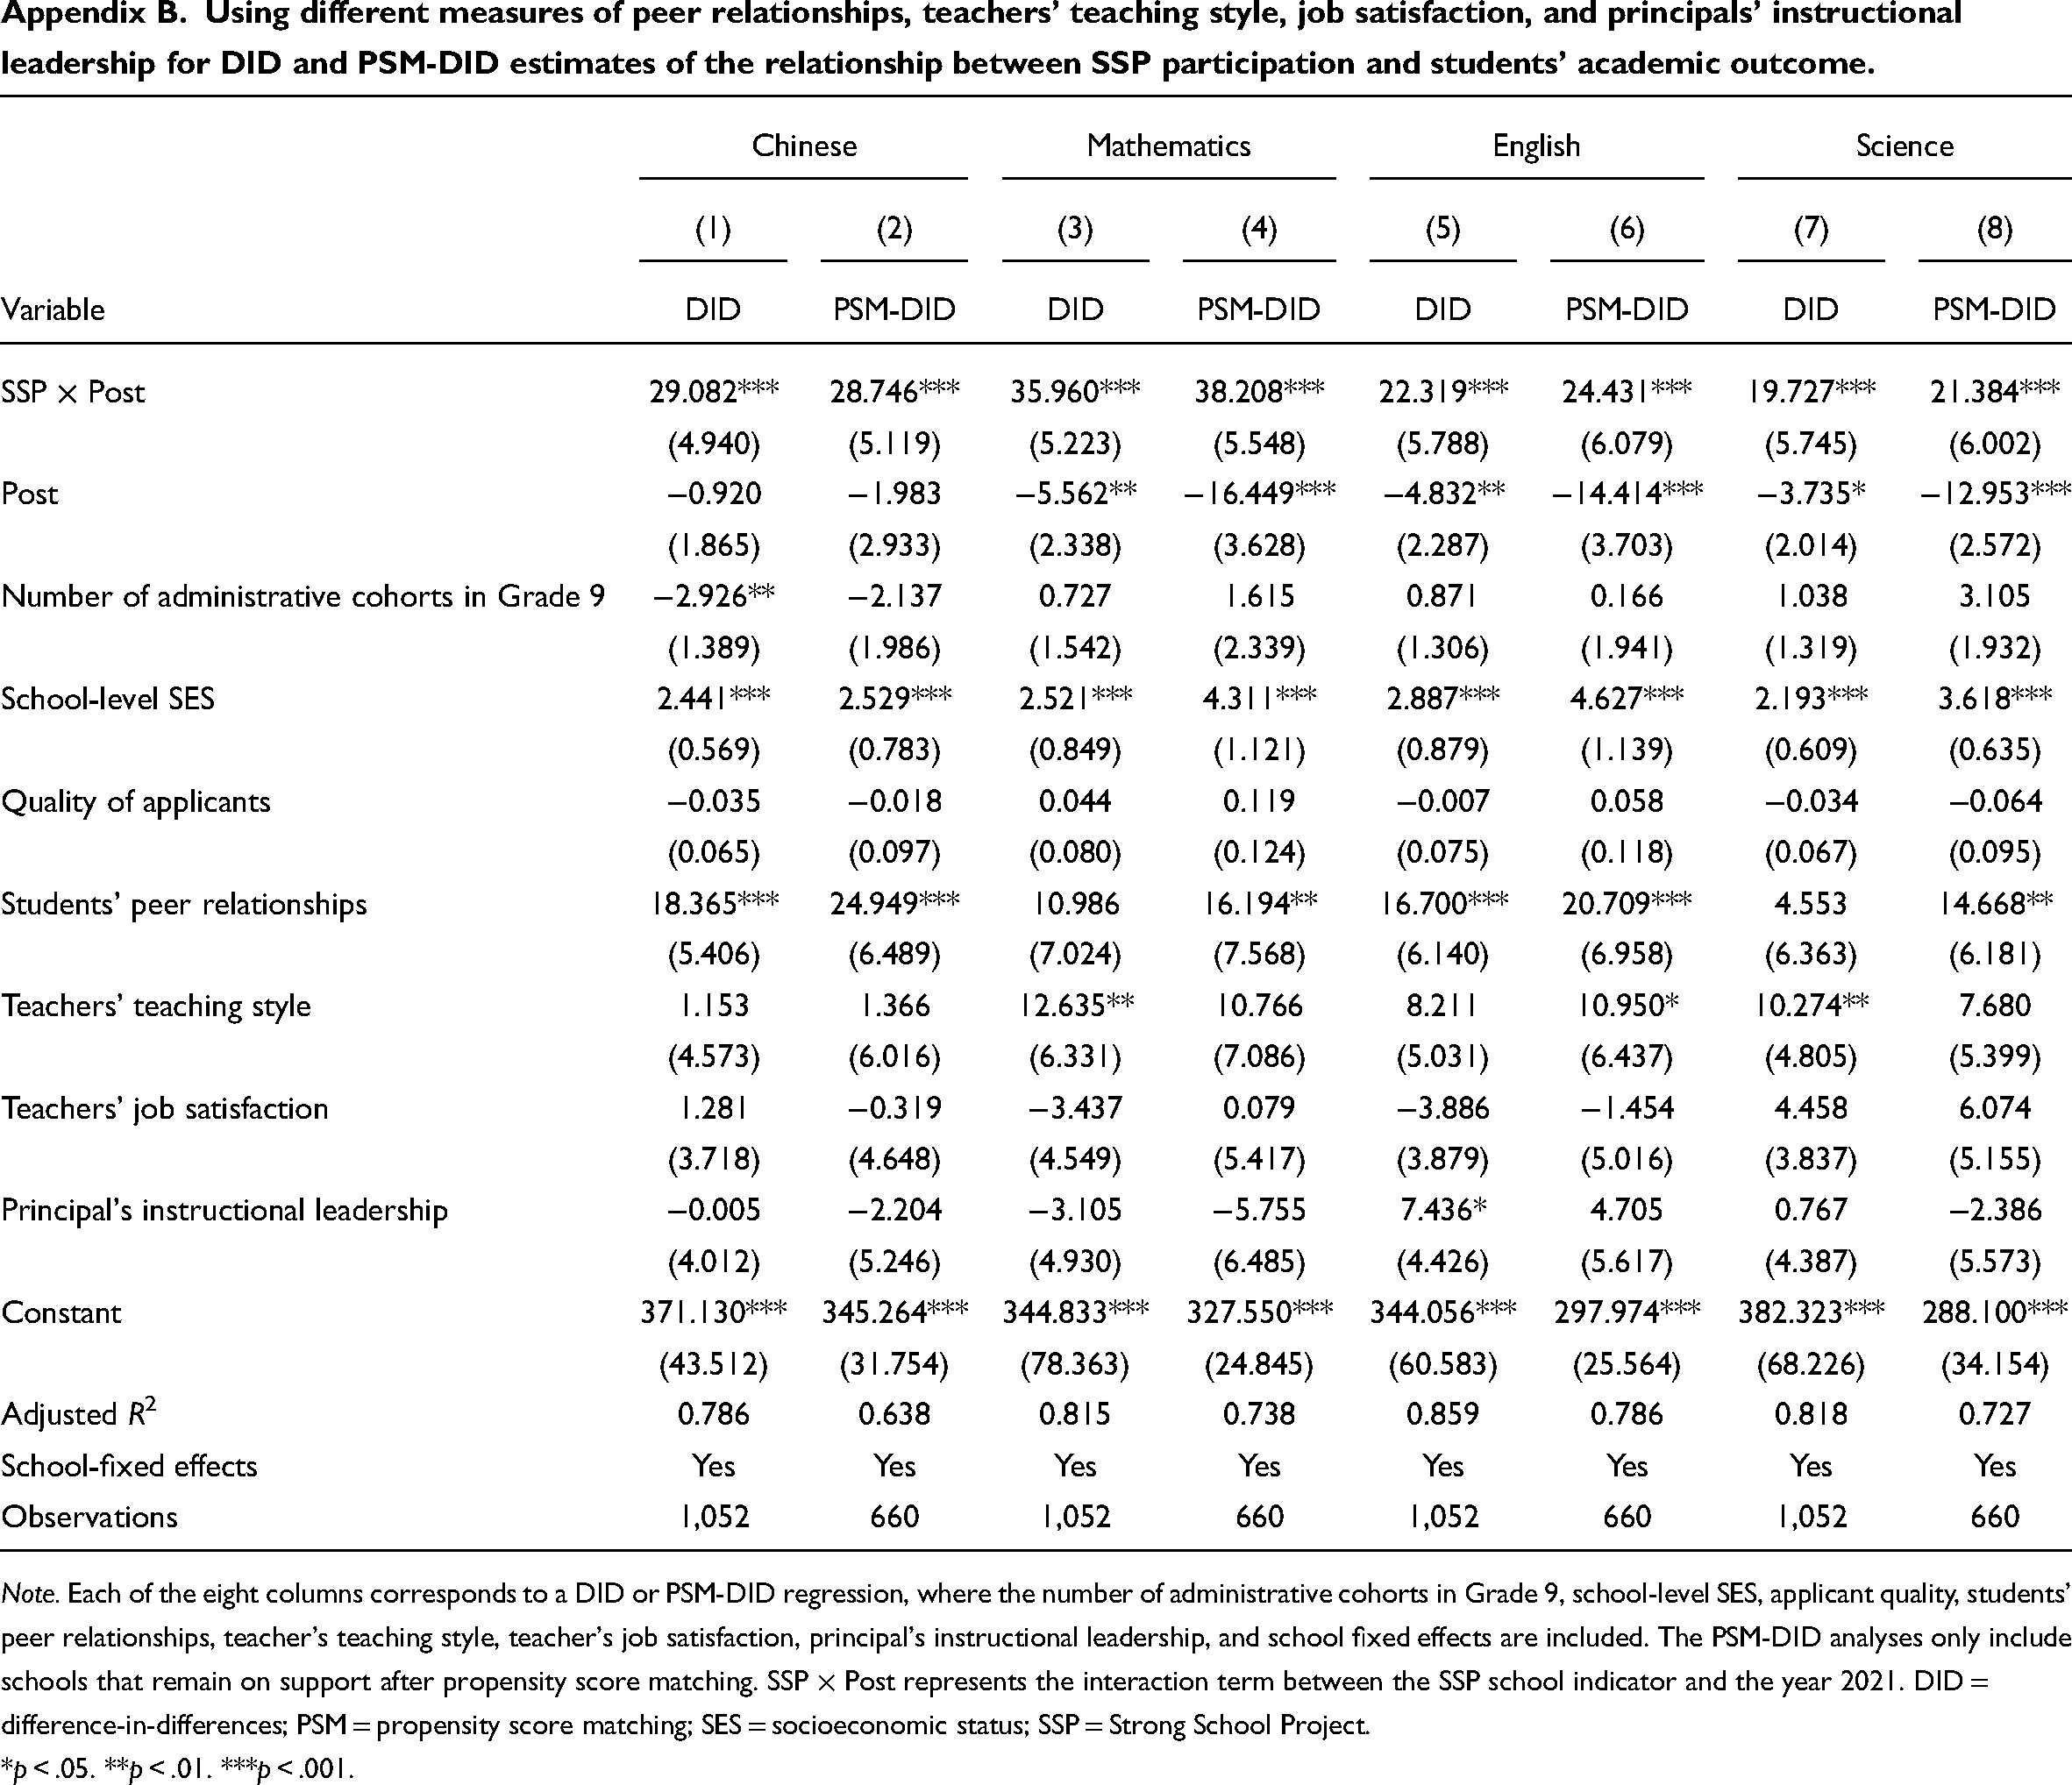
Chinese
Mathematics
English
Science
(1)
(2)
(3)
(4)
(5)
(6)
(7)
(8)
Variable
DID
PSM-DID
DID
PSM-DID
DID
PSM-DID
DID
PSM-DID
SSP × Post
29.082***
28.746***
35.960***
38.208***
22.319***
24.431***
19.727***
21.384***
(4.940)
(5.119)
(5.223)
(5.548)
(5.788)
(6.079)
(5.745)
(6.002)
Post
−0.920
−1.983
−5.562**
−16.449***
−4.832**
−14.414***
−3.735*
−12.953***
(1.865)
(2.933)
(2.338)
(3.628)
(2.287)
(3.703)
(2.014)
(2.572)
Number of administrative cohorts in Grade 9
−2.926**
−2.137
0.727
1.615
0.871
0.166
1.038
3.105
(1.389)
(1.986)
(1.542)
(2.339)
(1.306)
(1.941)
(1.319)
(1.932)
School-level SES
2.441***
2.529***
2.521***
4.311***
2.887***
4.627***
2.193***
3.618***
(0.569)
(0.783)
(0.849)
(1.121)
(0.879)
(1.139)
(0.609)
(0.635)
Quality of applicants
−0.035
−0.018
0.044
0.119
−0.007
0.058
−0.034
−0.064
(0.065)
(0.097)
(0.080)
(0.124)
(0.075)
(0.118)
(0.067)
(0.095)
Students’ peer relationships
18.365***
24.949***
10.986
16.194**
16.700***
20.709***
4.553
14.668**
(5.406)
(6.489)
(7.024)
(7.568)
(6.140)
(6.958)
(6.363)
(6.181)
Teachers’ teaching style
1.153
1.366
12.635**
10.766
8.211
10.950*
10.274**
7.680
(4.573)
(6.016)
(6.331)
(7.086)
(5.031)
(6.437)
(4.805)
(5.399)
Teachers’ job satisfaction
1.281
−0.319
−3.437
0.079
−3.886
−1.454
4.458
6.074
(3.718)
(4.648)
(4.549)
(5.417)
(3.879)
(5.016)
(3.837)
(5.155)
Principal's instructional leadership
−0.005
−2.204
−3.105
−5.755
7.436*
4.705
0.767
−2.386
(4.012)
(5.246)
(4.930)
(6.485)
(4.426)
(5.617)
(4.387)
(5.573)
Constant
371.130***
345.264***
344.833***
327.550***
344.056***
297.974***
382.323***
288.100***
(43.512)
(31.754)
(78.363)
(24.845)
(60.583)
(25.564)
(68.226)
(34.154)
Adjusted R2
0.786
0.638
0.815
0.738
0.859
0.786
0.818
0.727
School-fixed effects
Yes
Yes
Yes
Yes
Yes
Yes
Yes
Yes
Observations
1,052
660
1,052
660
1,052
660
1,052
660
Note. Each of the 12 columns for the four subjects corresponds to a DID regression estimation, which includes the number of administrative cohorts in Grade 9, school-level SES, applicant quality, 526 school fixed effects, a constant term, an indicator for SSP schools, and a time dummy. SSP × Post represents the interaction term between the SSP school indicator and the year 2021. *p < .05. **p < .01. ***p < .001.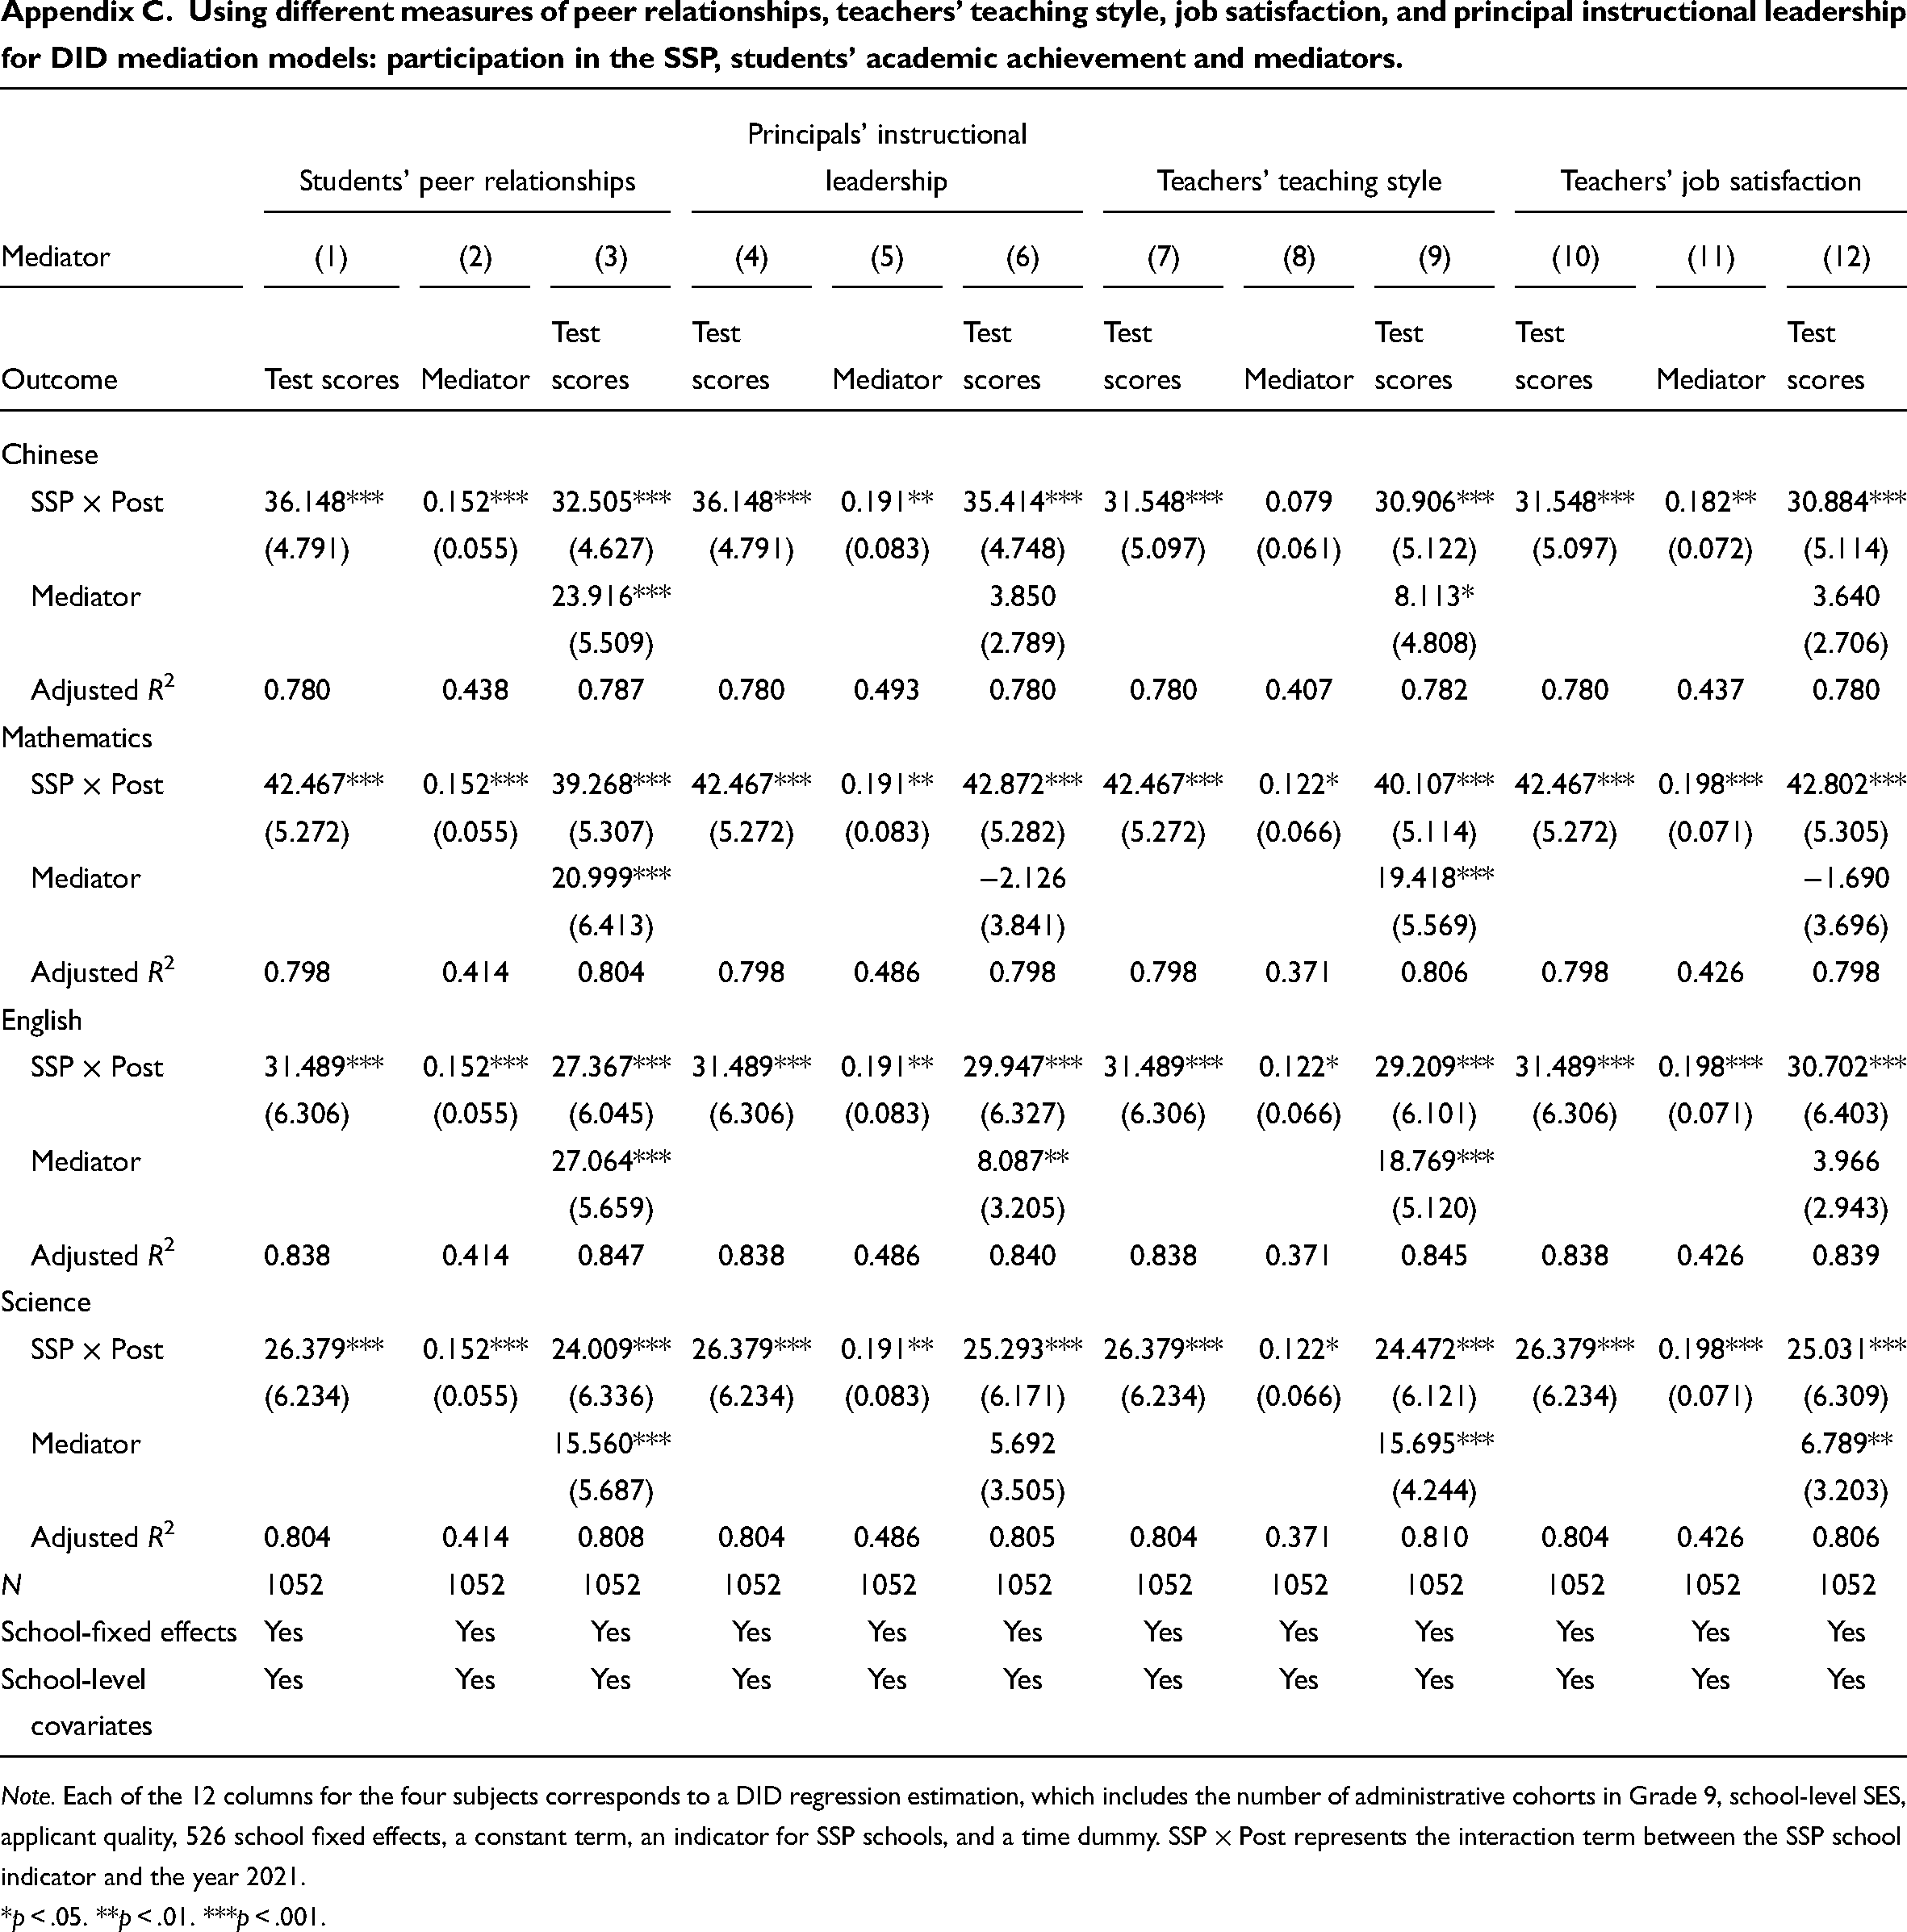
Mediator
Students’ peer relationships
Principals’ instructional leadership
Teachers’ teaching style
Teachers’ job satisfaction
(1)
(2)
(3)
(4)
(5)
(6)
(7)
(8)
(9)
(10)
(11)
(12)
Outcome
Test scores
Mediator
Test
scores
Test
scores
Mediator
Test
scores
Test
scores
Mediator
Test
scores
Test
scores
Mediator
Test
scores
Chinese
SSP × Post
36.148***
0.152***
32.505***
36.148***
0.191**
35.414***
31.548***
0.079
30.906***
31.548***
0.182**
30.884***
(4.791)
(0.055)
(4.627)
(4.791)
(0.083)
(4.748)
(5.097)
(0.061)
(5.122)
(5.097)
(0.072)
(5.114)
Mediator
23.916***
3.850
8.113*
3.640
(5.509)
(2.789)
(4.808)
(2.706)
Adjusted R2
0.780
0.438
0.787
0.780
0.493
0.780
0.780
0.407
0.782
0.780
0.437
0.780
Mathematics
SSP × Post
42.467***
0.152***
39.268***
42.467***
0.191**
42.872***
42.467***
0.122*
40.107***
42.467***
0.198***
42.802***
(5.272)
(0.055)
(5.307)
(5.272)
(0.083)
(5.282)
(5.272)
(0.066)
(5.114)
(5.272)
(0.071)
(5.305)
Mediator
20.999***
−2.126
19.418***
−1.690
(6.413)
(3.841)
(5.569)
(3.696)
Adjusted R2
0.798
0.414
0.804
0.798
0.486
0.798
0.798
0.371
0.806
0.798
0.426
0.798
English
SSP × Post
31.489***
0.152***
27.367***
31.489***
0.191**
29.947***
31.489***
0.122*
29.209***
31.489***
0.198***
30.702***
(6.306)
(0.055)
(6.045)
(6.306)
(0.083)
(6.327)
(6.306)
(0.066)
(6.101)
(6.306)
(0.071)
(6.403)
Mediator
27.064***
8.087**
18.769***
3.966
(5.659)
(3.205)
(5.120)
(2.943)
Adjusted R2
0.838
0.414
0.847
0.838
0.486
0.840
0.838
0.371
0.845
0.838
0.426
0.839
Science
SSP × Post
26.379***
0.152***
24.009***
26.379***
0.191**
25.293***
26.379***
0.122*
24.472***
26.379***
0.198***
25.031***
(6.234)
(0.055)
(6.336)
(6.234)
(0.083)
(6.171)
(6.234)
(0.066)
(6.121)
(6.234)
(0.071)
(6.309)
Mediator
15.560***
5.692
15.695***
6.789**
(5.687)
(3.505)
(4.244)
(3.203)
Adjusted R2
0.804
0.414
0.808
0.804
0.486
0.805
0.804
0.371
0.810
0.804
0.426
0.806
N
1052
1052
1052
1052
1052
1052
1052
1052
1052
1052
1052
1052
School-fixed effects
Yes
Yes
Yes
Yes
Yes
Yes
Yes
Yes
Yes
Yes
Yes
Yes
School-level covariates
Yes
Yes
Yes
Yes
Yes
Yes
Yes
Yes
Yes
Yes
Yes
Yes