
Abstract
Purpose
This study uses data from the 2019 China Institute for Educational Finance Research-Household Survey to investigate expenditure on children's education in China.
Design/Approach/Methods
Using descriptive and regression analysis, this study analyzes the level and structure of household expenditure on children's education, the associated disparities, and household financial burden.
Findings
The average household expenditure on regular full-time education nationwide was RMB 8,139 per child, accounting for 10.8% of total household expenditure. On average, 24.4% and 15.5% of elementary and high school students participated in out-of-school subject- and interest-oriented tutoring in AY 2018–2019, respectively. On an average, it costs a household approximately RMB 233,000 to educate a child from preschool to the undergraduate level. The total investments in regular full-time education nationwide were estimated to be RMB 6.2 billion—6.87% of the national Gross Domestic product. Moreover, based on an overview of various statistics on school funding, this study found that several years of public investments in compulsory education and rural schools have significantly reduced the disparities in school funding among income groups.
Originality/Value
This research is the first report giving a comprehensive picture of household expenditures on education nationwide in China. It provides empirical evidence for exploring policy tools to realize the balanced development of education.
Introduction
For over four decades, income inequality has been trending upward globally (Piketty & Saez, 2014). Under the dual impact of a widening income gap and growing returns on higher education, households have been investing an increasing amount of money into childrearing amid increasingly fierce competition for quality educational resources. While mid- to high-income groups attempt to maintain their existing advantages by increasing their investments in their children's education, mid- to low-income groups invest in their children's education to gain opportunities for upward mobility. Consequently, inequalities in educational resources and opportunities remain a pressing issue (Doepke & Zilibotti, 2019; Ramey & Ramey, 2009; Schneider et al., 2018). The increasing burden on households to pay for children's education and the rising inequality associated have also drawn attention from the public and policymakers in China (Chi & Qian, 2016; Chu, 2008; Gustafsson & Li, 2004; Lei, 2005; Li, 2000).
However, due to limited statistics on educational financing, the real costs of household education expenditures are underestimated. The official statistics show that the Chinese government spent 4.11% of China's Gross Domestic product (GDP; RMB 3,699.6 billion) on education in 2018, while non-governmental funding accounted for 1.02% of the GDP (RMB 914.7 billion). According to an international comparative study conducted by the UNESCO Institute for Statistics (UNESCO-UIS) using education financing data from 214 countries and territories for the 2005–2013 period, showed that published education financing statistics tend to focus on the key government actors. After accounting for household education spending, total education expenditure as a share of GDP was found to be significantly higher than previously assumed, suggesting the importance of the contributions made by households in education investment (UNESCO-UIS, 2016). The study also found that households in developing countries, especially low-income households, were shouldering much higher education costs than those in developed countries.
There are several reasons why households in developing countries bear relatively larger shares of total education costs compared to those in developed countries. First, in developing countries, public spending on education is relatively low because the governments tend to lack the fiscal capacity or political will to provide public education for all. Second, public schools charge users’ tuition fees, textbooks, meals, and other related schooling expenditures. Third, private schools provide a significant proportion of education without public subsidies (Bray, 1999; Fiske & Ladd, 2004; Tilak, 2002; UNESCO-UIS et al., 2002). Moreover, in addition to formal schooling, structured learning activities after the formal school day—such as private tutoring, cram schools, and online courses—are expanding quickly around the world. Although an increasing number of countries are providing free basic education for all, families are paying an increasing amount of money for education post the formal school hours in the hope that the extra investment will improve their children's academic performance. Regarding the rising inequality in families’ additional investments outside formal schools, some governments require public schools to provide academically oriented after-school programs to socioeconomically disadvantaged students (The No Child Left Behind Act of 2001). Some also subsidize the cost of private tutoring for families who cannot afford it (Park et al., 2016).
In 2007, following the universal free compulsory education in China, parents and scholars started paying more attention to household expenditure on after-school enrichment activities, such as tutoring programs, music and art lessons, summer camp programs, and other extracurricular activities. Studies using household survey data have found significant gaps in household education expenditure between high- and low-income families and between urban and rural families (Chi et al., 2011; Chu, 2008; Ding & Xue, 2005; Gustafsson & Li, 2004; Lei & Zhong, 2003; Li, 2006; Wei & Qiu, 1998). Many scholars have examined the determinants of household education expenditure, including household income, parents’ education, regions of residence, social capital, and political power (Ding & Weng, 2015; Ye, 2012). Several studies have found that while the government strictly regulates in-school expenditure for primary and secondary schools, household education expenditure is still increasing quickly due to significant out-of-school expenditure, especially among urban families (Chi & Qian, 2016). However, few studies have investigated the full costs of household expenditure on children's education across the country. Furthermore, most of the household surveys used in these studies are not representative enough to give a comprehensive picture of household education expenditure in China. Indeed, some of these household surveys were conducted in large cities (Chi & Qian, 2016; Lei, 2005) or urban areas (Ding & Xue, 2005; Wei & Qiu, 1998), some only covered rural areas (Lei & Zhong, 2003; Li, 2006), while others were restricted to certain regions (Chu, 2008).
To investigate the full costs of household expenditure on children's education, in 2017, the China Institute for Educational Finance Research (CIEFR) jointly conducted its first Household Survey (CIEFR-HS) with the Survey and Research Center for Chinese Household Finance. A follow-up study was conducted in 2019. Using data from the 2019 CIEFR-HS, this study examines the level and structure of household expenditure on children's education in China, the associated disparities, and financial burden on a national, urban–rural, and regional scale and across cities at different levels of development. This study extends existing research in three ways. First, the CIEFR-HS is representative at the national, provincial, and sub-provincial city levels. Compared to research using surveys restricted to large cities, urban or rural areas, or certain provinces, this analysis gives a more complete picture of household education expenditures. Second, in addition to educational opportunities and associated school fees, this study investigates the participation of elementary and high school students in out-of-school supplementary tutoring and the providers of such tutoring services across the country. Third, combining statistics on school funding, this study examines the allocation of public investment in basic education among different student groups.
Overview of the CIEFR-HS
Sample distribution
The CIEFR-HS is a nationwide survey conducted by the CIEFR to promote cross-disciplinary research on educational finance by collecting information related to households’ educational choices and expenditures. The survey employs a stratified three-stage probability proportional to size random sampling design. The first sampling stage included 2,585 counties/provincial cities in China. The second sampling stage involved selecting residential committees/villages from the counties/cities. The third sampling stage involved selecting households from the residential committees/villages. Conducted in 2017, the first round of the survey covered 3 autonomous regions, 4 centrally administered municipalities, 22 provinces, 355 cities/districts/counties, and 1,428 residential communities, excluding Xizang, Xinjiang, Special Administrative Regions of China (Hong Kong SAR, Macao SAR), and Chinese Taiwan. A total of 40,011 households participated. Among the 127,000 household members, about 21,000 attended schools and 14,000 were K-12 school students. The survey included the status quo of early childhood education for children aged 0–3, kindergarten attendance among children aged 3–6, school attendance among children aged 6–16 and above, choices of elementary and high schools, household expenditure on education, and government subsidies.
Conducted in 2019, the second round of the CIEFR-HS covered 107,008 members from 34,643 households in 3 autonomous regions, 4 centrally administered municipalities, 22 provinces, 345 cities/districts/counties, and 1,360 residential communities across China. The 2019 survey included 12,336 rural households and 22,307 urban households, accounting for 35.6% and 64.4% of the sample, respectively. The survey covered 1,365 communities—605 rural and 760 urban communities (44.3% and 55.7%, respectively).
Table 1 presents the distribution of enrolled students in the 2019 survey sample.
Sample distribution of enrolled students by education stage.
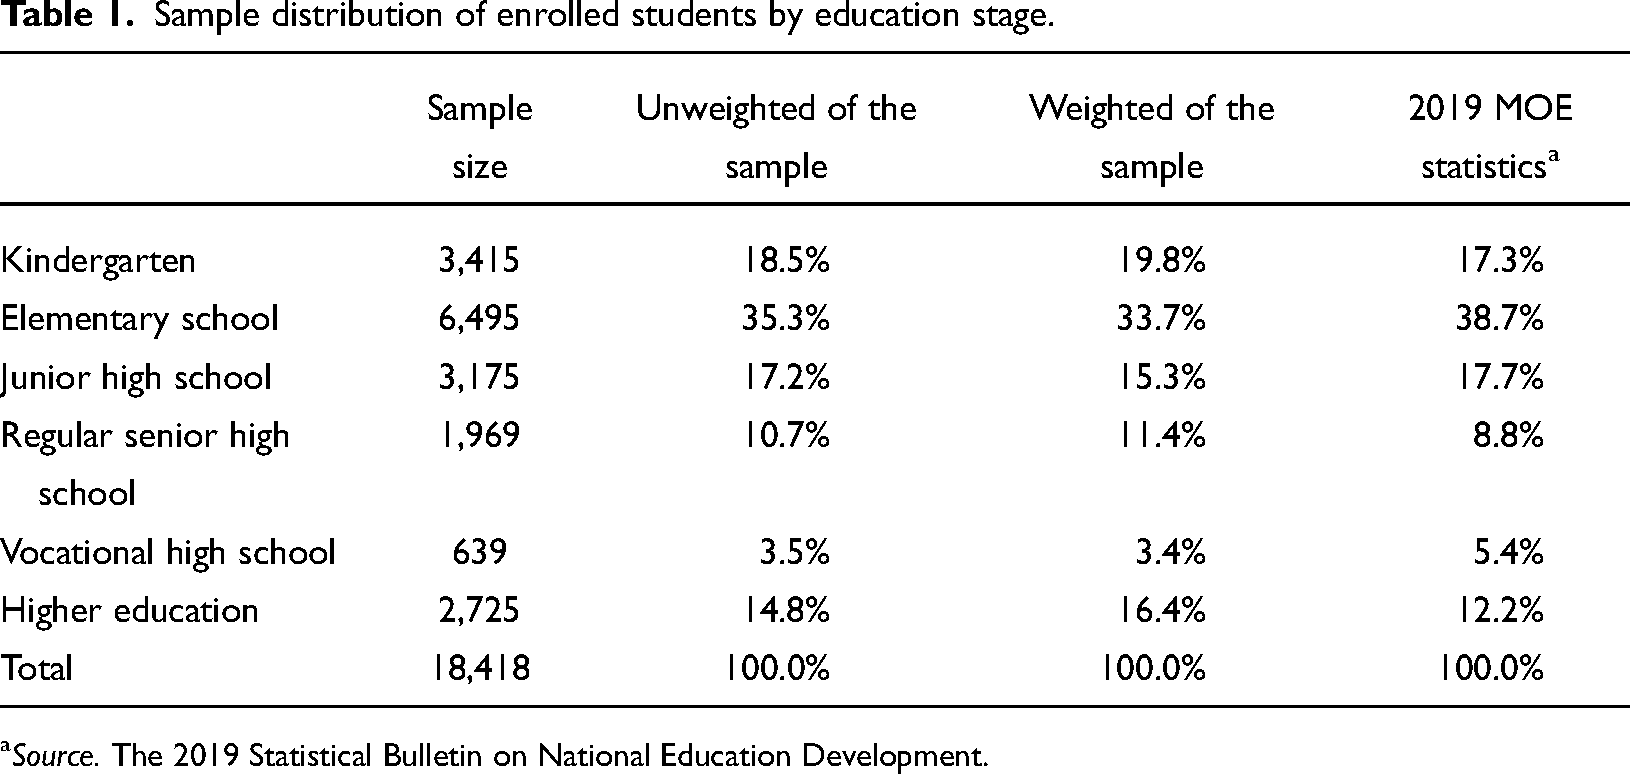
Source. The 2019 Statistical Bulletin on National Education Development.
Definition of educational expenditure
The definition of household expenditure on education adopted by the CIEFR-HS was primarily based on the UOE data collection manual, an instrument for collecting data on educational finance (UNESCO-UIS et al., 2022). 1 Table 2 shows the coverage of educational finance and expenditure statistics in terms of education, educational institutions, and educational goods and services.
Framework for educational expenditure.
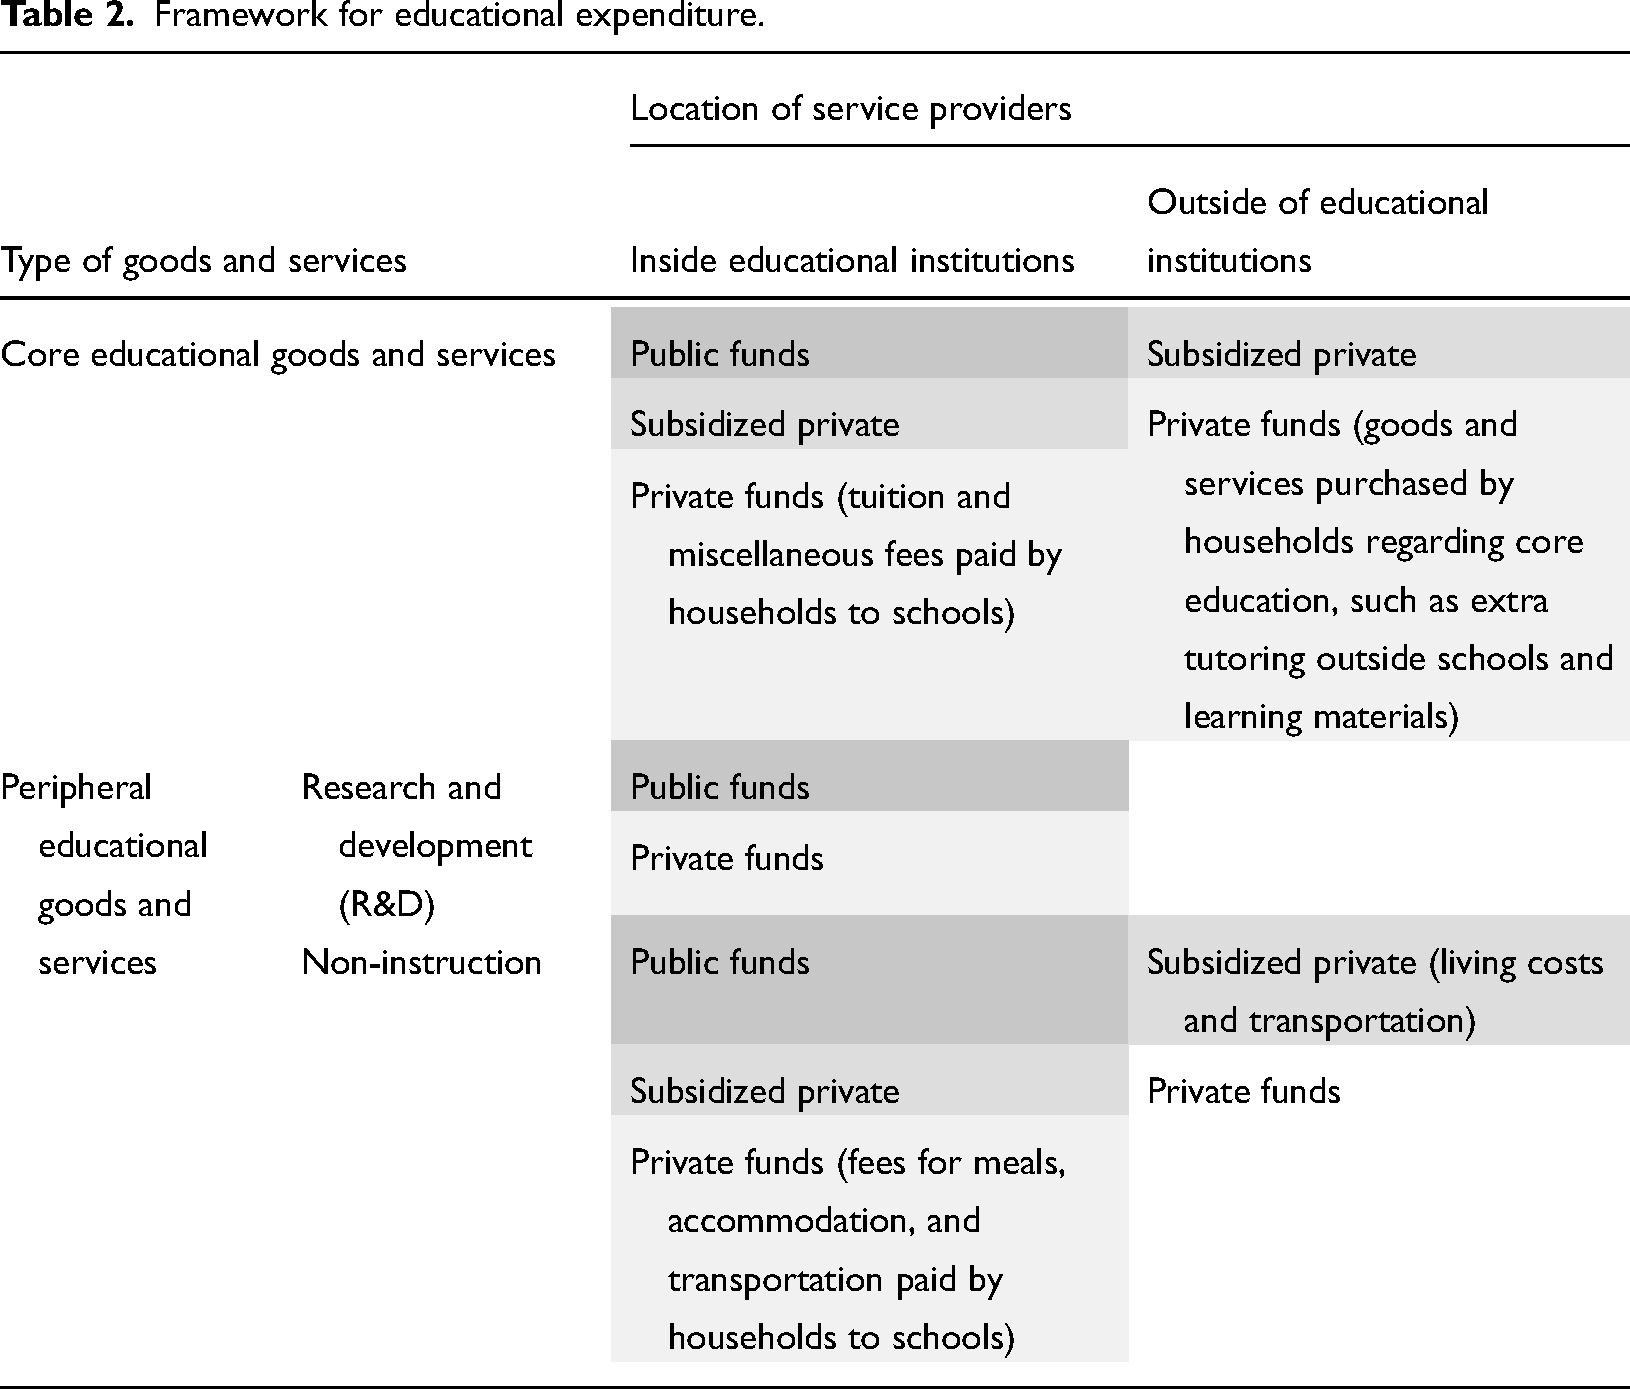
Based on the framework outlined in Table 2, the CIEFR-HS divided household expenditure on education into expenditure on core and peripheral educational goods and services inside schools and those outside schools. More specifically, it investigated the educational opportunities available to school-age children in the household, household expenditure on education, and government subsidies.
First, educational opportunities include the types of education and schools currently and previously attended by a child, the obstacles encountered during school admission, and the money and other resources invested by the household to gain access to school.
Second, in terms of household expenditure on education, the survey focused on household expenditure on education per child, which comprised educational expenditure associated with the formal schooling system and expenditure related to non-school institutions and other forms of out-of-school education. These included expenses related to core teaching services and peripheral educational goods and services not directly related to teaching. Based on the classification of educational expenditure adopted by the survey, this study first divided expenditure on children's education into in-school and out-of-school expenditure. The former was further divided into tuition fees and other in-school expenditures. This subcategory comprised three main components: (1) fees for services provided by schools, such as meals, accommodation, and transportation; (2) payments collected by schools on behalf of other entities, such as fees for teaching materials and aids, school uniforms, medical insurance, health checks, and examinations; and (3) supplementary fees (or developmental fees), which include fees for extra tutoring, interest classes, and extracurricular activities inside schools. Meanwhile, out-of-school expenditure was further divided into two dimensions: (1) expenditure on out-of-school supplementary tutoring, including subject- and interest-oriented tutoring; and (2) other learning materials and supplies.
Third, regarding government subsidies, the CIEFR-HS investigated the conditions surrounding access to student subsidies, including tuition waivers, student subsidies, and fellowships. The 2019 survey expanded this list to cover household expenditure on full-time higher education as well. Given the diversity of the funding sources available to finance students in higher education, the survey focused on the total annual expenses of households for their children to attend college, including tuition fees, accommodation, and living costs. In addition to household expenditure related to children's education, CIEFR-HS data provided extensive background information about the surveyed households, including the members’ age, education level, marital status, location of household registration, household size and structure, annual household income, and total household expenditure.
Key findings
Index system for measuring household investment in education in China
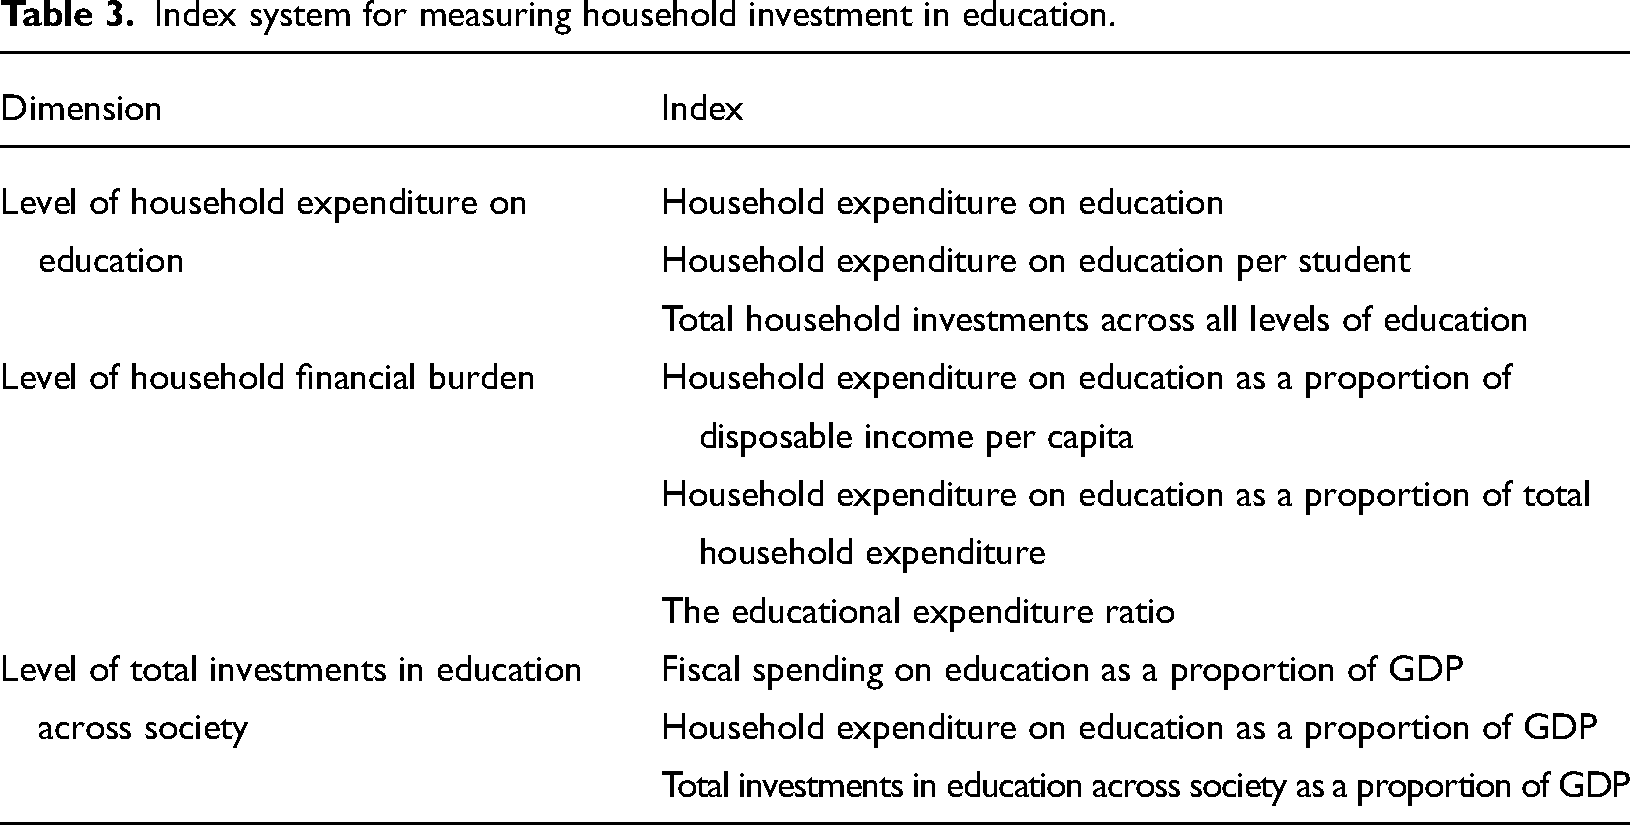
Based on CIEFR-HS data, this study constructed an index system to measure household investment in education in China comprising three dimensions: the level of household expenditure on education, the level of financial burden on households, and the level of total investments in education across society (Table 3).
Index system for measuring household investment in education.
First, in terms of the level of household expenditure on education, the average household expenditure on regular full-time education nationwide was RMB 11,297 during the academic year (AY) 2018–2019, with households spending an average of RMB 8,139 per child. The average expenditure on education was RMB 14,197 for urban households and RMB 8,205 for rural households. Overall, it costs a household around RMB 233,000 on average to educate a child from the beginning of their 3-year preschool education to the completion of undergraduate education. On average, households in the bottom 20% (in terms of annual household expenditure) spent approximately RMB 180,000, those in the middle 20% spent roughly RMB 224,000, and those in the top 20% spent around RMB 424,000.
Second, in terms of the financial burden of educational expenditure on households, household expenditure on education accounted for 40% of disposable income per capita nationwide, averaging 56.1% in rural areas and 36.2% in urban areas. Household expenditure on education per student took up 28.8% of disposable income per capita nationwide, averaging 37.5% and 28.1% in rural and urban areas, respectively. Compared to a national average of 14.9%, educational expenditure accounted for 15.8% and 14.1% of total household expenditure in rural and urban areas, respectively. Furthermore, in terms of the educational expenditure ratio, most middle- to low-expenditure households were found to spend a higher proportion of their income on children's education. 2
Third, in terms of the level of total investments in education across society, China's national fiscal expenditure on education was nearly RMB 3,699.6 billion in 2018, representing 4.11% of its GDP. Total household expenditure on all levels of regular full-time education nationwide was estimated at approximately RMB 2,163.2 billion, equivalent to 2.4% of the country's GDP or 58.47% of total fiscal expenditure on education. Based on these figures, total investments in all stages of regular full-time education nationwide were provisionally estimated to be RMB 6,187.9 billion—6.87% of the national GDP. 3
Associated financial burden
Household expenditure on education per student and proportion of total household expenditure by level of education.
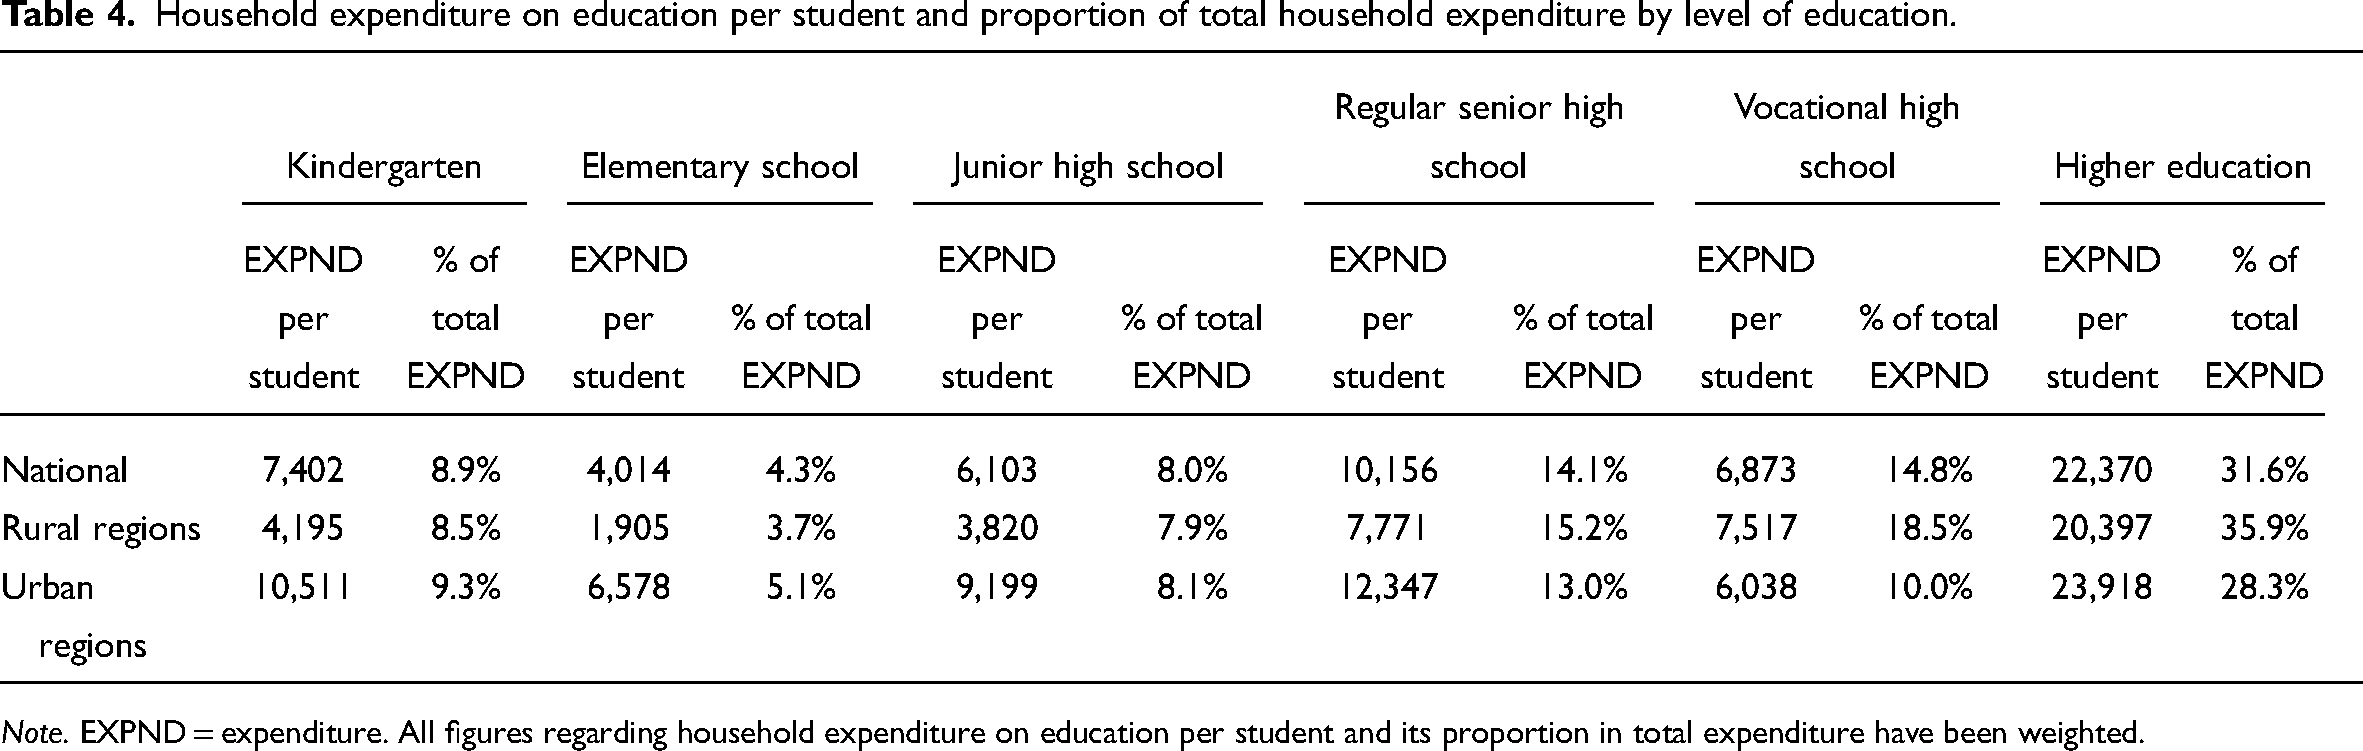
Note. EXPND = expenditure. All figures regarding household expenditure on education per student and its proportion in total expenditure have been weighted.
Household financial burden
Household financial burden refers to the proportion of total annual household expenditure on children's education. According to the 2019 survey data, the national average household expenditure on education was RMB 11,297 per year, representing 14.9% of total household expenditure. On average, households spent RMB 8,139 a year on each child's education, accounting for 10.8% of total household expenditure. In terms of the financial burden by level of education, compulsory education imposed the least burden on households at below 8% in rural and urban areas, followed by preschool education at roughly 10% for rural and urban households. In terms of non-compulsory education, the financial burden increased for senior high school education and exceeded 30% for higher education. Rural households were found to have spent 36% of their total expenditure on each child enrolled in higher education (Table 4).
Characteristics from preschool to higher education
In general, household expenditure on elementary and junior high school education—as compulsory education—largely fell within the mid-to-low expenditure category, with a sizable proportion of households spending less than RMB 1,000 on elementary education. In comparison, a smaller percentage of households spent less than RMB 1,000 on junior high school education; the proportions of households spending RMB 1,000–5,000 and more than RMB 10,000 were also higher at this stage. As such, a clear divide in household expenditure typically emerges when a child reaches compulsory junior high school education. Among the non-compulsory stages of education, household expenditure on preschool and senior high school education displayed traits of polarization, with a larger proportion of households with mid-to-low and high levels of expenditure and a smaller proportion of households in the low and mid-to-high expenditure categories. Among the pre-tertiary stages of education, household expenditure on preschool education was relatively higher than that on elementary and high school education. Meanwhile, for higher education, the proportion of households spending RMB 5,000–10,000 was significantly higher than that of households spending more than RMB 10,000. As Figure 1 shows, although Chinese households generally spent a larger amount of money on higher education compared to other levels of education, this difference was not substantial.
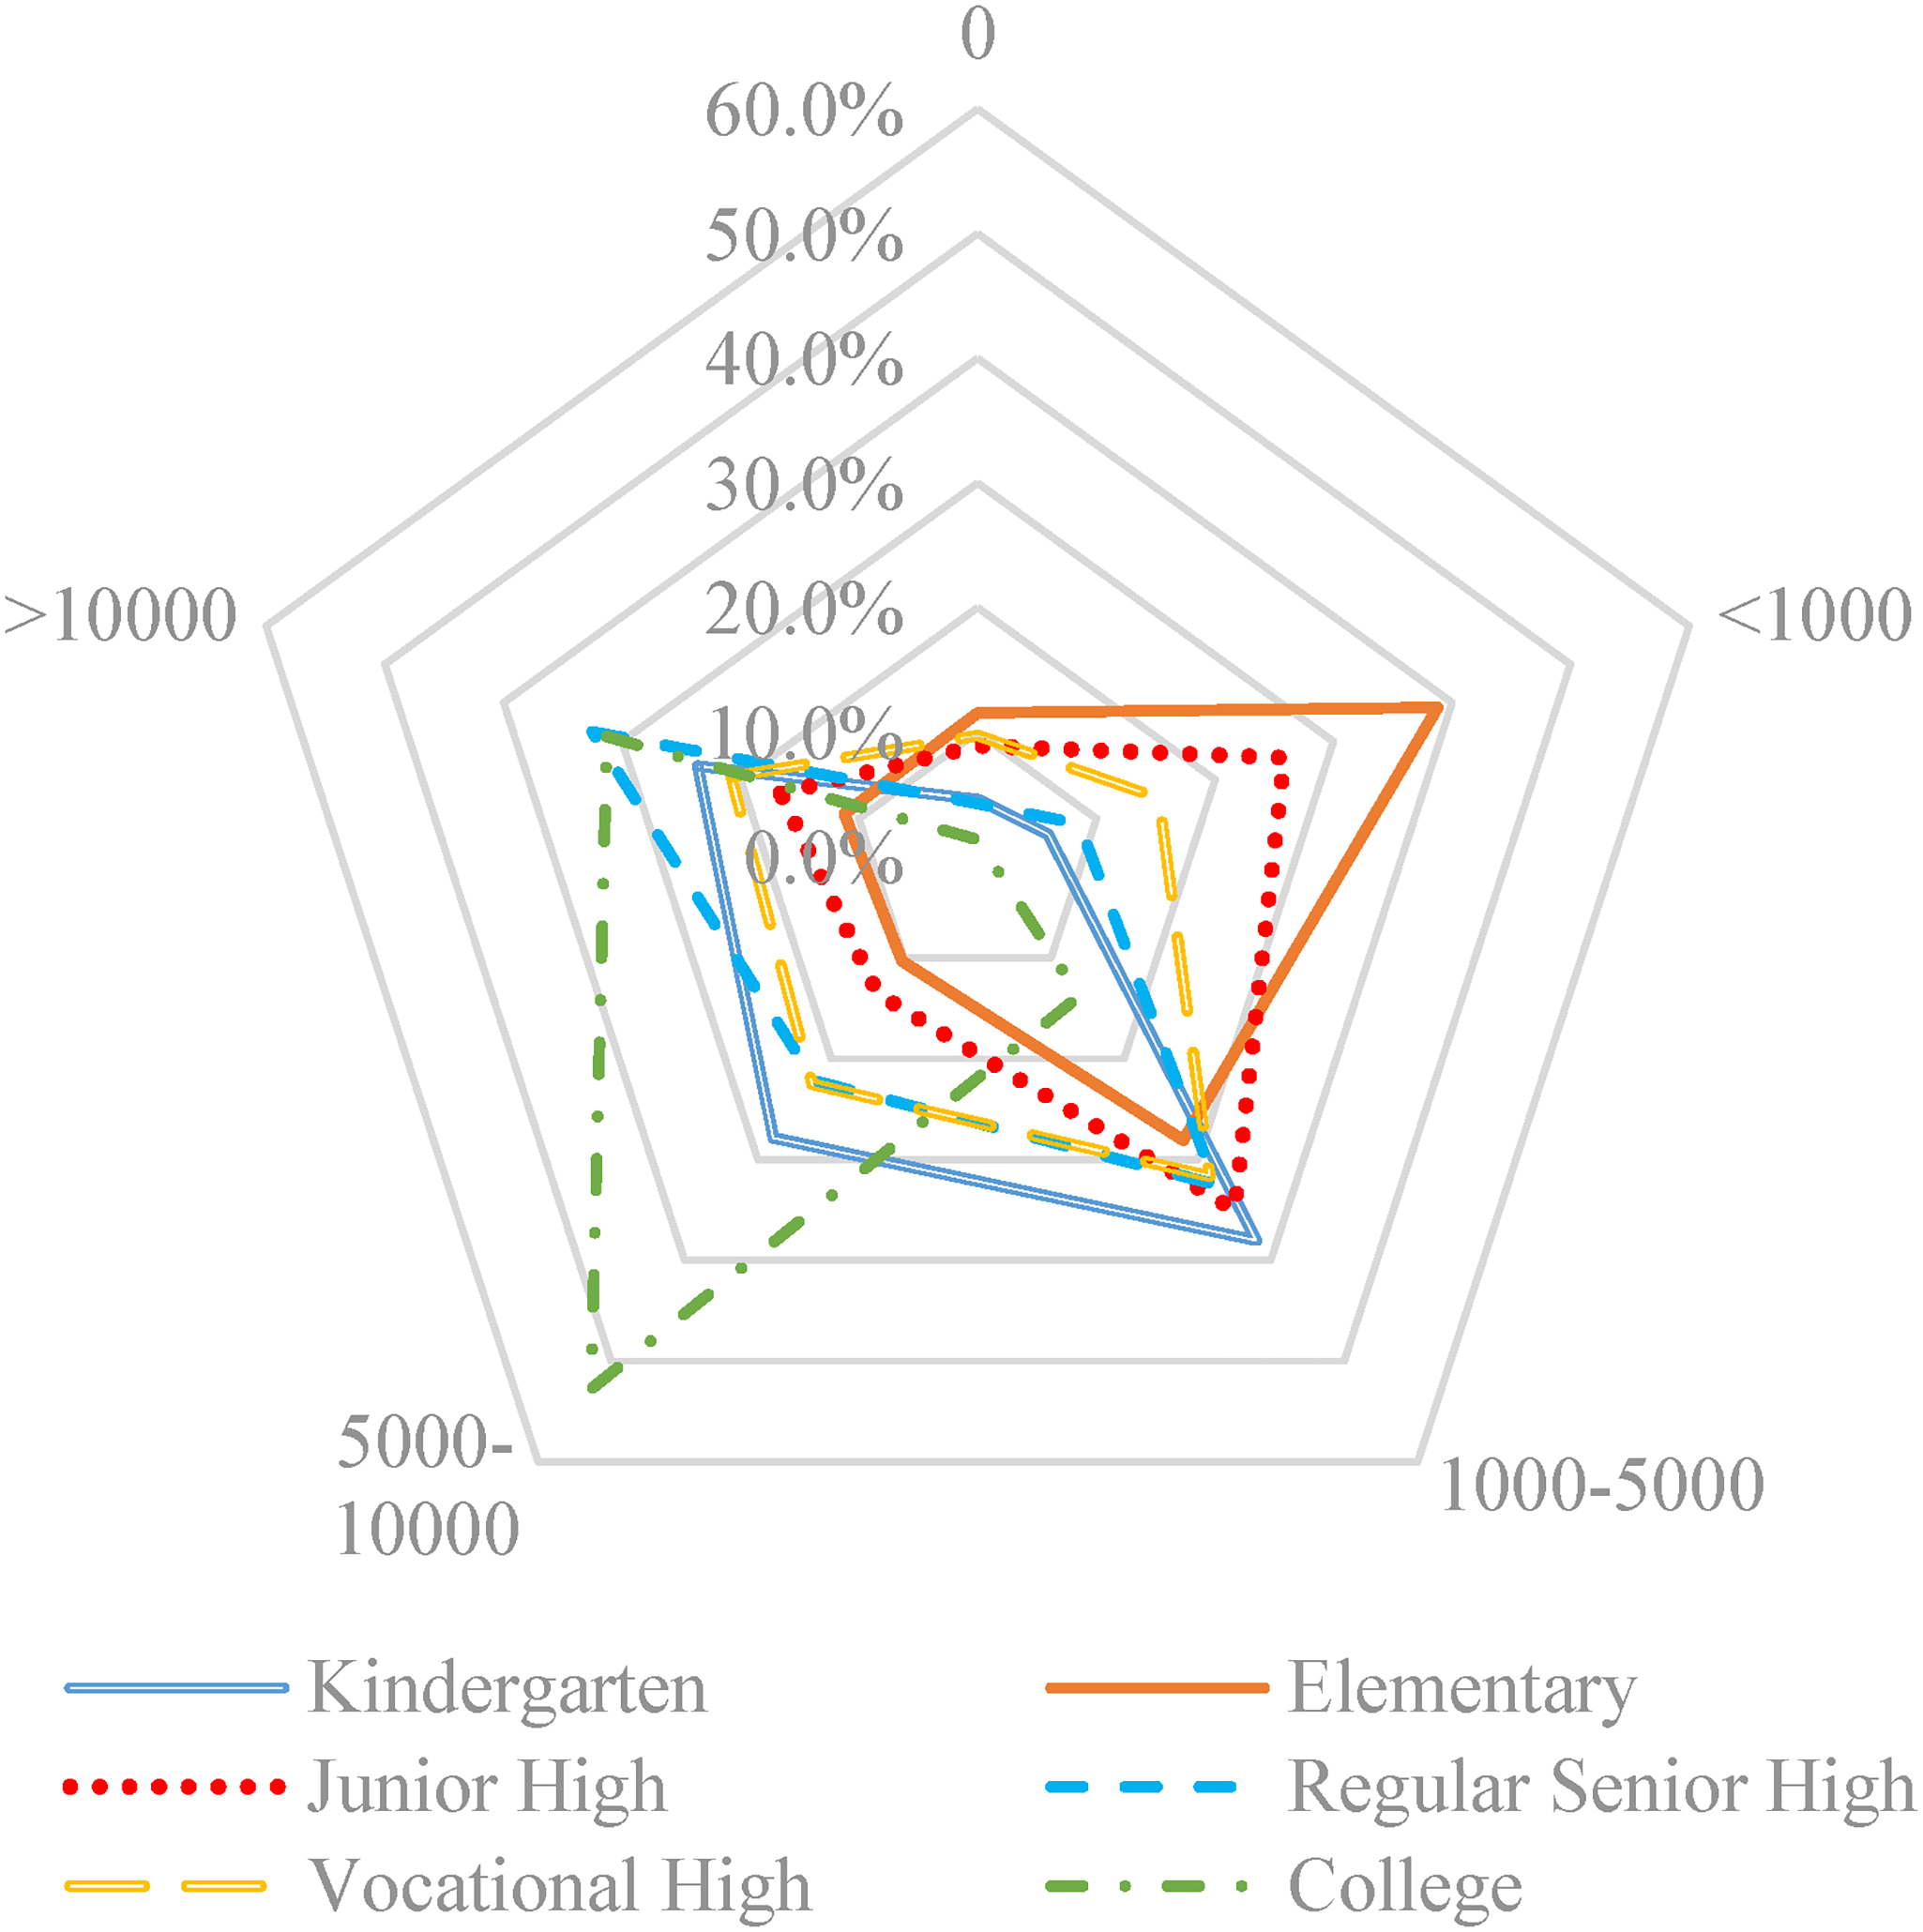
Distribution of household expenditure per student by stage of education in AY 2018–2019.
The characteristics of household expenditure on each level of education can be summarized as follows. First, at the preschool stage, as preschool education is not compulsory, average household expenditure on kindergarten tended to be higher than that on compulsory education among households having a similar income level. Expenditure on preschool education placed a heavier burden on low-income households, especially those in rural areas. Given the rural–urban disparities in the availability of kindergartens and market supply of early childhood education, rural households with different levels of household income exhibited a smaller gap in their expenditure on preschool education. Meanwhile, the prices of kindergartens and out-of-school early childhood education services for urban households vary according to households’ income and affordability.
Second, regarding expenditure on compulsory education, data indicate that households faced less financial burden and rural–urban disparities were smaller. The differences in expenditure among households with different income levels were smaller in rural areas and greater in urban areas. Given the relative abundance of out-of-school educational resources in urban areas, urban households generally spent more on out-of-school education than their rural counterparts, with mid- to high-income households spending more than half of their educational expenditure on out-of-school education. This was the primary reason for the disparities in educational expenditure between rural and urban households and households with different levels of income.
Third, at the senior high school stage, rural and urban households spent more on education than on compulsory education. Low-income households face a heavier financial burden, with those in rural areas spending up to 30% of total household expenditure on each child enrolled in high school. Both in- and out-of-school household expenditure on regular senior high school education gradually increased with household income. Household expenditure did not follow the same trend of polarization between high-income households and other groups as observed in the case of compulsory education.
Fourth, at the higher education stage, households reported higher levels of educational expenditure, with low-income households facing heavier financial burden. As the pricing of higher education is subject to regulation, disparities between rural and urban households and across regions has not widened significantly. However, the burden of education on households displayed greater rural–urban and regional differences than that at other stages of education. Moreover, as China's higher education system is classified into distinct tiers, colleges listed in the C9 League, Project 985, and Double First-Class University Plan had a disproportionally higher percentage of students from more affluent family backgrounds compared to the general population. Therefore, although households with children enrolled in these institutions spent more on education, they faced less of an educational burden than those with children enrolled in other colleges.
Educational opportunities for preschool and senior high school admissions
Educational opportunities for preschool
According to the analysis of 2019 CIEFR-HS data, the gross enrollment ratio in kindergartens was 83.6%, similar to the official figure of 83.4%. The national net enrollment ratio for children aged 3–6 was 68.5%. In terms of the type of institution, kindergartens can be divided into two categories. The first category comprises public and private kindergartens, while the second category is subdivided according to the affiliation of the kindergarten and the nature of service providers. The second category mainly included kindergartens affiliated with universities or government agencies, local community kindergartens, village and township kindergartens, kindergartens affiliated with elementary schools, and inclusive private kindergartens. In terms of the first category, the proportion of children enrolled in private kindergartens gradually increased with the level of household income, while that of children enrolled in public kindergartens steadily decreased. In terms of the second category, children from an advantaged family background were more likely to be admitted to kindergartens affiliated with government agencies and public institutions, which are often kindergartens of better educational quality.
Educational opportunities for senior high school
The national gross enrollment ratio among the school-age population for senior high school education, defined as children aged 16–18, was 89.1% in 2019. From a rural–urban perspective, the ratio was 95.7% and 79.4% in urban and rural areas, respectively. In terms of region, eastern China had the highest gross enrollment ratio at 90.1%. This study estimated the proportions of students enrolled in regular senior high schools and vocational high schools in rural and urban areas as well as different regions, using the full sample of students enrolled in senior high schools in the 2019 CIEFR-HS. Results showed that regular senior high schools accounted for 71.7% and 77.7% of senior high school student enrollment in rural and urban areas, respectively. Across various regions, northeastern China had the highest proportion of regular senior high schools (81.7%), followed by western (77.9%) and central China (74.6%). Meanwhile, eastern China had the lowest proportion (72%) of regular senior high schools.
Further analysis revealed that opportunities for senior high school were stratified by students’ academic performance and household economic conditions. First, families with higher levels of income and parental income tended to enjoy greater educational opportunities in terms of access to key regular high schools with the highest teaching quality and university enrollment. Second, families unable to enroll children in key general high schools and ordinary regular high schools tended to send their children to private high schools. Third, students who could not seek admission in regular high schools due to poor academic performance and whose families lacked the financial means to send them to private institutions turned to vocational high schools instead.
Out-of-school supplementary tutoring and on-campus after-school services
Participation in out-of-school supplementary tutoring
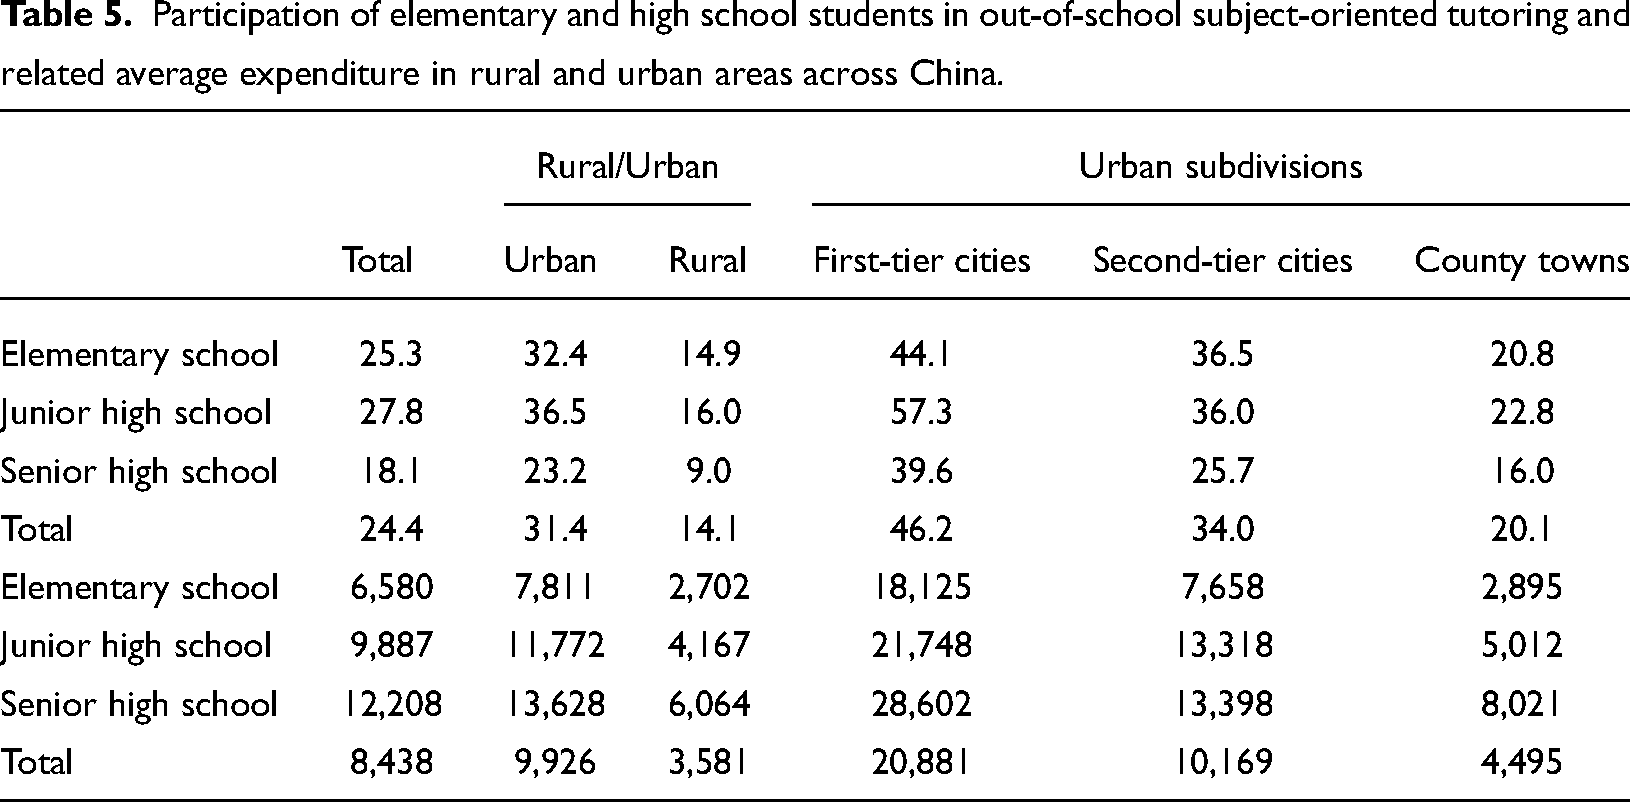
Participation of elementary and high school students in out-of-school subject-oriented tutoring and related average expenditure in rural and urban areas across China.
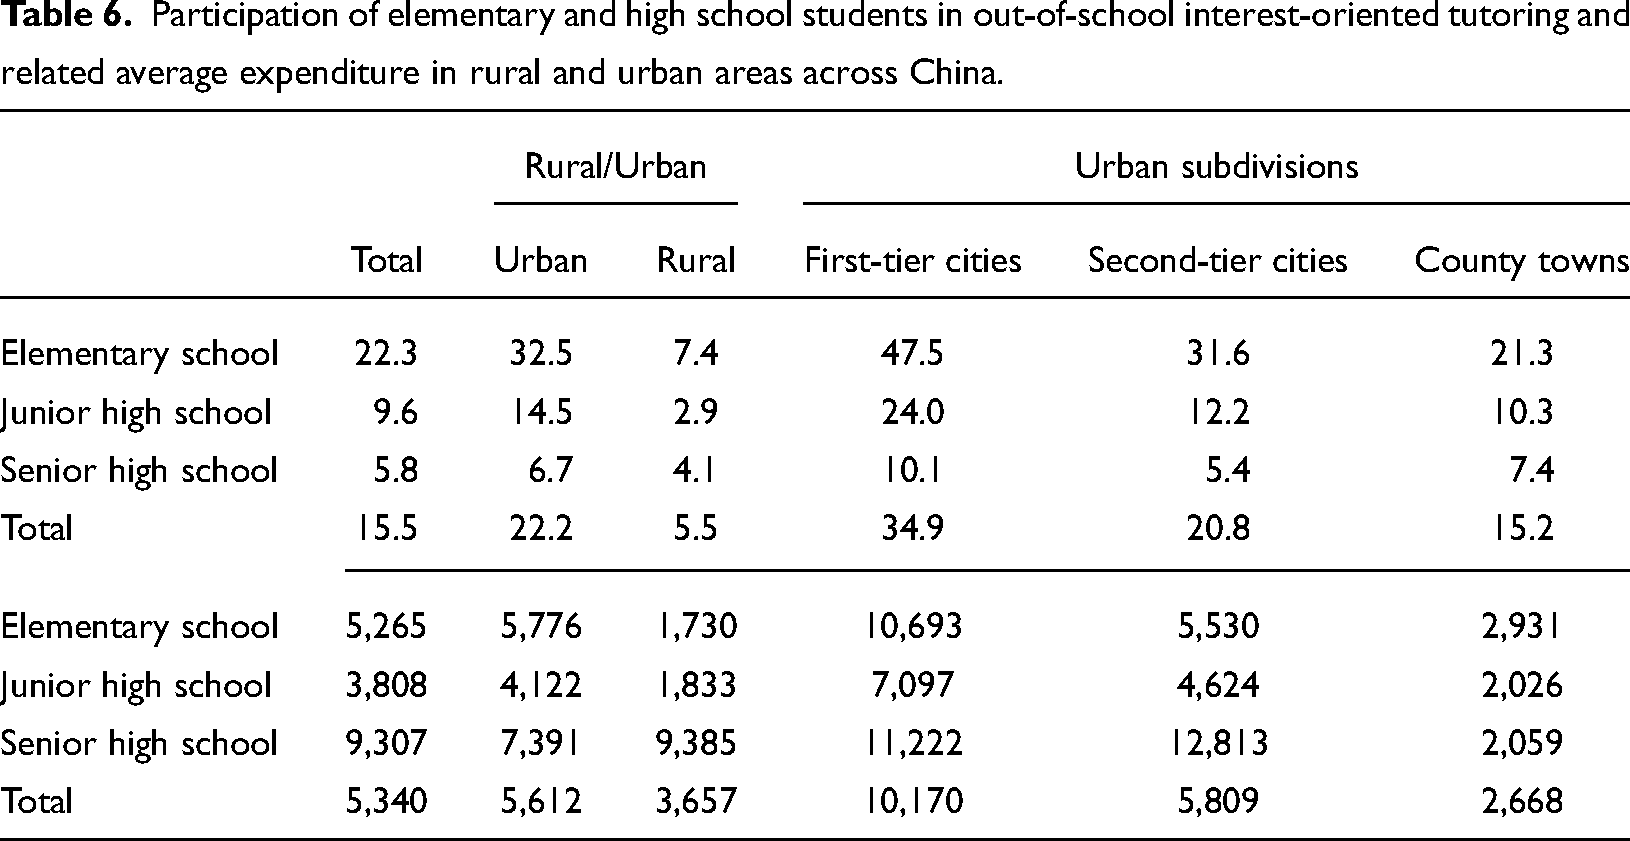
Participation of elementary and high school students in out-of-school interest-oriented tutoring and related average expenditure in rural and urban areas across China.
Providers of out-of-school subject-oriented tutoring
This study focused on two main types of providers of out-of-school subject-oriented tutoring—commercial organizations and individuals. Among students who participated in such training, 26.6% were involved in tutoring provided by commercial organizations, while more than 70% primarily engaged in tutoring provided by individuals. In rural areas, the proportions of students who participated in organization- and individually-provided tutoring were 8.1% and 87.6%, respectively; in urban areas, these ratios were 32% and 65.7%, respectively. Since 2018, the governance and regulation of out-of-school tutoring institutions have largely targeted commercial organizations, with subject-oriented tutoring provided by individuals being relatively unregulated.
Analysis of data from the household survey revealed that in-service teachers continued to offer their students out-of-school tutoring, the extent of which varied from one region to another. The proportion of students receiving tutoring from their teachers was the highest among senior high school students, followed by junior high school and elementary students. From a regional perspective, the proportion was higher in rural areas than in urban areas, lower in first-tier cities than in second-tier cities and county towns, and similar in county towns and rural areas on average. In terms of the provision of tutoring by in-service teachers and the regional distribution of educational institutions, in regions with a low degree of marketization of tutoring services, in-service teachers may be the most accessible option for parents and students to satisfy their needs for out-of-school tutoring.
Availability of on-campus after-school services
The analysis of the valid responses of elementary and high school students to questions related to on-campus after-school services in the 2019 CIEFR-HS revealed the following. First, although approximately 36% of elementary and high schools offered at least one type of after-school service, less than 6% of all elementary and high schools provided after-school care services (kehou tuoguan). Second, among student groups who received after-school services, the total expenditure on such services averaged RMB 1,018 per year. As a result of limited financial resources, a higher proportion of schools in rural areas and less economically developed regions charged students for after-school care and extra tutoring services. Conversely, there were a greater number of schools able to provide free after-school services in more economically developed regions. Third, in addition to having greater economic flexibility in choosing out-of-school tutoring services available in the market, children from economically advantaged households typically attended schools able to provide a greater variety of basic and extended after-school services. In general, the on-campus after-school services available to students with different household income levels and parental educational levels indicate that the schools attended by children from more economically advantaged family backgrounds typically provide more basic care services and a wider selection of after-school activities.
Enrollment in private schools at the basic education level
Regional disparities in private education enrollment
According to the analysis of the 2019 CIEFR-HS, the national average proportions of students attending private kindergartens, elementary schools, junior high schools, and regular senior high schools were 58.2%, 10.1%, 12.9%, and 12.8%, respectively, close to the statistics published in the 2019 Statistical Bulletin on National Education Development.
The patterns in private education enrollments varied across regions, between rural and urban areas, and among urban subdivisions. First, the 29 province-level divisions covered in the 2019 CIEFR-HS were divided into four regions, namely, eastern, northeastern, central, and western China. Among them, central China had the highest proportions of enrollments in private schools across all stages of basic education, whereas western China had the lowest for most of the stages (except for regular senior high school). More specifically, in central China, 70.8% of kindergarten, 14% of elementary, 16.8% of junior high school, and 19.2% of regular senior high school enrollments were in private schools. Eastern China had a similar proportion of private enrollments to those of central China, except for preschool education. Enrollment proportions in northeastern China were similar to those in western China.
Second, the rural–urban divide in enrollment in private schools was less pronounced than that across regions and urban subdivisions. There was little urban–rural variation in enrollment in private preschools and junior high schools, while slightly higher proportions of variation in enrollment in private regular senior high schools in urban areas than in rural areas. The main rural–urban difference was observed in elementary school enrollment. Proportions of students enrolled in private schools accounted for 13% in rural areas and 6.6% in urban areas (Figure 2).
Regional comparison of the proportion of students enrolled in private schools.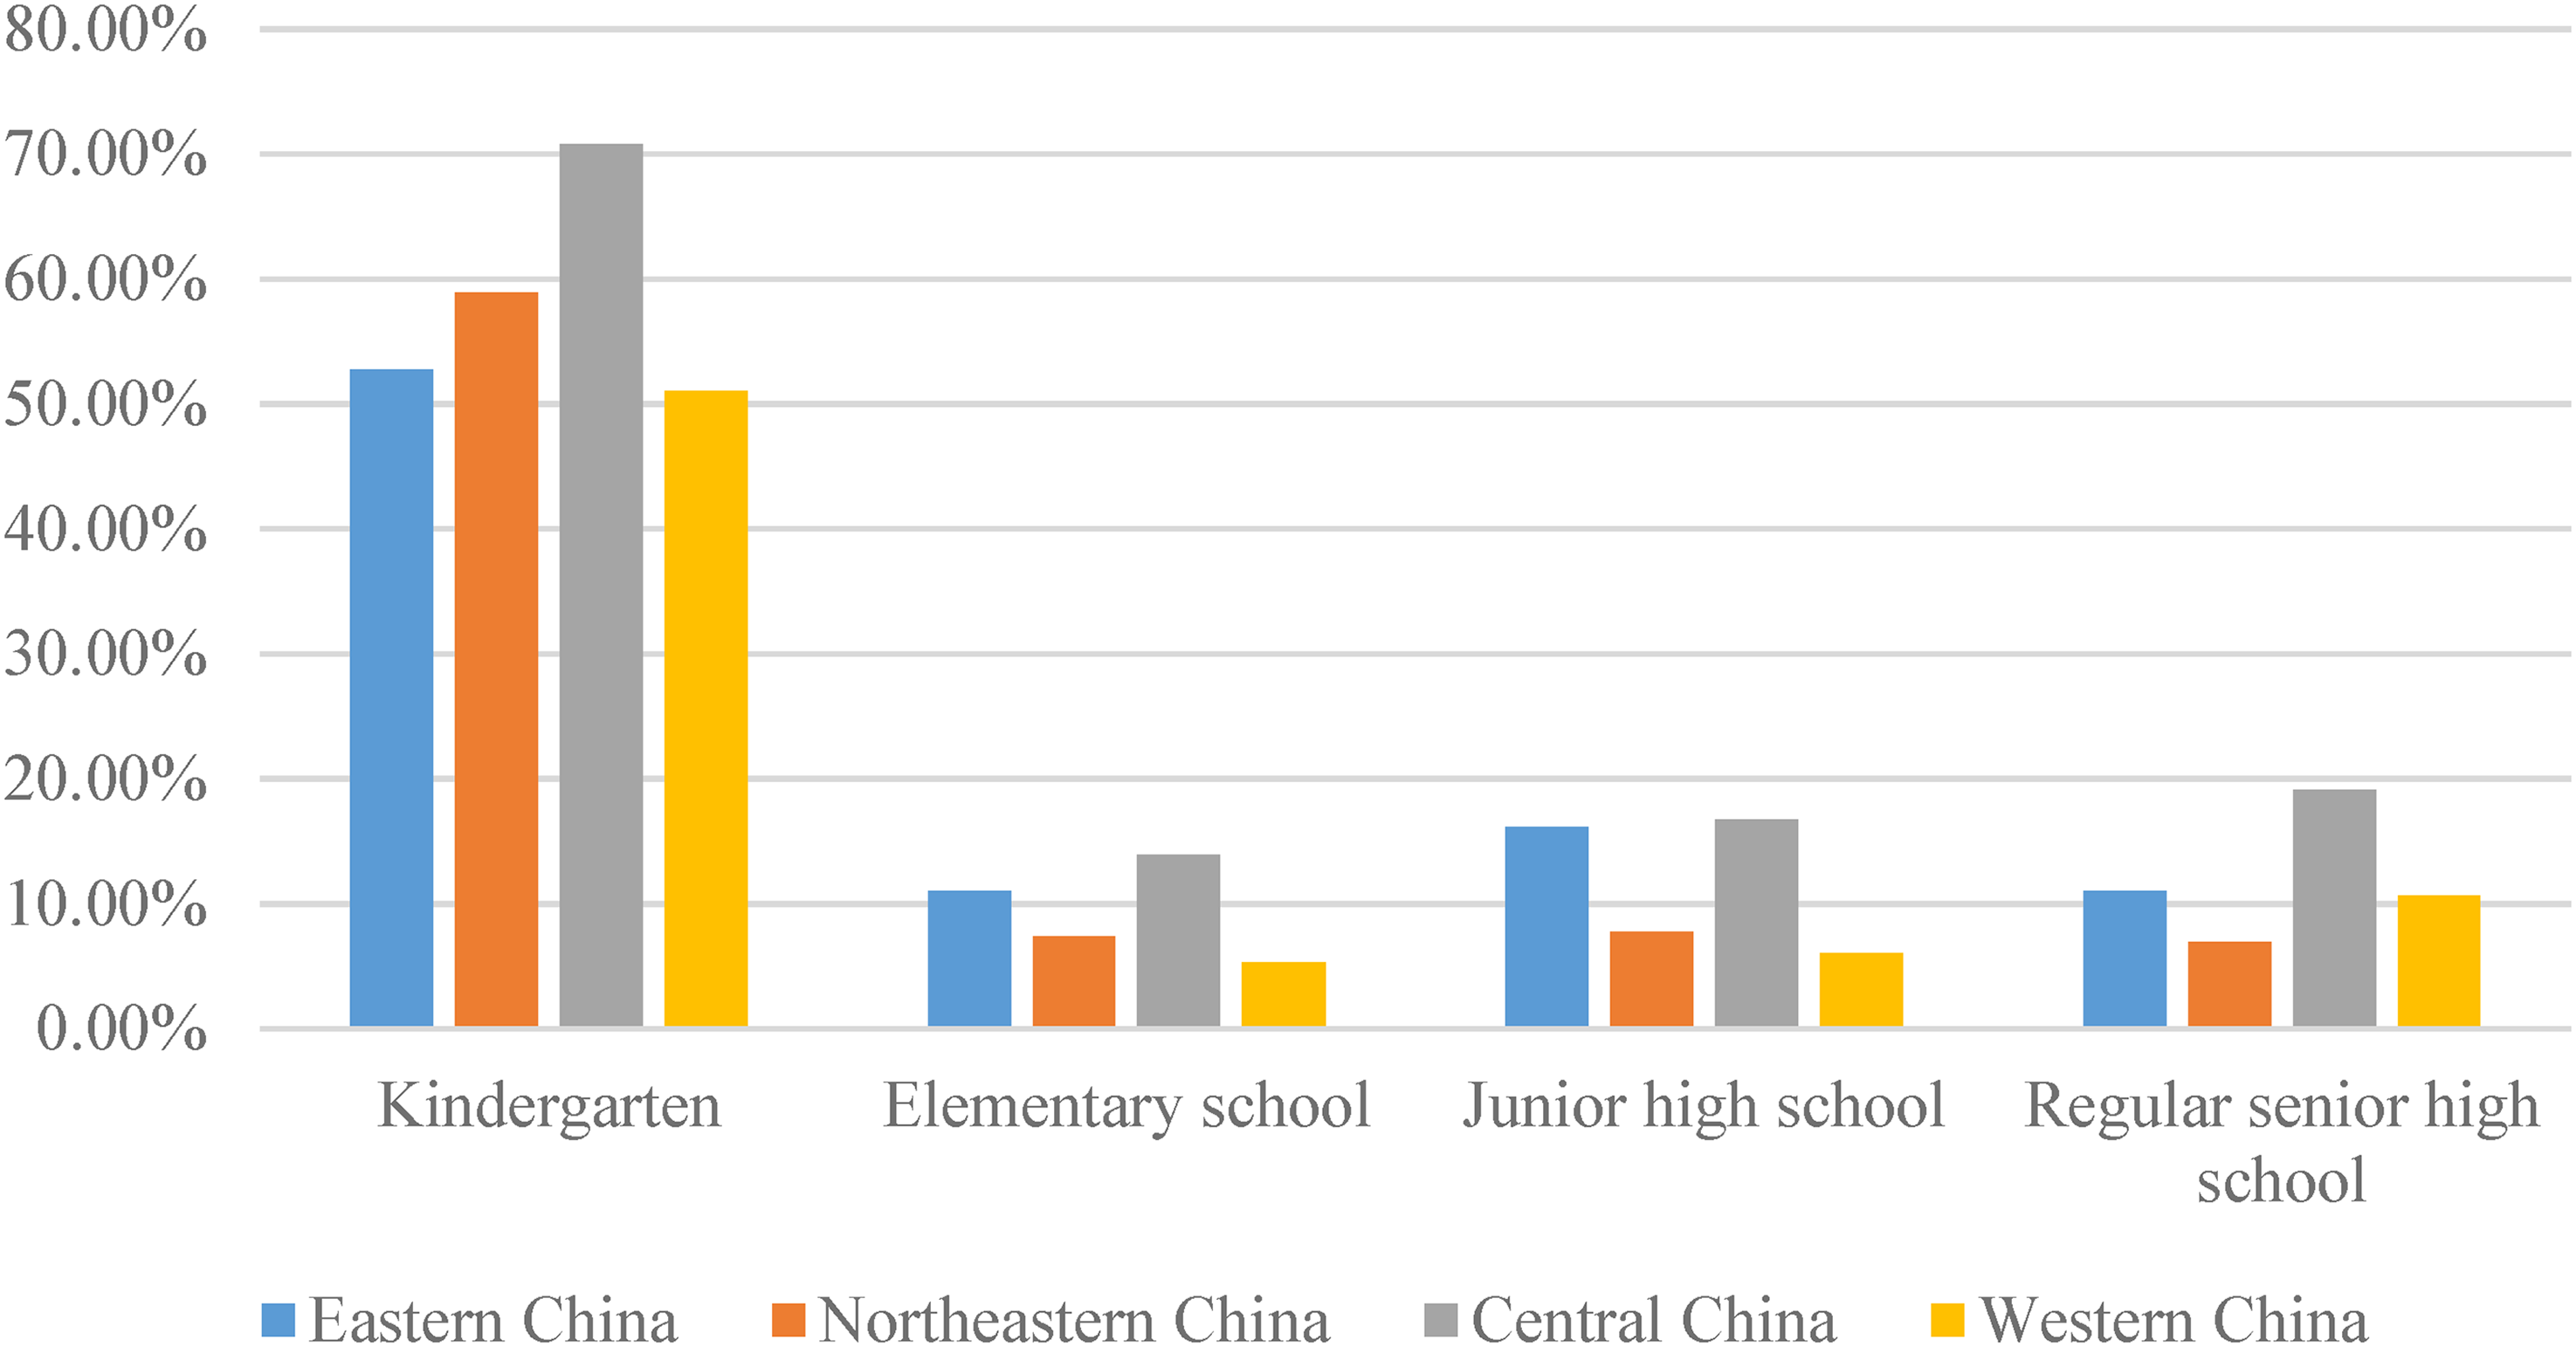
Third, as Figure 3 illustrates, there were greater internal differences across cities than between rural and urban areas. As the level of economic development improved, the proportions of students enrolled in private kindergartens and senior high schools declined, while the proportions of those enrolled in privately-run elementary and junior high schools increased. Overall, more developed urban areas saw a relatively higher proportion of private enrollments at the stage of compulsory education, with this trend reversed for preschool and senior high school education.
Comparison of the proportions of students enrolled in private schools in urban subdivisions and rural areas.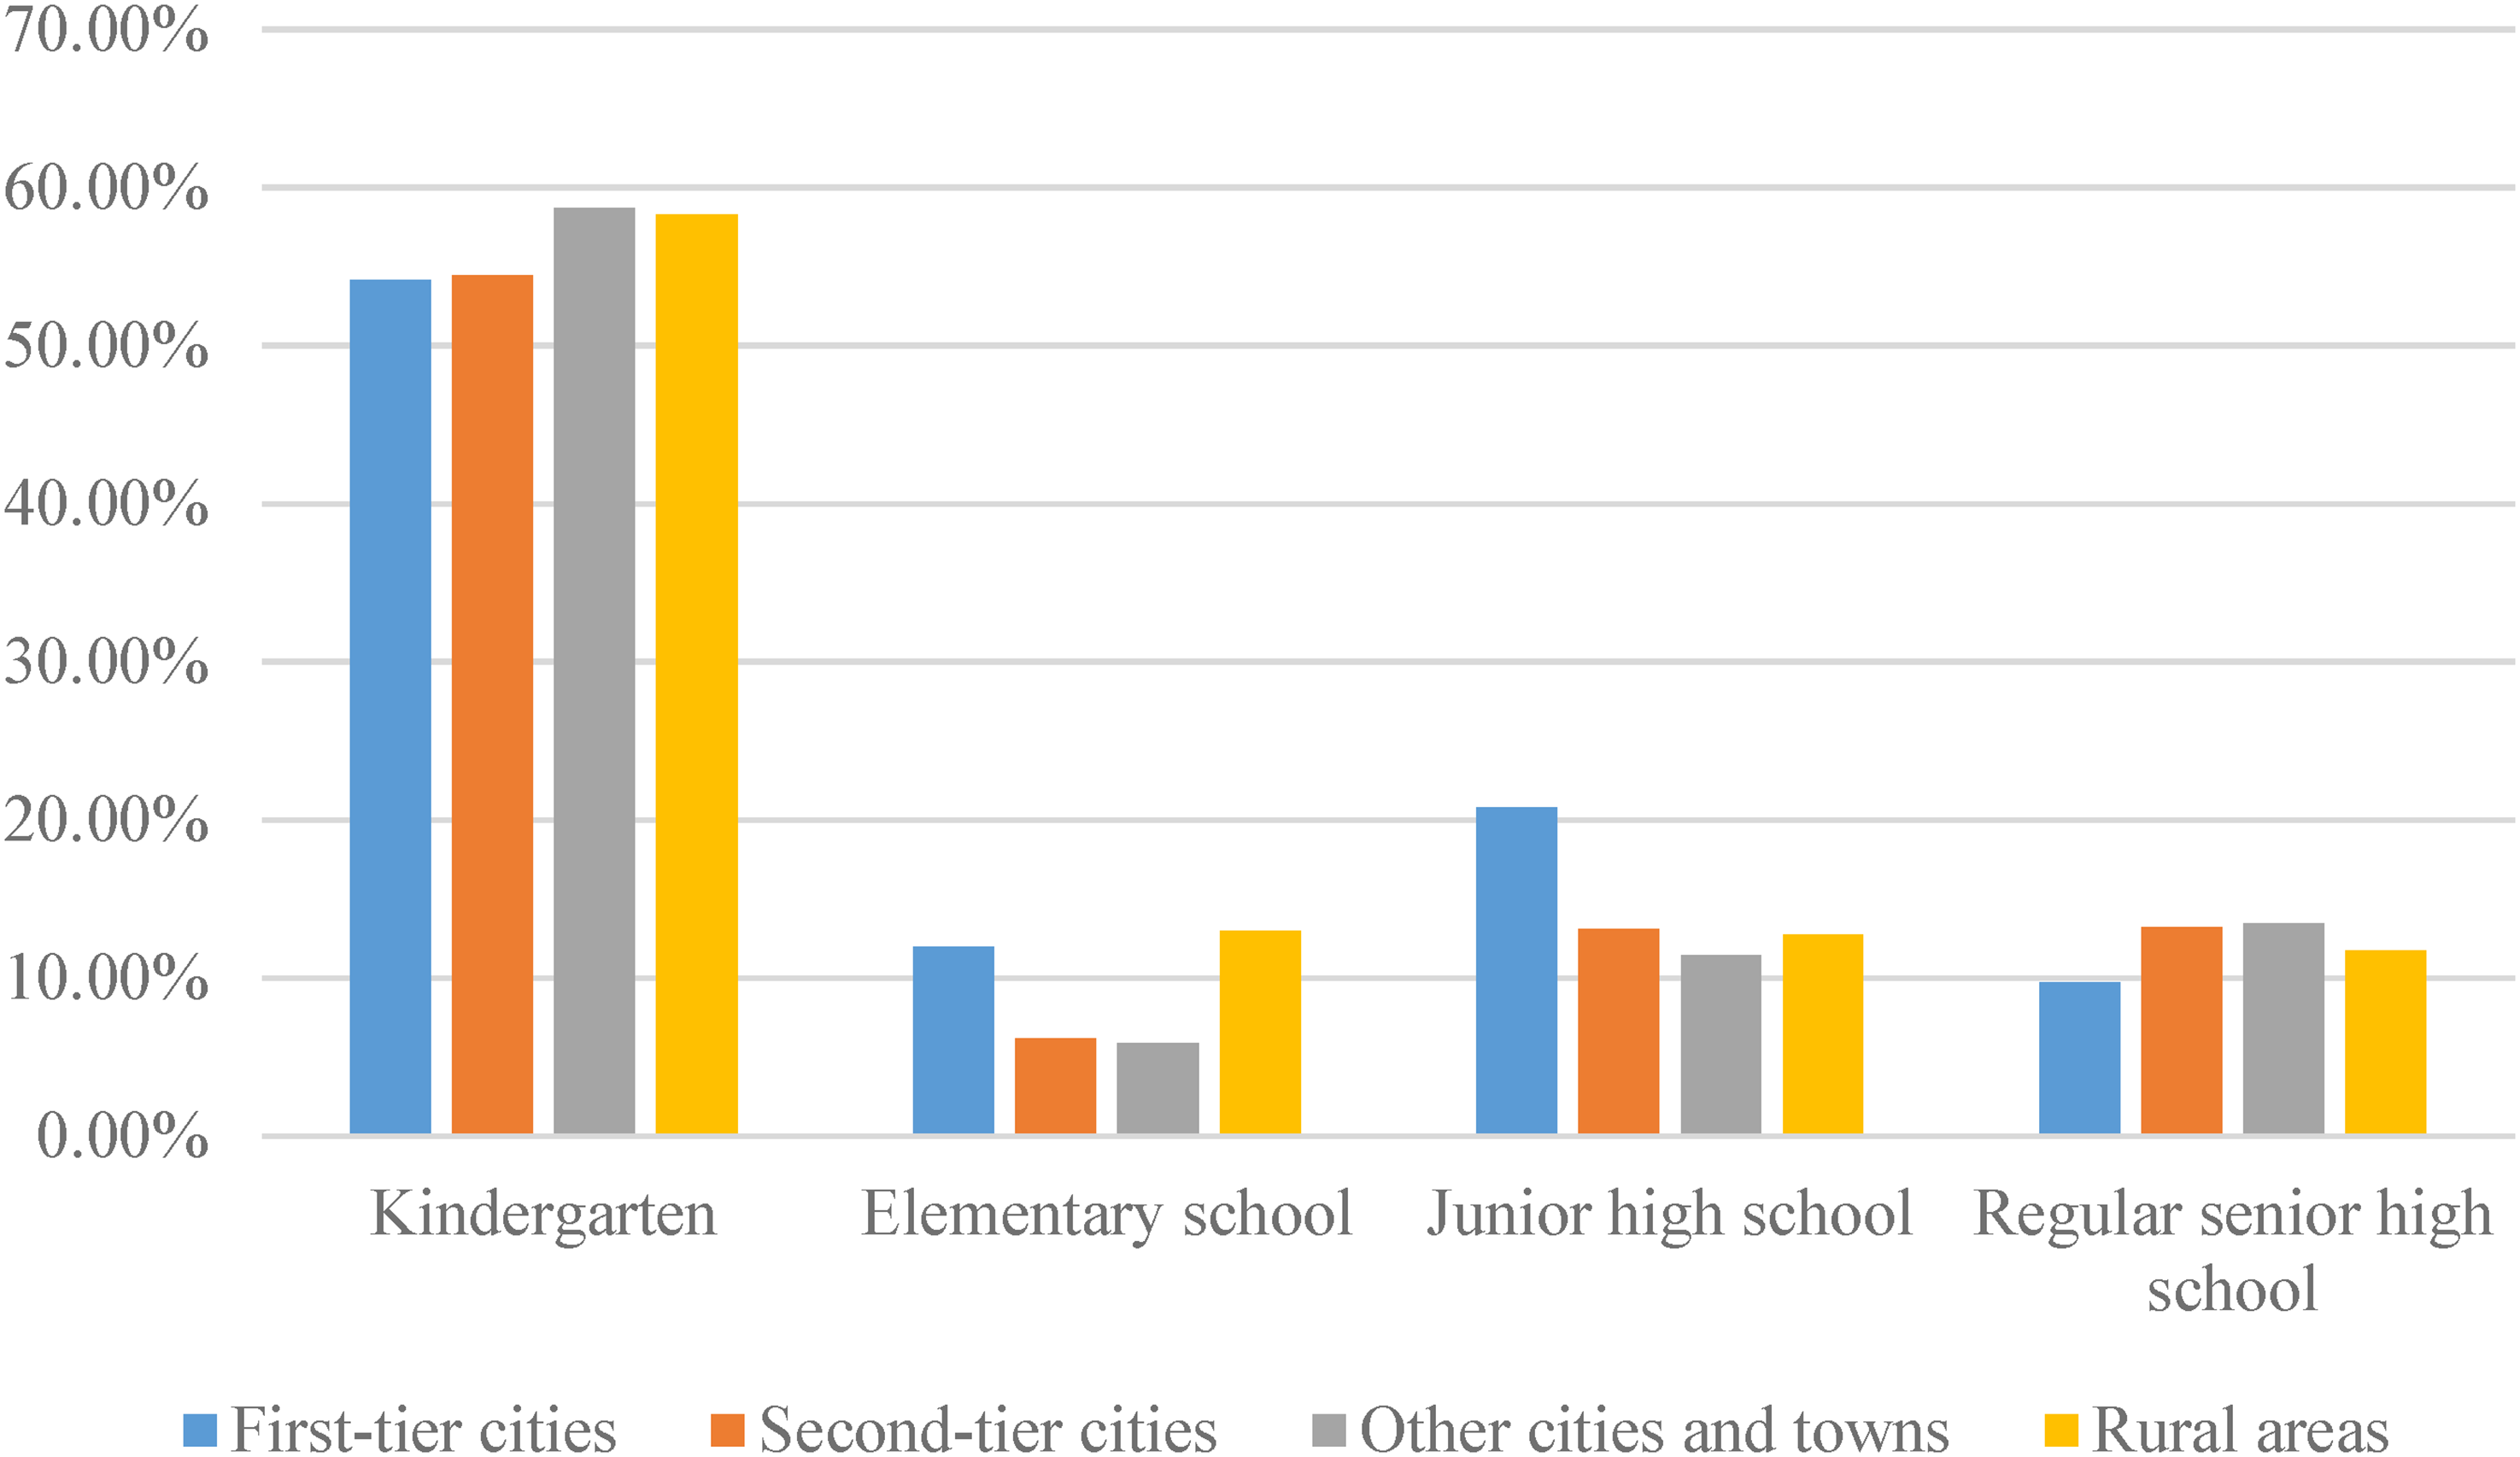
Internal structural differences among private institutions
In addition to regional disparities, there were significant internal differences among private schools, with high-quality schools charging tens of thousands of RMB coexisting with low-quality schools charging only a few hundred RMB. The functions of these schools varied across different education levels.
In the preschool education stage, private kindergartens emerged to satisfy the educational needs that public institutions could not provide. In this respect, the government implemented various measures to reduce costs and promote the development of inclusive private kindergartens. Nonetheless, expensive private kindergartens are available to satisfy the differentiated educational needs of high-income households.
In the compulsory education stage, the role of private schools shows a polarized trend. On the one hand, some private schools exist to meet the differentiated educational needs of high-income households. For these households and students, although attending a private school requires higher educational expenditure, doing so ensures that students receive high-quality and diversified education that can meet their specific needs. On the other hand, certain private schools have emerged to satisfy the needs of households that cannot meet the application requirements of local public schools (migrant children).
In the senior high school education stage, the positioning of private schools differed with the level of economic development. In first-tier cities, private institutions can be divided into two groups: those positioned to satisfy the needs of households that public schools cannot meet, and those addressing the differentiated needs of higher-income households. In second-tier cities, other counties and cities, and rural areas, the limited financial resources of the local governments have resulted in some public senior high schools providing lower-quality education, creating space for the emergence of private institutions delivering higher-quality education.
Public education investment and policy influences
The role of public investment in narrowing educational resource gaps
This study matched 2019 CIEFR-HS data on compulsory school enrollment with data on school funding to examine household expenditure on education and school investments among the sampled students. Furthermore, this study analyzed the allocation of public education investment among different household income groups. As Figure 4 shows, after considering government budgetary spending, disparities in the total education investment allocated to students from different income groups in public schools were found to have narrowed significantly.
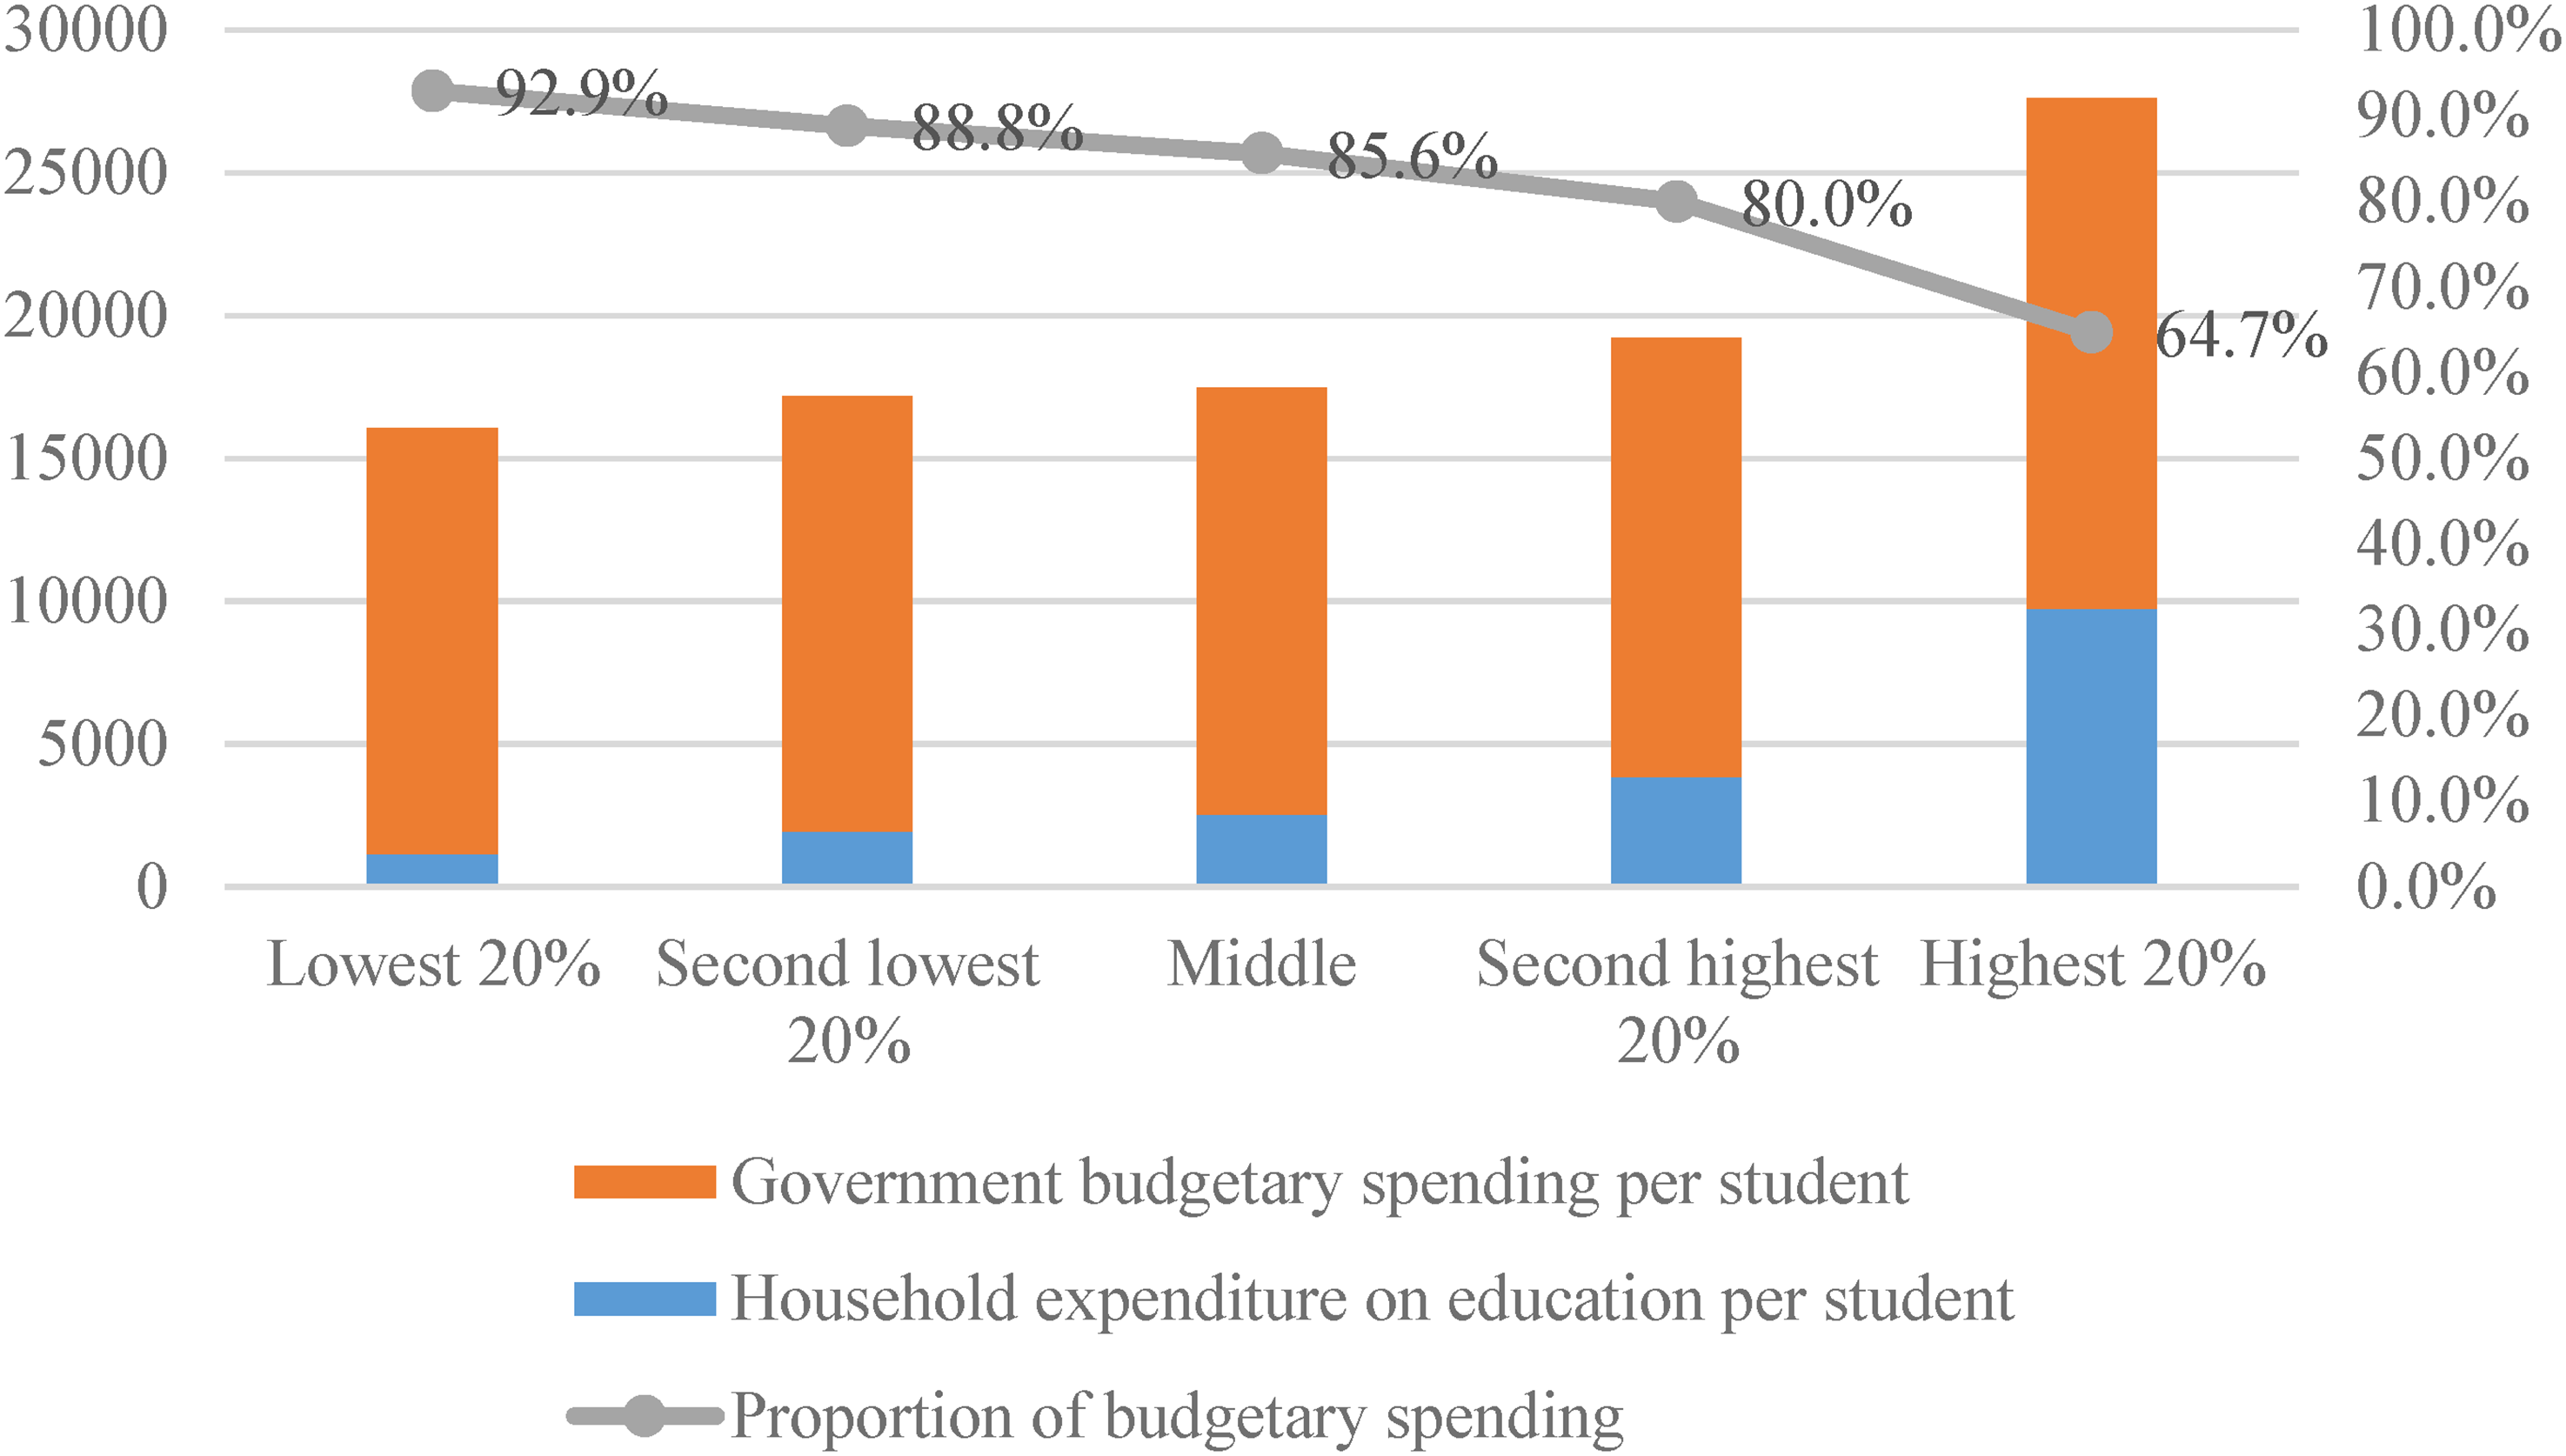
Total education investment per student in public compulsory schools in 2019 by household income (RMB/year).
In 2019, overall education funding per student for public compulsory education institutions in rural and urban areas increased sharply compared to 2017. In rural areas, per-student education funding for schools attended by children from low-income households increased more substantially compared to that for children in the highest-income group. In general, years of fiscal emphasis on public investments in compulsory education and rural schools has significantly shrunk disparities in school funding across regions, between rural and urban areas, and among income groups.
Decrease in household expenditure on compulsory education
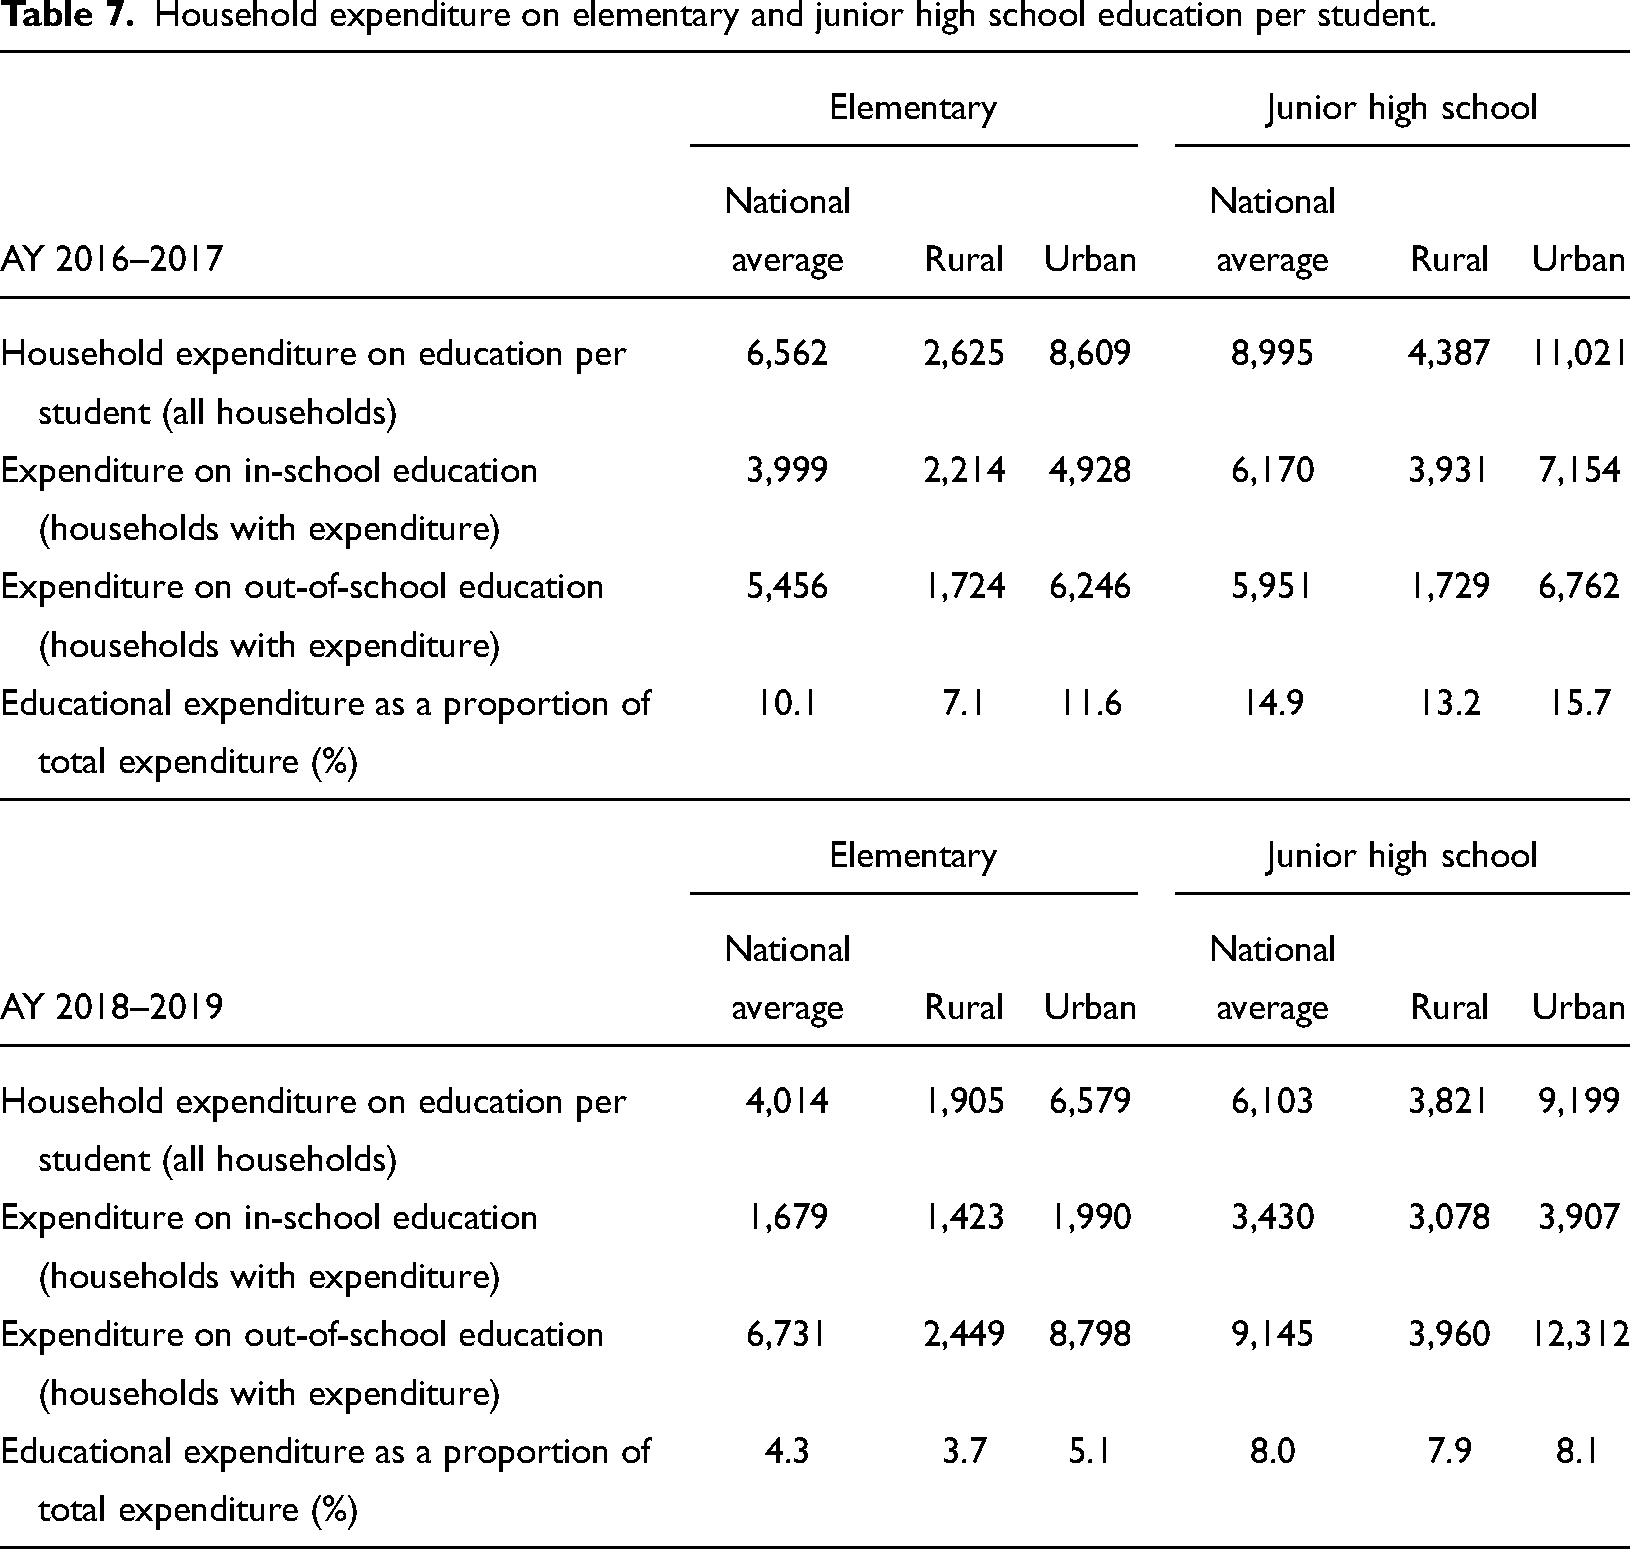
Based on data from the 2017 and 2019 CIEFR-HS, this study analyzed changes in the level and structure of household expenditure on compulsory education and its associated burden from 2017 to 2019. As Table 7 shows, compared to 2017, household expenditure on in- and out-of-school education at the compulsory education level decreased in 2019, as did the financial burden of education on households. This decline in expenditure is due to several factors, including reductions in the variety and amount of fees charged by schools and lower participation rates in out-of-school tutoring. Notably, the decline in participation rates was more pronounced among students from rural areas and low-income households. Moreover, rural–urban and inter-household disparities in out-of-school educational resources had widened, and high-income households were more inclined to opt for private compulsory education institutions. Meanwhile, private schools were polarized among themselves, with expensive private schools coexisting with relatively low-cost ones.
Household expenditure on elementary and junior high school education per student.
Government regulation on out-of-school supplementary tutoring
In late December 2018, nine government departments, including the Ministry of Education (MOE), jointly printed and distributed The Measures to Reduce the Burden on Elementary and High School Students. 4 Presenting the government's official regulations and recommendations on how to alleviate the academic burden on students, this policy document covered a range of issues, from the operational practices and management of out-of-school tutoring institutions to households’ educational responsibilities. Drawing on 2017 and 2019 CIEFR-HS panel data, this study analyzed changes in participation rates in out-of-school subject- and interest-oriented tutoring and household expenditure on out-of-school tutoring among elementary and high school students during the survey period. Table 8 presents the description of household expenditure and participation in out-of-school tutoring among elementary and high school students in the 2017 and 2019 samples.
Household expenditure and participation in out-of-school tutoring among elementary and high school students in the 2017 and 2019 samples.
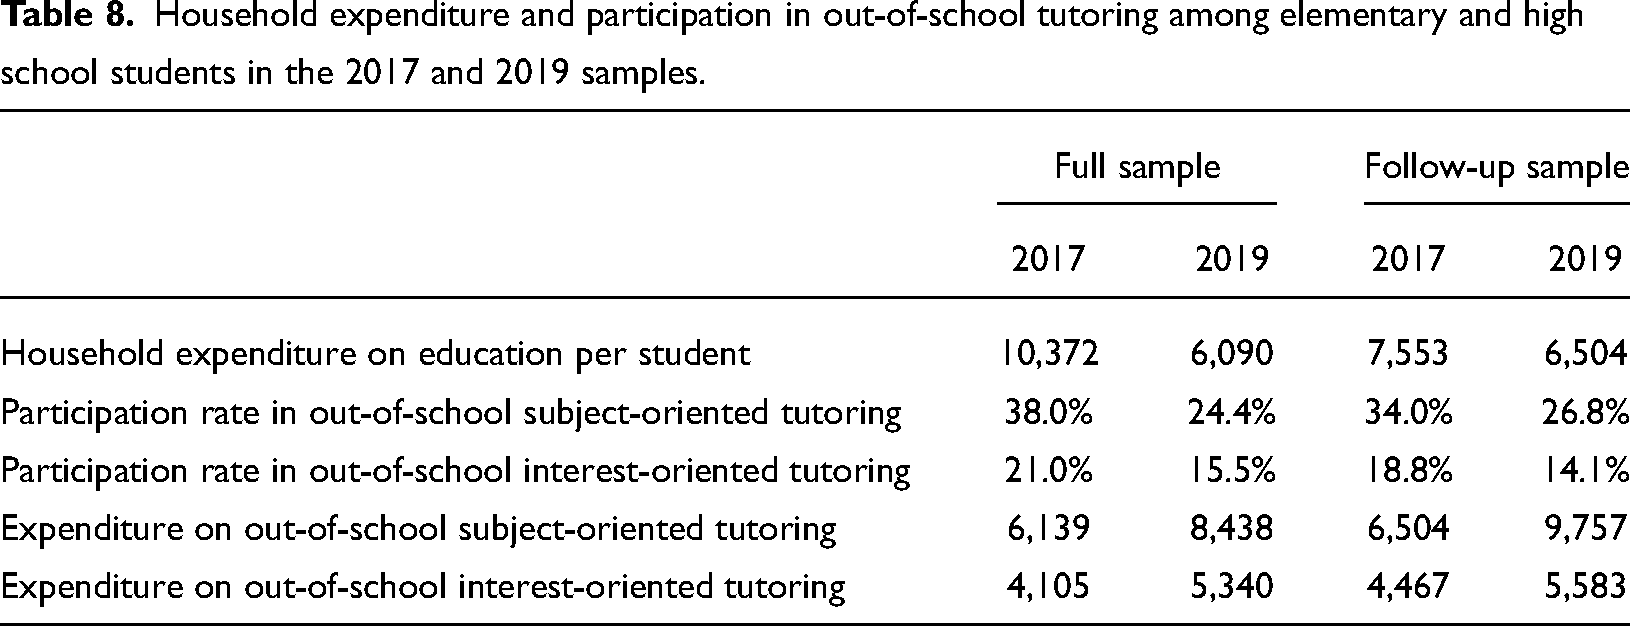
Further analysis revealed the following. First, participation rates in out-of-school tutoring narrowed among elementary and high school students in 2019, while disparities between rural and urban households, high- and low-income households, and households with different education levels widened. Second, compared to 2017, 2019 saw a decrease in total household expenditure on education per student but an increase in average expenditure on out-of-school tutoring. Third, while engagement in out-of-school subject-oriented tutoring was primarily influenced by students’ needs to pursue further education, participation in out-of-school interest-oriented tutoring was not significantly driven by the demand for further education and was not considerably affected by government regulation of the out-of-school tutoring market. Fourth, in addition to the decline in participation in out-of-school tutoring, attention should be given to the trends of polarization displayed in out-of-school investments among different groups. Students from households with more economic and socio-cultural resources were more likely to participate in out-of-school tutoring, and their household investments were found to increase consistently over this period.
Discussion and conclusion
Using nationally representative data from 2019 CIEFR-HS, this study analyzed the level and structure of household expenditure on children's education, the associated disparities, and financial burden on a national, urban–rural, and regional scale and across cities at different levels of development. The main findings can be summarized as follows.
First, regarding the level, structure, and burden of household expenditure on children's education, the average household spent RMB 11,297 on regular full-time education in AY 2018–2019, with approximately RMB 8,139 per child—accounting for 14.9% and 10.8% of total household expenditure, respectively. Overall, it costs a household approximately RMB 233,000 on average to educate a child from the beginning of their 3-year preschool education to the completion of undergraduate education. The total investments in all stages of regular full-time education nationwide were provisionally estimated to be RMB 6.2 billion—6.87% of the national GDP.
Second, regarding the participation of elementary and high school students in out-of-school supplementary tutoring and related household expenditures, on average, 24.4% of elementary and high school students participated in out-of-school subject-oriented tutoring in AY 2018–2019, with household expenditure on such tutoring averaging RMB 8,438 per year. Approximately 15.5% of elementary and high school students participated in out-of-school interest-oriented tutoring in AY 2018–2019, with household expenditure of approximately RMB 5,340 per year. Among students who participated in subject-oriented tutoring, 26.6% were involved in tutoring provided by commercial organizations, while more than 70% primarily engaged in tutoring provided by individuals.
Third, combining statistics on school funding, this study examined the allocation of public investment in basic education among different student groups. The analysis shows that years of fiscal emphasis on and public investments in compulsory education and rural schools has significantly reduced the disparities in school funding across regions, between rural and urban areas, and among income groups.
In February 2018, the Chinese government issued the Notice Issued by the General Offices of Four Ministries Including the Ministry of Education on a Special Campaign to Rectify Out-of-School Tutoring Institutions to Reduce Extracurricular Study Burden on Primary and Secondary School Students. 5 In late December 2018, the MOE and eight other departments issued Measures to Reduce the Burden on Elementary and High School Students to reduce the academic burden on students. 6 Drawing on 2017 and 2019 CIEFR-HS panel data, this study analyzed changes in household expenditure and participation rates in out-of-school subject- and interest-oriented tutoring before and after Measures to Reduce the Burden on Elementary and High School Students was issued in 2018. The findings show that participation rates in out-of-school tutoring narrowed among elementary and high school students in 2019, while disparities between rural and urban households, high- and low-income households, and households with different education levels widened.
In July 2021, the “double reduction policy” was implemented, leading to a renewed strengthening of regulatory measures on extracurricular training institutions, while emphasizing the role of schools as the main educational institutions. This raises the question of whether this policy has led to any changes in the investment in both in-school education and out-of-school tutoring at the primary and secondary levels in China. It also prompts the question of whether the policy's impact will trickle down or have an upward effect. In future research, the first, second, and third waves of the CIEFR-HS—the latter of which was conducted in 2021 and 2022—will be analyzed to address the aforementioned questions and assess the impact of relevant policies.
Footnotes
Declaration of conflicting interests
The author declared no potential conflicts of interest with respect to the research, authorship, and/or publication of this article.
Ethical statement
The author drew upon the data from the China Institute for Educational Finance Research-Household Surveys. The use of data is publicly available, so it does not require ethical approval.
Funding
The author disclosed receipt of the following financial support for the research, authorship, and/or publication of this article: This work was supported by the National Office for Education Sciences Planning (grant number BFA201173).