
Abstract
Purpose:
The effectiveness of the 14-component evidence-based whole-school reform Success for All (SfA) has been well established, but research on its implementation is limited although fidelity of implementation is vital for the effectiveness of such a program. This review sheds light on this issue.
Design/Approach/Methods:
A systematic literature review was conducted to acquire an overview of qualitative and quantitative aspects of SfA’s implementation in primary schools as well as to identify stimulating and hindering factors when implementing SfA. Sixteen studies, conducted in the United States and the United Kingdom, were included in this review.
Findings:
Results indicate that 48% of schools implemented SfA at the minimal level, 45% at a more advanced level, and 7% at an insufficient level. Information on the implementation for each of the 14 components was rare. Most of the factors that affected implementation were hindering factors rather than stimulating ones. For successful implementation of this evidence-based program, the crucial factors appear to be leadership, fulfilling organizational conditions, staff development, and relentlessly implementing all 14 components together.
Originality/Value:
This review shows that for an evidence-based program to be effective, implementation fidelity is a very serious concern, which needs to be addressed systematically.
Introduction
Internationally, the demands for evidence-based education are increasing (e.g., CERI, 2007). Yet the educational field is known to adopt instructional programs and practices based on ideology, faddism, and marketing rather than evidence (Klingner et al., 2003; Slavin, 2008). For schools that are implementing evidence-based programs, it is a complicated process (e.g., Harn et al., 2013; Klingner et al., 2003) due to school contexts changing over time, high-stakes accountability pressures or mismatches between teacher styles and promoted practices.
Success for All (SfA) is an evidence-based, whole-school reform model that contains (among other things) a reading program employing cross-grade ability grouping and cooperative learning, tutoring, on-site continuous professional development, a leadership program, and a home involvement program. It has consistently demonstrated high levels of reading performance in schools serving large numbers of underprivileged students and/or in high-poverty areas (Borman et al., 2007; Quint et al., 2015; Slavin & Madden, 2012). Effect sizes reported in the randomized controlled trial (RCT) study of Borman et al. (2007) ranged between d = .21 and d = .36 for significant differences between the SfA and control condition across various reading measures, targeting (aspects of) decoding and reading comprehension. Quint et al. (2015), also using an RCT design, found a significant difference between SfA and control with an effect size of d = .15 on a decoding test. Interestingly, students in SfA schools did not significantly outperform students in the control condition on another decoding test, neither on a fluency test nor a reading comprehension test, with effect sizes between d = .03 and d = .07 (Quint et al., 2015). That being said, SfA “is arguably the most extensively evaluated whole-school reform strategy ever to exist” (Slavin & Madden, 2012, p. 24), referring to over 50 experimental-control comparison studies done by researchers from various institutions in which a consistent trend of positive program impacts is established. Independent reviews of research on whole-school reform strategies and reading programs have also identified SfA’s effectiveness (Borman et al., 2003; Comprehensive School Reform Quality Center, 2005).
SfA has successfully been transferred from the United States to the United Kingdom. Positive reading results have been demonstrated in a quasi-experimental study (Tracey et al., 2014) where significant differences between SfA and control schools amounted to effect sizes between d = .20 and d = .25 in the area of decoding and non-significant differences in the area of reading comprehension, with effect sizes between d = .06 and d = .12.
Whole-school reforms, including SfA, have been identified as an effective context for meeting varying student needs (Deunk et al., 2018), but one can imagine the implementation of such a reform being demanding for school staff. Different studies on the implementation of SfA address different components of SfA and use different setups in their description of SfA’s implementation. In the current study, we report the results of a systematic review on implementation of SfA in the United States and the United Kingdom in which we have synthesized quantitative and qualitative information on “What has been implemented and why?”. Our goal for this study is twofold. First, we aim to generate a better understanding of the multiple facets that need to be considered in implementing a whole-school reform, from both a theoretical and a practical standpoint. Our study can therefore be used as an example for implementation evaluations of evidence-based reforms, illustrated by using SfA. Second, this study will add to the body of knowledge on implementing SfA, while including studies from different international contexts. Its results are thus considered relevant for countries that are exploring the feasibility and appropriateness of SfA in their local context (for Germany, see Gogolin et al., 2018; for the Netherlands, see van Kuijk, 2017; for South-Africa, see van Staden, 2018).
The importance of assessing the degree of implementation
In order to establish effects, it is important that programs or reforms such as SfA are implemented in ways that are consistent with how they were planned and designed (Rossi et al., 2004). Effective implementation is associated with higher results (Durlak & DuPre, 2008; Hill & Erickson, 2019)—also in the context of SfA (e.g., Hopkins et al., 1999; Ross et al., 1997). “It cannot be emphasized strongly enough (…) that in implementing SfA the quality of implementation is crucial” (Hopkins et al., 1999, p. 267). Assessing the degree of implementation is essential. Accurate interpretation of results depends on knowing what aspects of the intervention were delivered and how well they were delivered; hence, it supports the internal validity of studies assessing a program’s effects on student outcomes. Furthermore, one needs to assess a program’s implementation in order to test the theory behind it (Durlak & DuPre, 2008; O’Donnell, 2008).
While many studies have been conducted on the effectiveness of SfA in the United States and the United Kingdom, only a limited number of studies have focused on its implementation. This is considered a remarkable finding. Three studies that evaluated the effects of SfA in combination with an evaluation of its implementation indicated that the effects of SfA would have been stronger if the program had been implemented to a higher degree (Hopkins et al., 1999; Miller et al., 2017; Quint et al., 2015). This would imply an even stronger “potential” of SfA for improving student outcomes. Insight into factors that affect implementation, both positively and negatively, are thus considered worthwhile. The fact that implementation data is rarely reported is not unique to SfA. Swanson et al. (2013) conducted a review study researching whether or not implementation measures had been reported in intervention studies that were published in educational journals and special education journals. Just under half (47%) of the articles examined reported some type of implementation fidelity score.
Implementation: Terminology and relevant constructs
Implementation: What to assess and how to assess it?
Implementing a “whole-school reform” (also known as “comprehensive school reform”) is known to be complex (Klingner et al., 2003). It is a slow process, taking multiple years—say 5 to 10—to be completed (Desimone, 2002; Fullan, 2000; Rowan et al., 2004; Rowan & Miller, 2007).
Harn et al. (2013) described the use of two more broad constructs when assessing the fidelity of implementation, that is, the degree to which a treatment/intervention is implemented as intended. Structural dimensions of implementation fidelity refer to measuring program adherence, time allocation, and intervention completion. In sum, these dimensions focus on the quantitative aspects of implementation. Process dimensions of implementation fidelity focus on the quality of the intervention delivery (e.g., the quality of teacher–student interactions). In Durlak and DuPre (2008), a well-known review study on the implementation of “innovations,” aspects of implementation are described which we consider to be embedded in the two constructs of Harn et al. (2013). Structural dimensions are frequently captured via observations or self-reports filled in by participating teachers. Process dimensions are commonly observed by external observers rating aspects like teacher responsiveness or student engagement. This latter, more qualitative, type of data is rarely reported in implementation studies. In the aforementioned review study of Swanson et al. (2013), only 9.8% of the intervention studies in general and special education provided data about the quality of the treatment.
Implementation: Which factors are important?
One can imagine that successful implementation of a reform or intervention is never guaranteed. In addition to measuring the degree of implementation, one should “identify under which conditions the intervention is effective (…) [and] disentangle the factors that ensure successful outcomes, characterize the failure to achieve success, or attempt to document the steps involved in achieving successful implementation of an intervention” (Linnan & Steckler, 2002, p. 1). This type of information will help provide explanations and interpretations for the measurement data (e.g., reported dosage of a program) and can aid future implementation of the program under study as well as other similar programs.
In order to do so, Durlak and DuPre (2008) identified stimulating and hindering factors that operate at different levels, being five in total. The (1) community context in which an intervention is conducted is important, as local political pressures or funding procedures can all help or hinder the implementation of an intervention. Factors at the level of (2) the provider are the experienced need for the intervention as well as its perceived benefits, skill proficiency, and self-efficacy. There are specific (3) innovation characteristics that affect the degree of implementation. Here, one can distinguish between adaptability (i.e., flexibility to modify the intervention in order to fit the needs of providers) and compatibility (i.e., the fit consistency with the provider’s current mission, priorities, and existing practices). The (4) organizational capacity contains organizational features such as effective leadership and the presence of the so-called “program champions” (preferably highly placed in the organization) which can help the implementation process. So will shared-decision making among providers, researchers, and stakeholders help the implementation process. The last factor, (5) training and technical assistance, contains the training of providers to develop relevant skills—preferably through modeling and coaching on the job in a constructive atmosphere—as well as attending to the providers’ expectations, motivation, and sense of self-efficacy. Technical assistance can take any form, as its mere goal is to maintain commitment and help solve problems experienced along the way.
Success for All—Components
SfA was developed in the late 1980s by Robert Slavin and Nancy Madden. Over time, the program has extended its content from an extensive reading program into a schoolwide approach containing 14 components that “addresses instruction, particularly in reading, as well as schoolwide issues related to leadership, attendance, school climate, behavior management, parent involvement and health that support student achievement” (Slavin & Madden, 2012, p. 13). As described in Cooper et al. (1998), it is through the combination of components that opportunities for students—particularly those at risk—can be improved. Similar to Gestalt Theory, the whole program is considered to result in greater outcomes “than the sum of its parts” (Wertheimer & Riezler, 1944). Quint et al. (2015) developed an elegant “logic model” to help describe the setup of SfA. The components are allocated to one of three focus areas, being (a) challenging reading instruction that responds to students’ individual needs, (b) components that address non-instructional issues that affect learning, and (c) emphasis on continuous improvement. In the description of SfA reported below, we combined information as discussed by Slavin and Madden’s (2012) most recent summary of research and Quint et al.'s (2015). We deliberately make use of the content of the original U.S. model rather than the slightly modified UK model, as it is considered the original model. Modifications to the program made in the United Kingdom are described further on in the current article. At present time, around 1,000 schools in the United States are implementing the SfA program and 60 in the United Kingdom.
Challenging reading instruction that responds to students’ individual needs
This focus area centered on instruction combines didactical features (e.g., a strong focus on cooperative learning) with structural ones (e.g., cross-grade ability grouping). Five components are described below. 1. The reading program is based on research and effective practices in reading, in order for every child to become “a skilled, strategic and enthusiastic reader by the end of elementary grades and beyond” (Slavin & Madden, 2012, p. 10). Both at the first grade reading level, using “Reading Roots,” and at the second grade level or higher, using “Reading Wings,” curricular materials are built around children’s literature. In short, the focus of these materials is on decoding practice, story structure, the use of reading comprehension strategies such as prediction and summarization, vocabulary building, and story-related writing. Verbal discussions of the story are used to stimulate reading comprehension as well as oral language skills. In Roots and Wings, the reading program consists of 90-min reading blocks. Both Roots and Wings have been translated into Spanish for students for whom this is their mother tongue (Slavin & Madden, 2012). The teacher manuals used in all classes have been described by other authors as a “script” (e.g., Rowan & Miller, 2007), referring to the high level of detail and structure. 2. Cooperative learning is embedded in the reading program “to enhance motivation, engagement, and opportunities for cognitive rehearsal” (Slavin & Madden, 2012, p. 14). Cooperative learning structures—such as think-pair-share—are employed to ensure the active involvement of all students, for which rapid pacing and celebration of success are important features. 3. Students in grade 1 and up are regrouped by their reading performance level. This regrouping allows teachers to teach the whole, rather homogeneous, reading class without having to break the class into reading groups. Regrouping greatly reduces the time spent in seatwork and increases direct instruction time in comparison to classes with different reading groups. To orchestrate this regrouping across classes and grades, it is common that students’ SfA teachers are not their homeroom teachers. Quarterly assessments are used to determine whether students are making sufficient progress in reading, which students are candidates for acceleration and should be regrouped, and which students should be assigned to tutoring or are needing other types of assistance. 4. When children are having difficulties keeping up with their reading groups or are lagging behind, they receive help of reading tutors. Tutoring should be provided by certified teachers or well-qualified paraprofessionals for 20 min, during times other than reading or mathematics. Two forms of computer-assisted tutoring are available, assisting the tutor in their work. “Team Alphie” is used in small-group settings, and “Alphie’s Alley” is used in a one-to-one setting for more severe cases. 5. In the specific case for students with special needs, every effort is made to deal with students’ reading disabilities and/or learning problems within the context of the regular classroom, with the help of tutors. One major goal of SfA is to keep students with learning problems out of special education if possible (Slavin & Madden, 2012).
Components that address non-instructional issues that affect learning
The second focus area consists of components that take into consideration that students’ ability to learn can be hindered by other issues they face. There are five distinctive teams, grouped together in the so-called “Schoolwide Solutions Network.”
6. The Parent and Family Involvement team focuses on establishing partnerships with parents in order to increase involvement in the school and at home. Team members organize “welcome” visits for new families, opportunities for informal chats among parents and school staff members, workshops for parents on supporting achievement and general parenting issues, and volunteer opportunities.
7. One group of school staff members, in a team called Cooperative Culture, addresses the development of a positive school culture. A set of lessons focused on cooperation and self-regulation, “Getting Along Together,” is taught by all teachers. All school staff support implement the conflict resolution and problem-solving skills presented throughout the building and throughout the day.
8. The Attendance team ensures that all students are in school on time each day, and for putting solutions in place if attendance or tardiness problems occur at individual, subgroup, grade or school levels.
9. Students struggling with learning or behavioral issues are offered additional supports by the Intervention team, through a case management approach.
10. Community Connections: This group of staff members builds links to community resources to meet families’ and students’ needs. This group may seek, for example, resources for health screenings, eyeglass procurement, volunteer listeners, incentives to be used to recognize success, or other opportunities (Slavin & Madden, 2012).
Emphasis on continuous improvement
The third focus area pertains to the program’s emphasis on continuous improvement. Here, four components are described.
11. A program facilitator is employed in order to visit classrooms and work with teachers, helping them to improve their implementation of the reading program. In addition, the facilitator helps manage the 8-week assessments and coordinates tutoring and other activities as part of the program.
12. The leadership team in a school uses a model for distributive leadership called “Leading for Success.” Using this structure, all school staff are engaged in different teams in order to assess progress and addressing areas that need improvement. Setting goals and monitoring progress are key features of Leading for Success.
13. The staff development model used in SfA emphasizes relatively brief initial training with extensive classroom follow-up and coaching. Throughout the year, the SfA program facilitator or SfA coach (employed by the SfA foundation to support schools in their implementation) organizes additional in-service presentations or training on topics such as classroom management, instructional pace, and cooperative learning.
14. Instructional component teams for “Reading Roots,” “Reading Wings” and tutoring meet biweekly to share data, discuss strategies, and identify targets for improvement.
Buy-in and commitment to SfA are crucial. SfA only works in U.S. schools in which at least 80% of staff have voted by secret ballot to adopt the program (e.g., Cooper et al., 1998). Once a school has started to implement SfA, resources are continuously employed around a well-defined goal and its progress is continuously monitored—as it “would be possible to have all the components in place yet still not ensure the success of at-risk children” (Slavin & Madden, 2012, p. 23). With this, these authors mean that formally one can have the structure and all the 14 components in place, but if there is not a culture of relentlessness, meaning that each and every one is committed to obtaining success for all children, the program’s success is not likely.
For our review study, we focused on SfA as a reading program for primary schools from grade 1 to 6. The content of the program for preschool and kindergarten (“KinderCorner”), older readers (“Reading Edge”), or other curricular areas (“MathLab” and “WorldLab”) is described elsewhere (Slavin & Madden, 2001; Slavin et al., 2009).
SfA in other countries
In the United Kingdom, SfA was first implemented at the end of the 1990s. It was “substantially adapted” to the language, culture, and standards of England, Scotland, and Wales—although the basic structure is described to be the same as the U.S. version (Tracey et al., 2014). For instance, accommodations with respect to ability grouping and related staffing were made as English primary are frequently much smaller than those in the United States. Accommodations were also made with respect to tutoring, as UK schools needed to employ volunteer tutors—rather than certified teachers or paid paraprofessionals—as there were no funding resources for tutoring (Hopkins et al., 1999). At that time, the tutoring software program for students in a one-to-one setting, called “Tutoring with Alphie,” had limited functionality in comparison to the U.S. version (Harris et al., 2001). Furthermore, the family support and integrated service components were not reproduced in a consistent way among the SfA schools. Last, the program facilitator was a half-time position rather than a full-time position which is required in the United States (Hopkins et al., 1999).
In addition to the United Kingdom, SfA has been implemented in Canada and Mexico. The number of schools that participated in these initiatives is rather limited however. In Australia and in Israel, programs were developed that were based on SfA, but that also incorporated other approaches. Again, a very small number of school was involved. The interested reader is referred to Slavin and Madden (2001).
Research questions
What is the degree of fidelity of implementation of the evidence-based program SfA as a whole and for each of its 14 constituting components separately?
What are the stimulating and hindering factors for successful implementation of the evidence-based program SfA?
Method
The following paragraphs describe the methods used to conduct the current systematic review on the implementation of SfA, in which we incorporated both qualitative and quantitative data. In addition, we were interested in explanations of this degree of implementation by studying hindering and stimulating factors that were discussed in the studies included in our review. For this purpose, we conducted an extensive literature search and performed content coding.
Literature search procedures
Two strategies were employed to locate relevant publications. The first strategy entailed computer searches of three databases, being Web of Science, PsychInfo, and ERIC using multiple search terms in various configurations in title, abstract, topic, or key words (“Success for All,” “implement*,” “United Kingdom,” “England”—the latter two search terms specifically included as the number of publications on SfA UK is limited). The second strategy entailed contact with—previous—principal researchers in the United States (being Robert Slavin of Johns Hopkins University in Baltimore, MD) and the United Kingdom (being Bette Chambers and Louise Tracey of the Institute for Effective Education in York, and Sarah Miller of Queen’s University in Belfast) if they had conducted or knew of any publications in which the implementation of SfA was studied.
Inclusion and exclusion criteria
To be included in our review, the study needed to meet four criteria: (1) The study should report qualitative and/or quantitative empirical research on the implementation of SfA in schools and/or classes and/or on factors that facilitated or hindered this implementation. (2) The data should be measured via the use of (a) questionnaires, (b) interviews, (c) teacher logs, and/or (d) observations and should be reported in such a way that scientific quality can be established (e.g., sample size and origin of research instruments). (3) The data should pertain to the program in primary schools, where we focused on Grade 1 to Grade 6 (thus excluding results on preschools, kindergartens, or secondary schools). The results of the literature search are summarized in Figure 1.
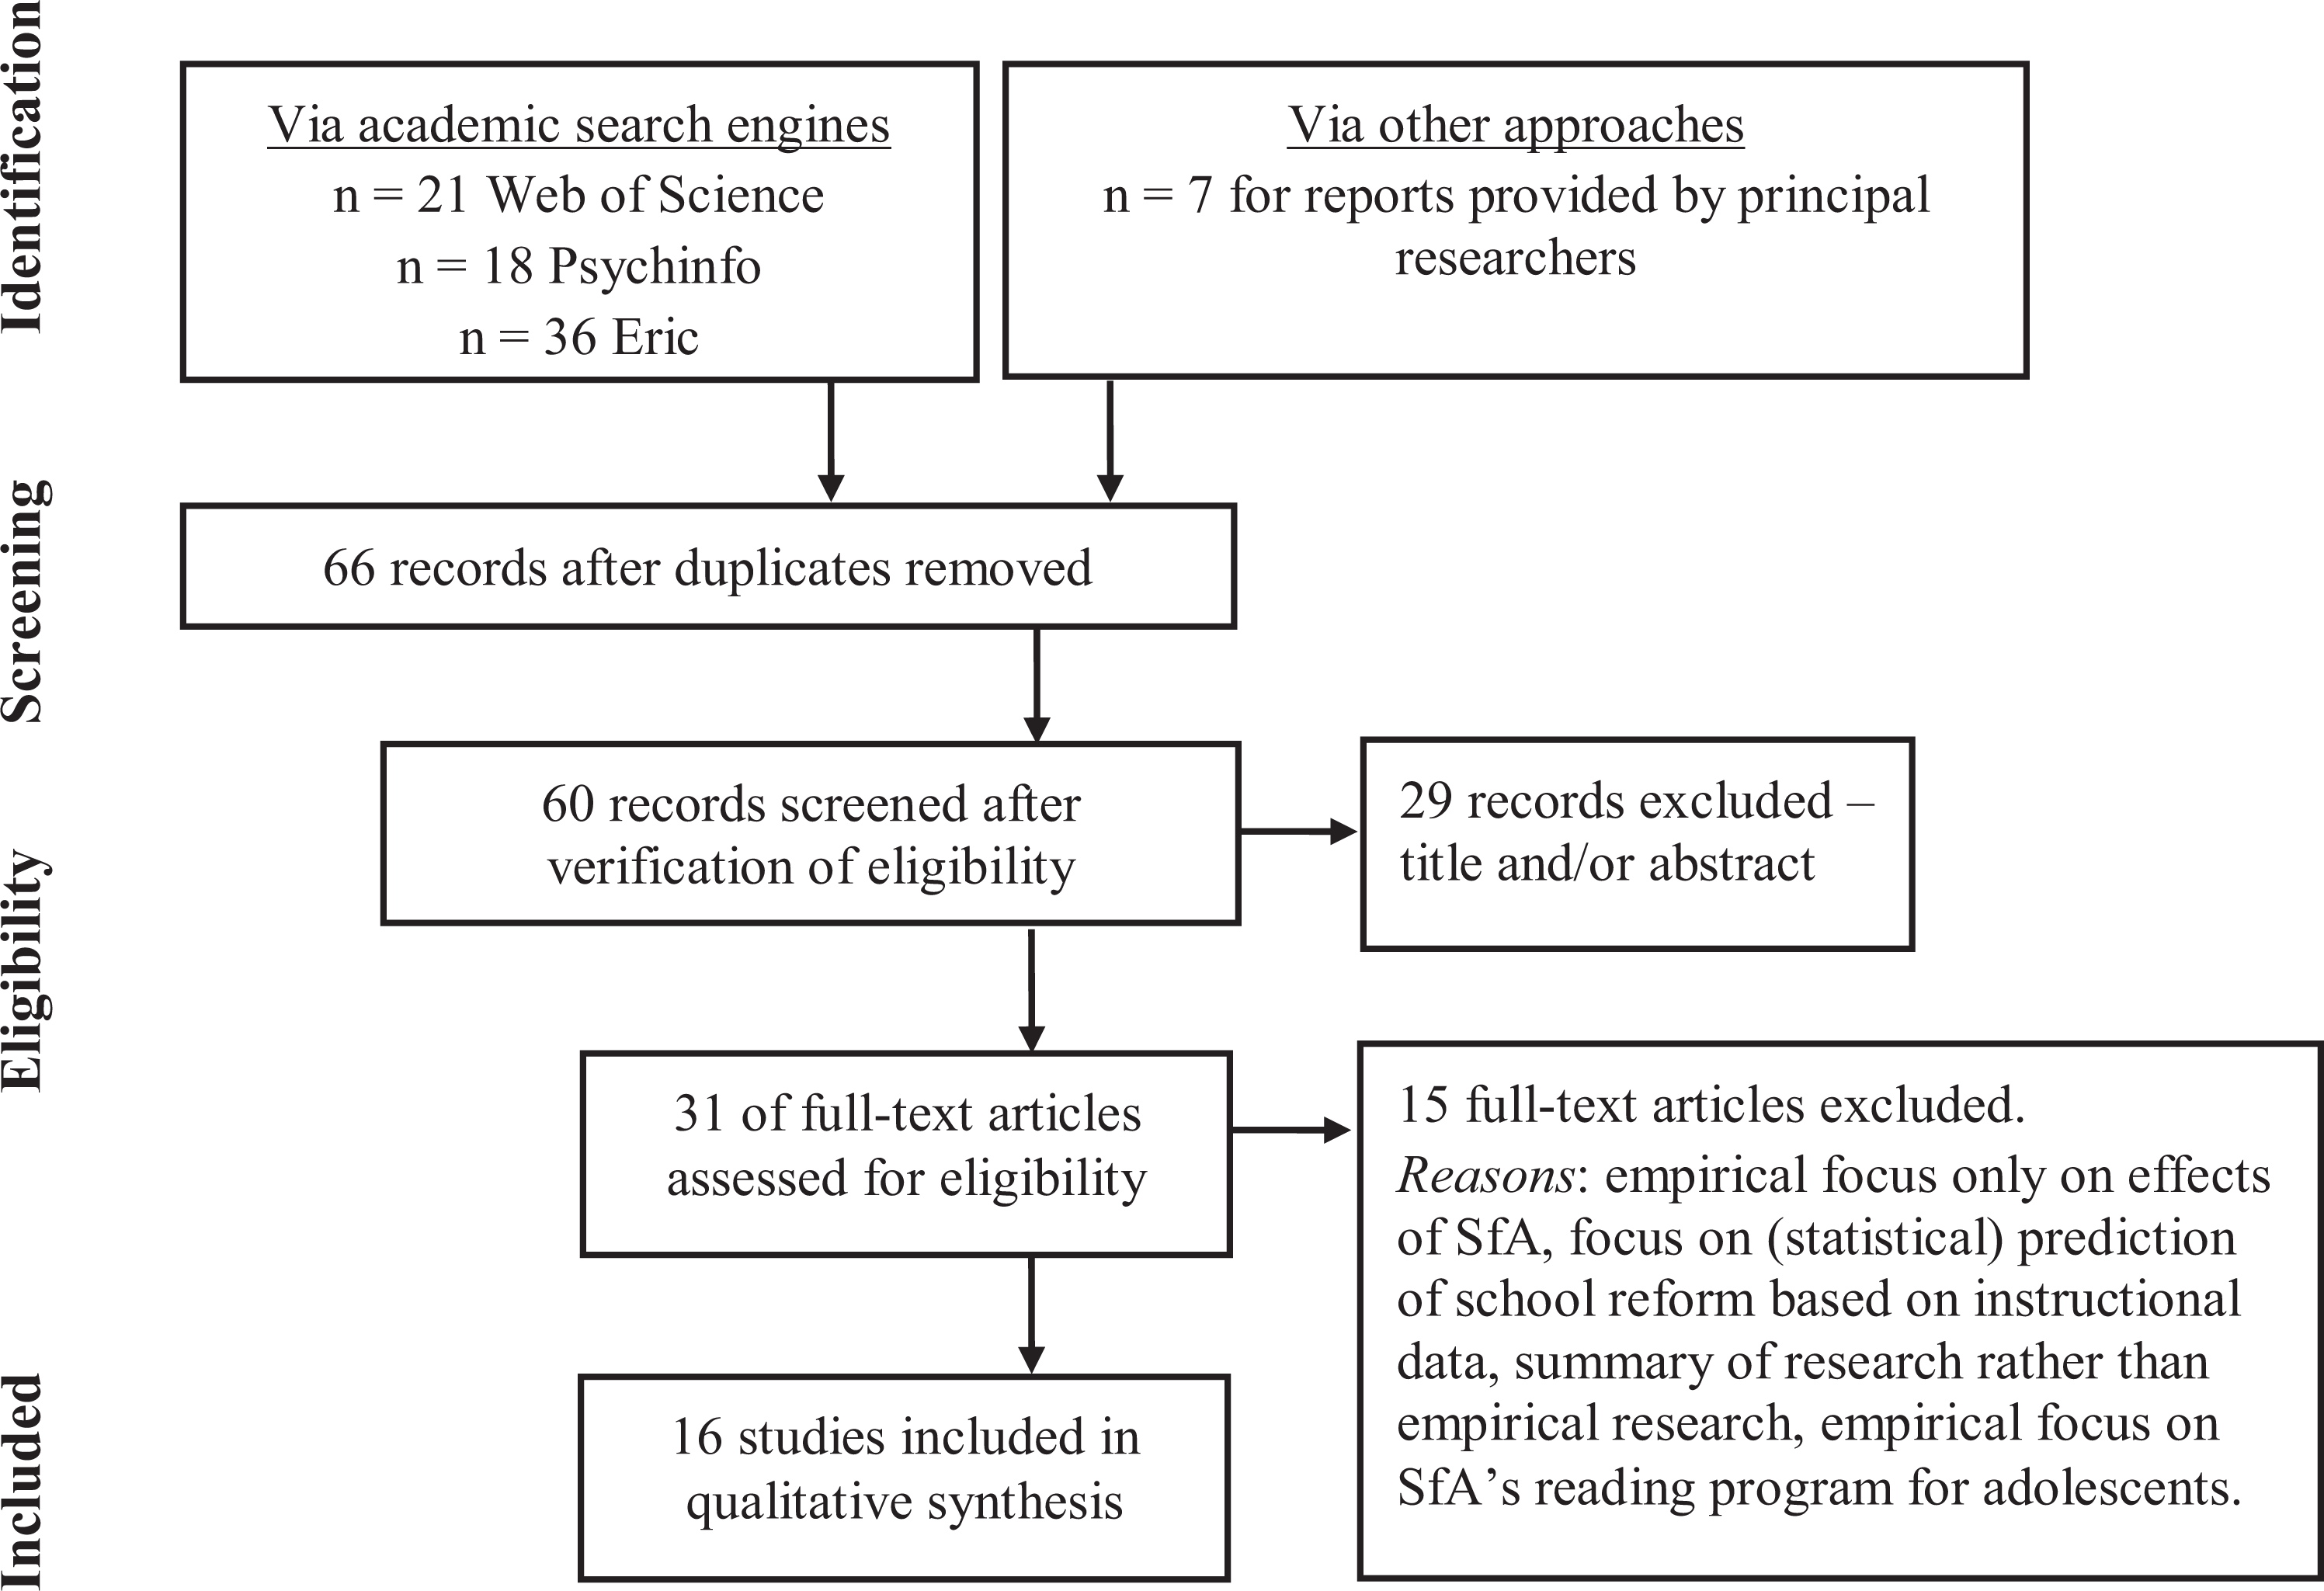
Flow diagram using PRISMA framework.
Only 60 of the original 66 records were screened. We excluded a book review (Baker, 2002), two conference papers (Nunnery et al., 1997; Ross et al., 1998), and the research summary of Slavin and Madden (2012) because they did not meet the aforementioned inclusion criteria. Two technical reports (Datnow & Castellano, 2000a; Ross et al., 1996) were excluded as the content of these reports (or large parts of it) had been published in academic journals—and those studies were already included in our sample.
Coding procedure and qualitative analysis
For the coding procedure and qualitative analysis, we analyzed the selected articles using deductive qualitative analysis (Gilgun, 2005). Deductive qualitative analysis resembles the procedure used in the grounded theory approach of Strauss and Corbin (1990) in which one applies (1) open coding, (2) axial coding, and (3) selective coding. The main difference between grounded theory and deductive qualitative analysis is the use of a predefined theoretical framework rather than open coding. The content of the articles was coded by looking for descriptions on the quantity or quality of the implementation of SfA as a whole or pertaining to one (or more) of the 14 aforementioned components. In addition, factors that facilitated or hindered its implementation were sought. In our case, we used the labels “structural” (quantity) and “process” (quality) dimensions of implementation as identified by Harn et al. (2013) to categorize observable behaviors or conducts that described “what” was being implemented. Factors hindering or facilitating implementation—answering the question “why” the implementation of SfA is the way that it is observed to be—were coded using Durlak and DuPre’s (2008) work. Examples of all of these codes are provided in Table 1. In our analysis, we scored the frequency of the levels (e.g., community or innovation) in order to identify whether certain levels were more influential than others in the implementation process. For purposes of readability, we will discuss this process more elaborately in the presentation of the results.
Overview of coding labels and examples.
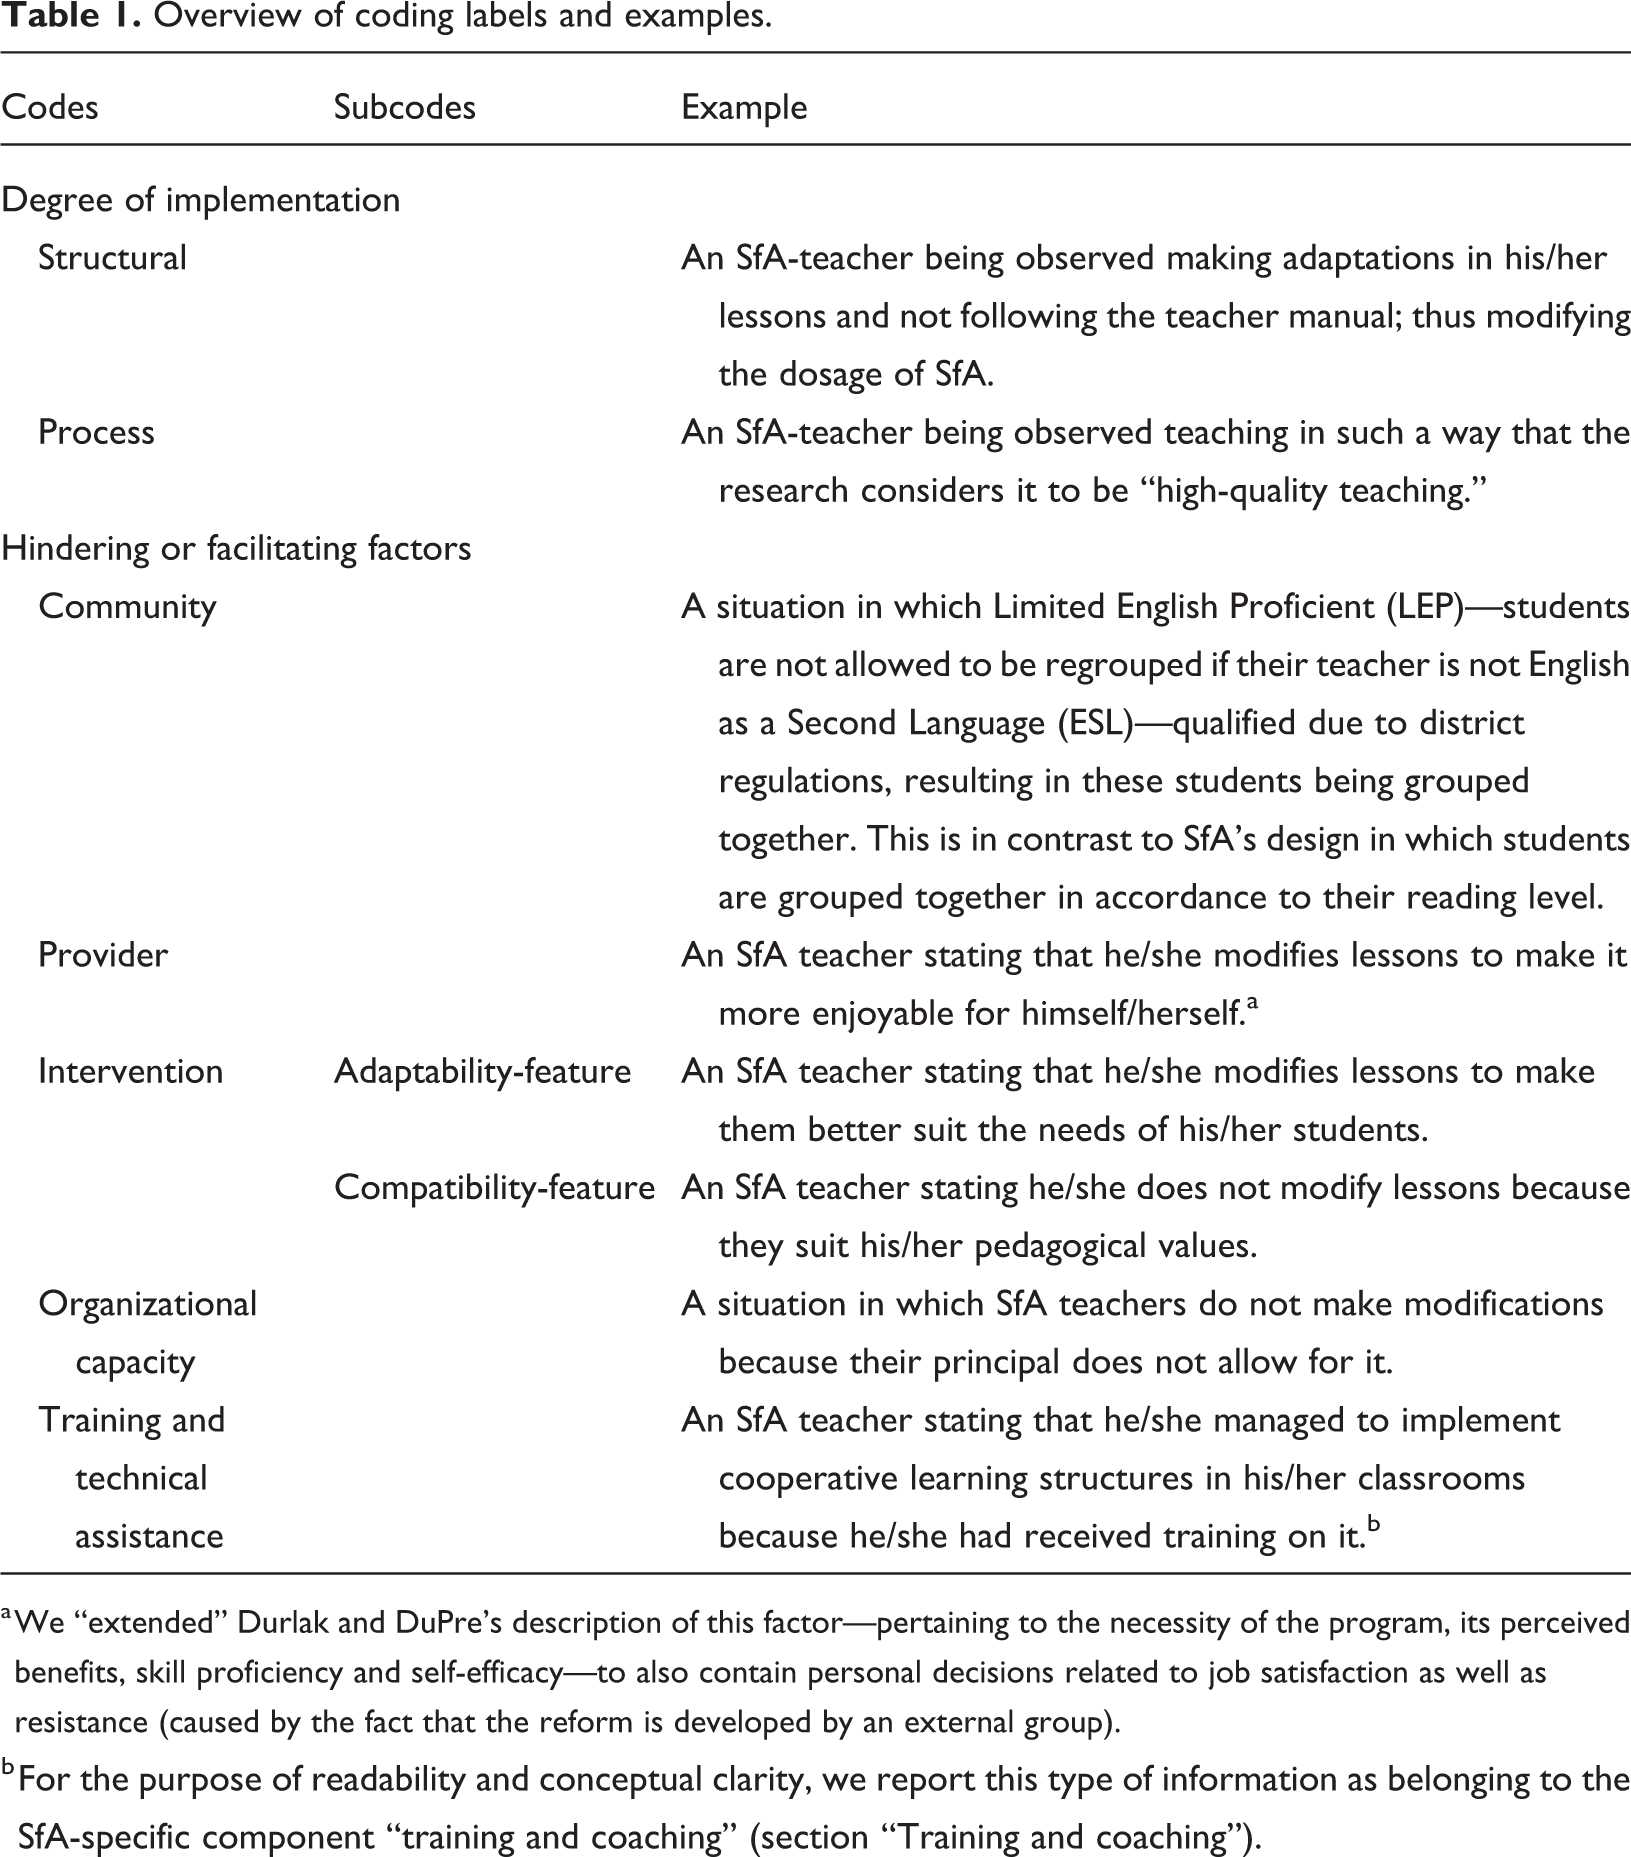
a We “extended” Durlak and DuPre’s description of this factor—pertaining to the necessity of the program, its perceived benefits, skill proficiency and self-efficacy—to also contain personal decisions related to job satisfaction as well as resistance (caused by the fact that the reform is developed by an external group).
b For the purpose of readability and conceptual clarity, we report this type of information as belonging to the SfA-specific component “training and coaching” (section “Training and coaching”).
An important feature in deductive qualitative analysis is that the researchers remain alert for “other codes” or information that requires modification of the predefined codes. This is what Gilgun (2005) qualified as applying “negative case analysis” and is similar to Strauss and Corbin’s (1990) recommendation to keep operational notes during coding. First of all, we extended the “provider” category—pertaining to the necessity of the program, its perceived benefits, skill proficiency, and self-efficacy—to also contain personal decisions related to job satisfaction as well as general resistance. Furthermore, the link between concrete behaviors and underlying reasons for doing so was sometimes implicit. We therefore added labels identifying factors that potentially stimulated or impeded implementation. Last, we added a separate topic called “Leadership Style of the Principal and Other Issues of Power Affecting Implementation,” in which we addressed stimulating and hindering factors at the principal and district levels that could not be classified under the previously described 14 original components of SfA.
Results
An overview of the 16 studies selected for this review can be found in Table 2. The majority of the studies, namely 10 out of 16, were conducted in the United States. One can see quite some variation in the number of SfA schools included in each study, the type of instruments used, and the number of respondents. As some studies made use of data provided by SfA on implementation fidelity while others gathered their own implementation fidelity data, we decided to include information on the designer of the instrument. Only data of the SfA schools and information pertaining to SfA lessons are included. Data pertaining to control schools—using other reform models or “business as usual”—or pertaining to other courses taught in the SfA schools are thus excluded. The number of schools in this table pertains to the sample size after removal of dropouts.
Overview of the selected studies.
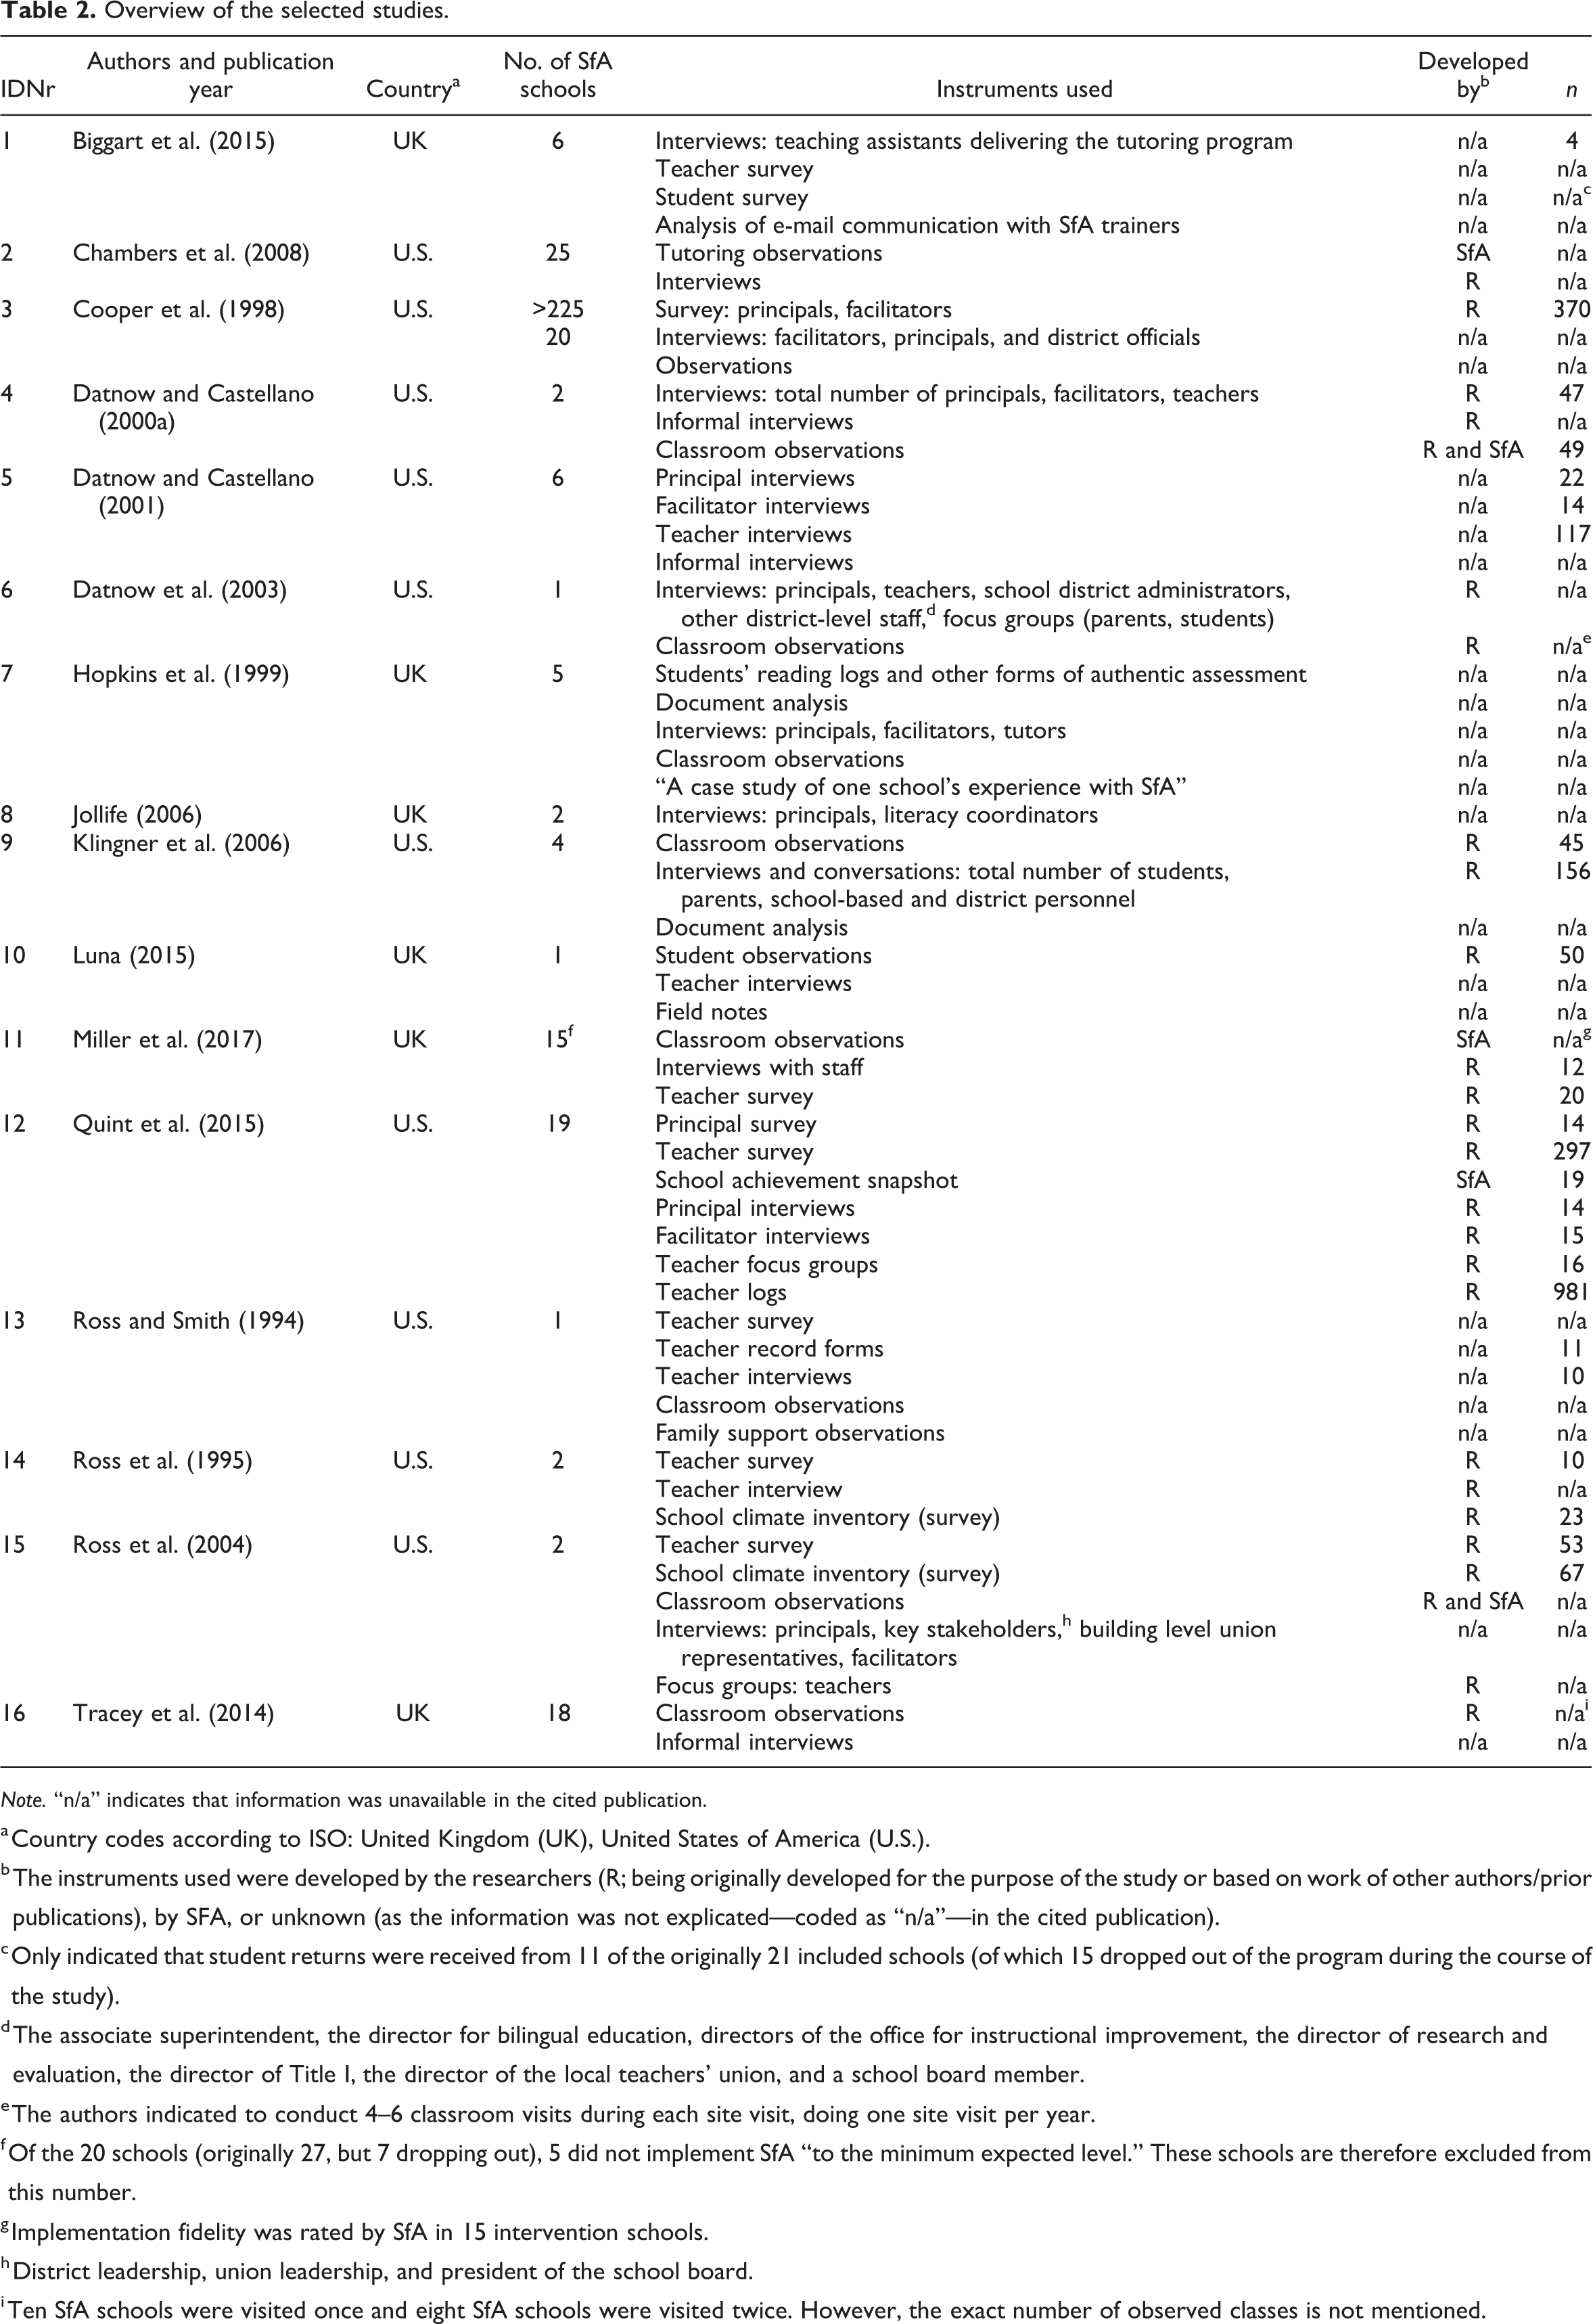
Note. “n/a” indicates that information was unavailable in the cited publication.
a Country codes according to ISO: United Kingdom (UK), United States of America (U.S.).
b The instruments used were developed by the researchers (R; being originally developed for the purpose of the study or based on work of other authors/prior publications), by SFA, or unknown (as the information was not explicated—coded as “n/a”—in the cited publication).
c Only indicated that student returns were received from 11 of the originally 21 included schools (of which 15 dropped out of the program during the course of the study).
d The associate superintendent, the director for bilingual education, directors of the office for instructional improvement, the director of research and evaluation, the director of Title I, the director of the local teachers’ union, and a school board member.
e The authors indicated to conduct 4–6 classroom visits during each site visit, doing one site visit per year.
f Of the 20 schools (originally 27, but 7 dropping out), 5 did not implement SfA “to the minimum expected level.” These schools are therefore excluded from this number.
g Implementation fidelity was rated by SfA in 15 intervention schools.
h District leadership, union leadership, and president of the school board.
i Ten SfA schools were visited once and eight SfA schools were visited twice. However, the exact number of observed classes is not mentioned.
Our goal was to report results on the implementation of SfA as a whole as well as for the separate 14 components. Table 3 shows the numbers of studies per component. The study ID numbers correspond with the numbers used in Table 2. One can see that certain components have been studied much more extensively than others.
Number of studies per component.
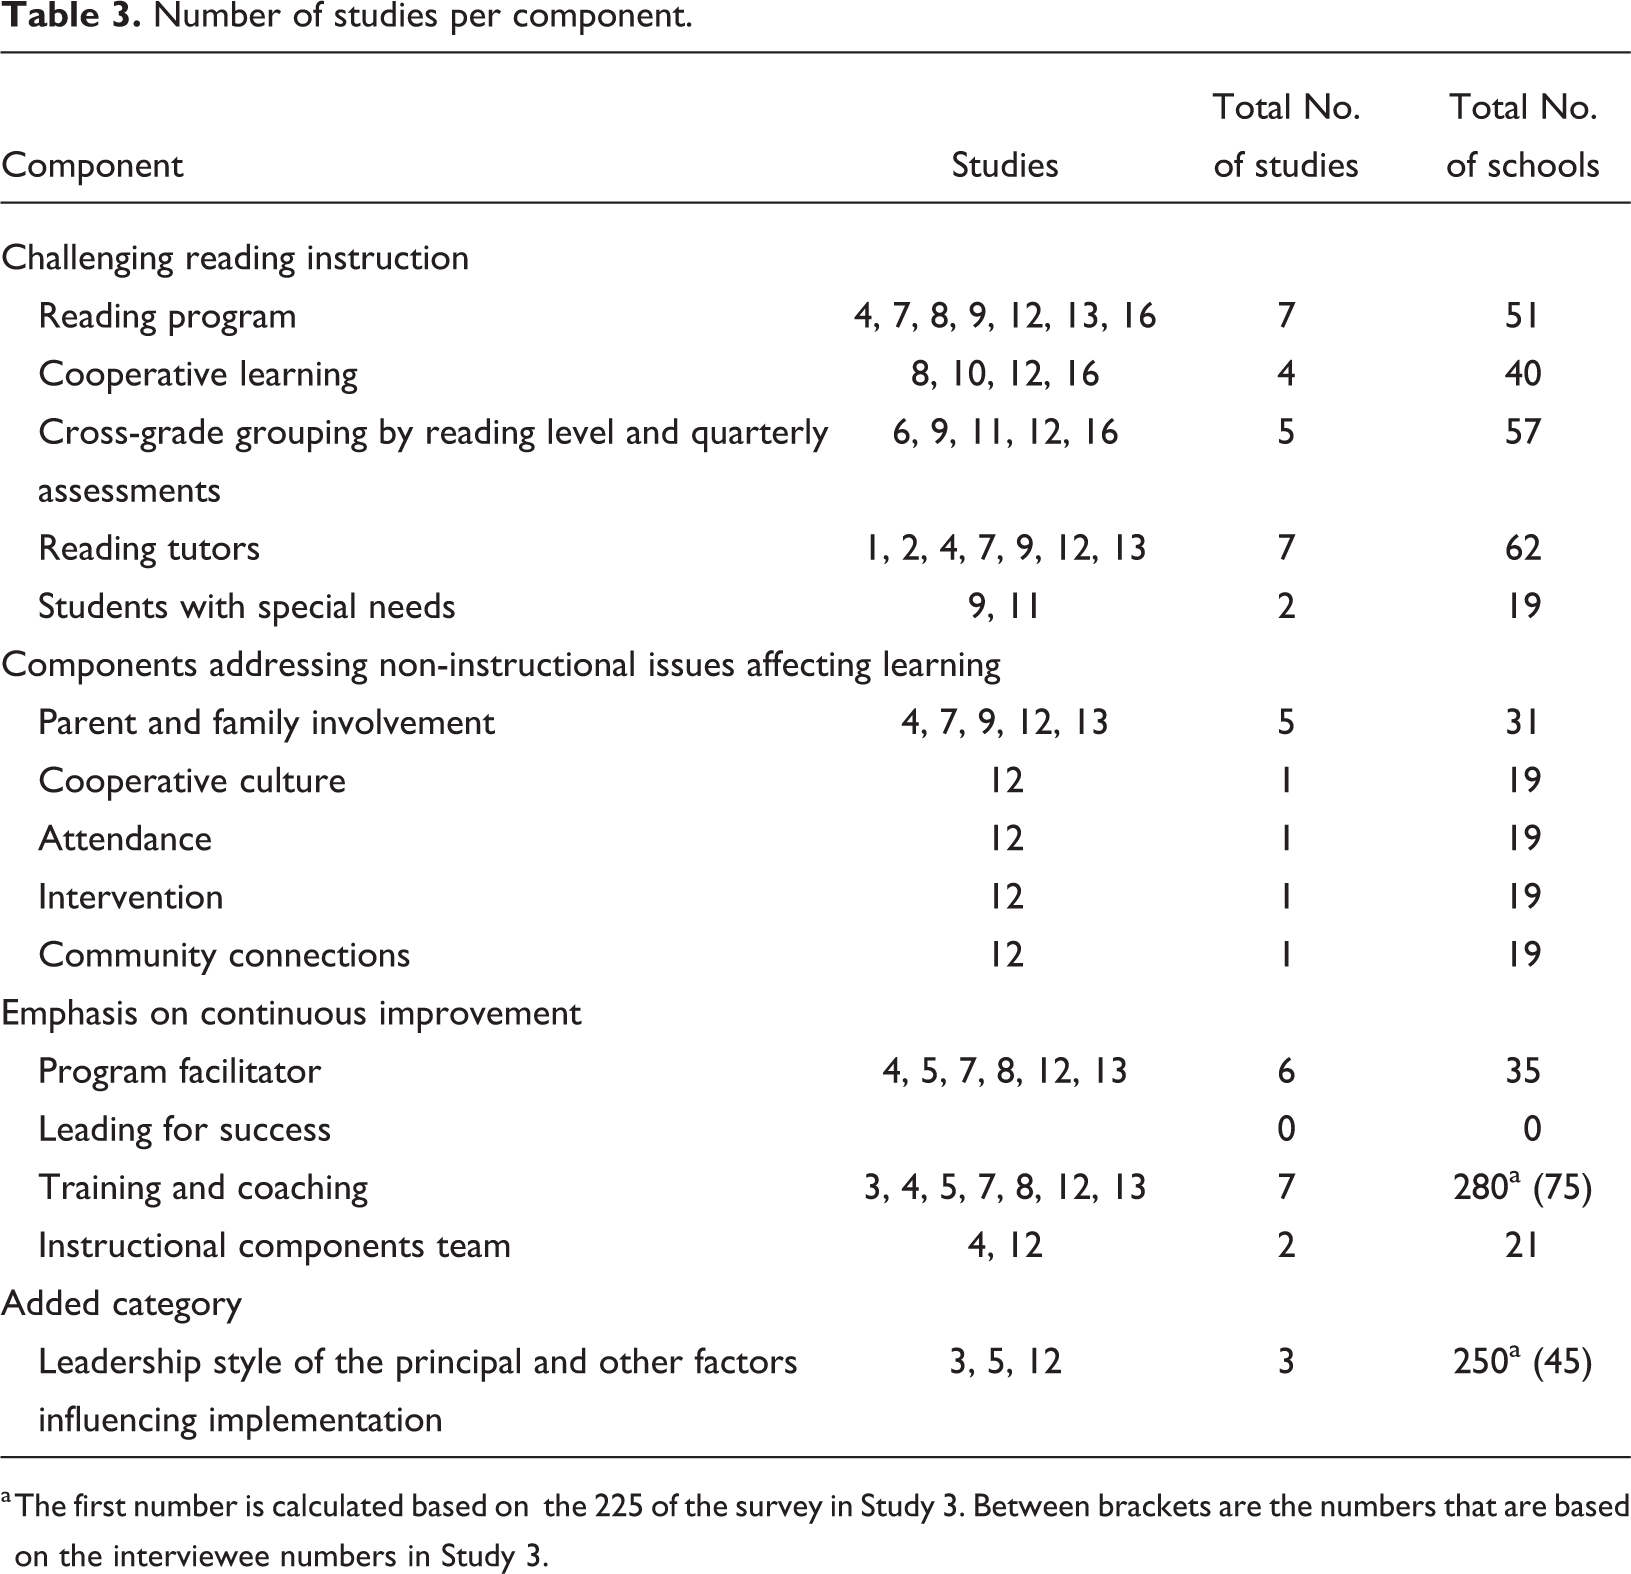
a The first number is calculated based on the 225 of the survey in Study 3. Between brackets are the numbers that are based on the interviewee numbers in Study 3.
General fidelity ratings indicating the quality of implementation
During coding, we discovered that information on the process dimension—that is, the quality—of implementation was not provided for SfA’s separate components. However, seven articles provided general “fidelity measures,” pertaining to the quality of implementation of the schoolwide program. A summary is provided in Table 4. Again, the study ID numbers correspond to those in Table 2.
Overview of the fidelity of implementation of SfA’s schoolwide program per study if provided.
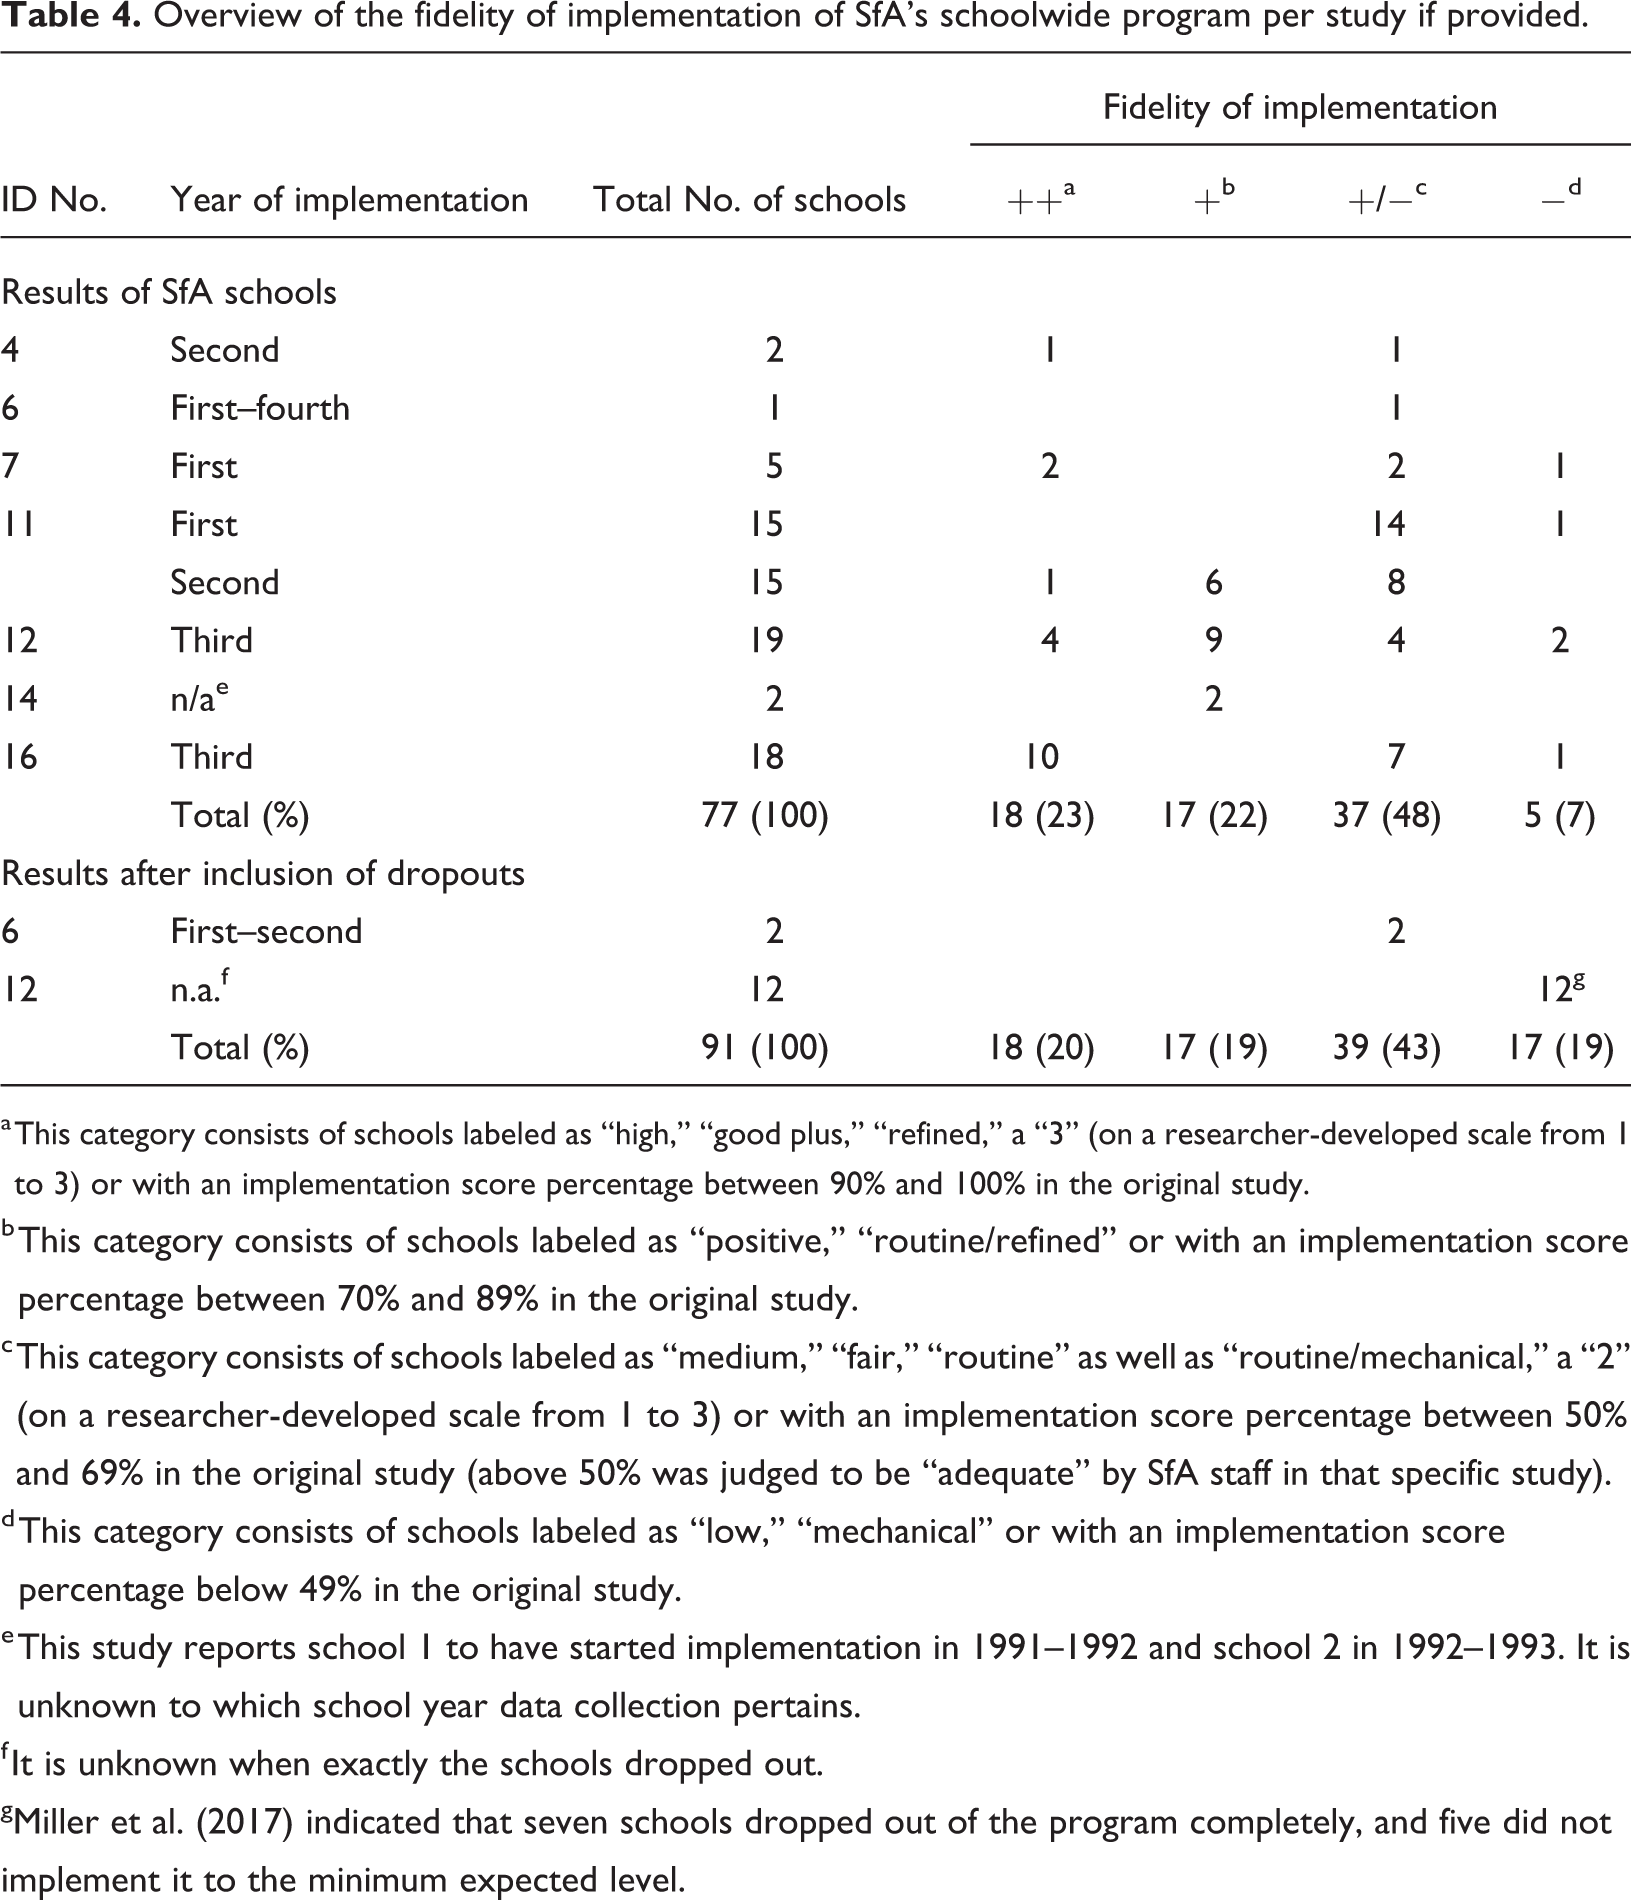
a This category consists of schools labeled as “high,” “good plus,” “refined,” a “3” (on a researcher-developed scale from 1 to 3) or with an implementation score percentage between 90% and 100% in the original study.
b This category consists of schools labeled as “positive,” “routine/refined” or with an implementation score percentage between 70% and 89% in the original study.
c This category consists of schools labeled as “medium,” “fair,” “routine” as well as “routine/mechanical,” a “2” (on a researcher-developed scale from 1 to 3) or with an implementation score percentage between 50% and 69% in the original study (above 50% was judged to be “adequate” by SfA staff in that specific study).
d This category consists of schools labeled as “low,” “mechanical” or with an implementation score percentage below 49% in the original study.
e This study reports school 1 to have started implementation in 1991–1992 and school 2 in 1992–1993. It is unknown to which school year data collection pertains.
f It is unknown when exactly the schools dropped out.
g Miller et al. (2017) indicated that seven schools dropped out of the program completely, and five did not implement it to the minimum expected level.
Table 4 shows that 48% of schools implement SfA at a minimal level (rated “+/−”) and 7% did not succeed in establishing a sufficient degree of implementation (rated “−”). The groups of schools that succeed in implementing the program to such an extent that they are allocated to the highest level (rated “++”) or second highest level (rated “+”) are of relatively equal sizes (22%–23% each). If we correct for attrition bias (e.g., discussed in Rossi et al., 2004) by including the dropouts of the study of Miller et al. (2017) and of Datnow et al. (2003), 62% receive the “+/−” or the “−” rating. In other words, the overall picture of implementation success is not affected by the inclusion of dropouts.
Challenging instruction
In this paragraph, we will discuss the results for the five components belonging to the focus area of challenging instruction. Per component, we discuss structural aspects of implementation (“What has been implemented?”), followed by factors affecting—or potentially affecting—implementation (“Why was it implemented in this way?”) and allocating these factors to the level-framework proposed by Durlak and DuPre (2008), being factors at the (1) community context, (2) provider characteristics, (3) innovation characteristics, and (4) organizational capacity. The fifth level, training and technical assistance, is discussed separately as SfA has a separate component in which training is addressed (discussed in “Training and coaching” section). In our presentation of hindering and facilitating factors, we grouped factors belonging to the same level (e.g., community) together. Per component, the results are presented in such a way that the most frequently identified level is discussed first. At the end of the “Results” section, a summary is provided indicating the frequency of stimulating or hindering factors per component.
Reading program
Structural implementation of the curriculum materials
In six publications, it had been observed by the researchers or discussed by the teachers that they modified the curriculum by (a) taking more time and thus changing the pacing of the materials (Datnow & Castellano, 2000b; Datnow et al., 2003; Klingner et al., 2006; Miller et al., 2017; Tracey et al., 2014), (b) skipping elements or specific activities in the curriculum (Datnow & Castellano, 2000b; Datnow et al., 2003; Klingner et al., 2006), (c) using other materials, and/or (d) adapting the materials (Quint et al., 2015; Tracey et al., 2014). In contrast, teachers at a number of schools in the report of Quint et al. (2015) indicated that they followed the pacing guidelines. As changes in materials and pacing affect the dosage of SfA, this is labeled as a structural dimension of implementation. One can imagine that these modifications also impact the program’s duration requirement of 90 min. This was explicitly discussed in only 3 of the 16 studies included in our review. In the report of Quint et al. (2015) and the study of Ross et al. (2004), this requirement was met. This was not the case in the study of Miller et al. (2017). Here, lessons were reduced to less than 90 min a day and/or less than 5 days a week.
Interestingly, in the study of Datnow and Castellano (2000b), all teachers (i.e., ranging from strong supporters to those judged to be vehemently against SfA) were observed in making adaptations to the program—particularly in pacing. In the study of Klingner et al. (2006), this behavior was only observed among the teachers for which the researchers judged them to be more effective in their teaching. Quint et al. (2015) did report an improvement in pacing over time, based on the fidelity measures used by SfA coaches.
In two studies, the abovementioned modifications were reported to be tolerated by program facilitators and/or school principals to maintain support for SfA (Datnow & Castellano, 2000b, 2001). In two other studies, these modifications were mentioned to be proposed or supported by SfA staff (Datnow & Castellano, 2000b; Quint et al., 2015). In one study, a more secretive approach had to be taken by teachers (Datnow et al., 2003).
Factors affecting the implementation of the reading program
Hindering factors for the implementation of the reading program were most frequently found at the level of the innovation. In three studies in which adaptations and modifications are reported, teachers reported doing so as they felt that the materials did not suit their students’ needs, such as Limited English Proficient (LEP) students or Spanish-speaking students (Datnow et al., 2003; Datnow & Castellano, 2000b; Miller et al., 2017). In these three studies, teachers experienced insufficient adaptability of the program to the needs of its learners. A second factor for modifying the program, as reported in two studies, was caused by the discomfort teachers experienced when moving on with the lessons before teaching skills to mastery—which is embedded in the pacing requirement of SfA (Datnow & Castellano, 2000b; Quint et al., 2015). This is also qualified as an innovation characteristic, due to insufficient compatibility with teachers' existing pedagogical–didactical views. A third rationale that we consider to be a potentially impeding factor was the degree of “scriptedness” of the program: It was reported in five studies as a cause for frustration, skepticism, or resistance (Cooper et al., 1998; Datnow & Castellano, 2000b; Miller et al., 2017; Quint et al., 2015; Ross et al., 2004). Again, we interpret this as insufficient compatibility with teachers’ pedagogical preferences.
Two factors affecting implementation were found at the level of the provider and two factors were also found at the level of the community. At the level of the provider, the first reason for making modifications was reported to come from a lack of enjoyment and “boredom,” which was reported in two studies (Datnow & Castellano, 2000b; Klingner et al., 2006). The second rationale that was considered as a factor potentially impeding implementation at this level were the reservations uttered by teachers “simply because it was a specified program developed by an external group” (Datnow & Castellano, 2000b, p. 792).
One hindering and one facilitating factor were identified at the level of the community. In one publication, modifications were made due to insufficient alignment to state testing obligations (Ross & Smith, 1994). A potentially stimulating factor at this level was identified in the study of Hopkins et al. (1999): They indicated the advantage of being obliged to have a “literacy hour” embedded in the requirements in the United Kingdom. Schools needed to rearrange their daily schedules prior to the start of SfA.
A factor that was reported in two studies to impede the implementation of SfA’s reading program was high teacher turnover rate (Datnow & Castellano, 2000b; Ross et al., 2004). This is labeled as organizational capacity.
Cooperative learning
Structural implementation of cooperative learning
Two of the 16 studies discussed the implementation of cooperative learning. Tracey et al. (2014) stated that the key element that varied among schools in their implementation of the SfA program in their UK study was the extent to which cooperative learning was followed with consistency. Implementation fidelity ratings gathered by SfA coaches in the United States indicated an improvement over time, although there remained room for improvement in teachers’ use of this instructional method (Quint et al., 2015).
Factors affecting the implementation of cooperative learning
Hindering factors for the implementation of cooperative learning were found equally frequent at the level of the community and at the level of the innovation. A possibly impeding factor identified at the level of the community in the study of Luna (2015) was the complexity of high-stakes accountability pressures experienced by teachers; they were asked to demonstrate student learning in relation to the—less tangible—learning that is expected to require through a cooperative process. A second reason this author discussed, that potentially impeded implementation, was the established cultural belief and educational agenda that individual achievement and competition rather than collaboration were valued more than cooperative learning.
Hindering factors at the level of the innovation were the following. Luna (2015) reported the diversity in students’ skills, either in reading—because despite grouping, heterogeneity remained—or other types of skills (writing, listening, being focused, grasping a problem, and self-confidence) which were observed as obstacles for cooperative work. The program thus did not appear to suit the needs or skills of all learners (thus insufficient adaptability). A possibly impeding factor at this level was identified in the report of Quint et al. (2015), where teachers at a number of schools noted that it was difficult to get some students to participate in their teams. Behavior issues increased as a result, according to the teachers, due to insufficient adaptability of the program.
Cross-grade grouping and quarterly assessments
Structural implementation of cross-grade grouping
In 4 of the 16 studies, it was reported that not all schools managed to implement the SfA-specific cross-grade ability grouping (Datnow et al., 2003; Klingner et al., 2006; Tracey et al., 2014) or that students were placed in the wrong group (Miller et al., 2017). In similar vein, facilitators in the study of Quint et al. (2015) reported taking other criteria into account during grouping than reading level alone.
Factors affecting the implementation of the cross-grade grouping and quarterly assessments
Hindering factors for the implementation of the cross-grade grouping and quarterly assessments were most frequently found at the level of the innovation. In the study of Klingner et al. (2006), regrouping was not experienced positively when young and older students were grouped together. First graders were experienced as being motivated and on-task, whereas the older students were turned off and unruly—being an unfortunate example for the younger students in the group. Hence, there are reports of several classes, referred to as “dumping grounds” (p. 341), containing students of multiple reading levels. This is viewed as an innovation characteristic, as there is insufficient adaptability to learners’ needs and skills. This is presumed to be the reason of the finding in the study of Quint et al. (2015) in which it was reported that other factors (student social skills, age, and teacher competence) were taken into account, specifically to avoid placing students in classes where they would be much older or younger than the rest. A possibly hindering factor in the implementation of the grouping procedures identified in the research of Klingner et al. (2006) was the fact that teachers considered it problematic that they did not get their own students for SfA (as during SfA, they teach ability levels rather than their homeroom), leaving them feeling “powerless” (p. 343). For these teachers, the design of the reform was not compatible with teachers’ pedagogical preferences. Another possibly hindering factor pertaining to implementation of the assessments specifically was identified in the study of Klingner and colleagues (2006). Here, teachers reported to believe that the determined reading level (the outcome of the assessments) was “incorrect” (p. 341), indicating a lack of fit between the needs of students and the design of the program (in this case: insufficient adaptability). This was also reported by teachers in the study of Quint et al. (2015).
A problem in the organizational capacity of the school was mentioned in two studies. In the study of Miller et al. (2017), the logistics around staffing the smaller reading groups and the space required to accommodate a large number of groups was considered a challenge to implement the program. Staff members at half of the schools in the research of Quint et al. (2015) noted that sometimes either too few or too many students tested into a certain category to create classes of equal sizes—although we would like to acknowledge that we could not discover “equal class size” to be a requirement provided by SfA.
An influential factor at the level of the community was the following. In the study of Datnow and colleagues (2003), the problem of not succeeding in the realization of grouping-by-reading-level pertained specifically to the placement of LEP students. LEP students were not allowed to be regrouped if their teacher was not English as a Second Language (ESL)-qualified due to district regulations, resulting in these students being grouped together rather than being grouped in accordance to their reading levels.
In the study of Quint et al. (2015), a factor that hindered the implementation of SfA’s cross-grade grouping was the conclusion that not all SfA teachers had the required (classroom management) skills—a provider characteristic. Here, a number of facilitators indicated that they tried to assign students who were having an especially hard time to teachers they considered to be more able.
Reading tutors
Structural implementation of tutoring
The implementation of tutoring is not as straightforward as might be expected: Different studies reported different structural issues. In two studies (Klingner et al., 2006; Quint et al., 2015), it was reported that not all schools had the capacity to tutor 30% of first graders, 20% of second graders, and 10% of third graders, which is specified in SfA guidelines. Interestingly, several schools were found to tutor to students in higher grades as well rather than mainly those in the early grades (Quint et al, 2015). Three studies discussed the qualifications of the tutoring staff. A study in the United Kingdom reported the use of volunteers (Hopkins et al., 1999). The U.S.-based study of Datnow and Castellano (2000b) mentioned the use of non-credentialed staff (in addition to certified teachers). In contrast, Chambers et al. (2008) reported tutors meeting the required qualifications (i.e., certified teachers or paraprofessionals).
Three studies reported on implementation issues of supporting software programs. In the report on Alphie’s Alley (one-to-one tutoring), a distinction is made between the program being fully implemented, partially implemented, and poorly implemented (Chambers et al., 2008). Because of these labels (“poor” indicating a lack of quality, while “fully” and “partially” indicate a certain quantity), this is conceived as a mixture of structural and process dimensions of implementation. The number of schools or tutors assigned to these labels was not mentioned unfortunately nor were reasons for these differences. In the study on Tutoring with Alphie (the UK version for one-to-one tutoring), 15 of the initial 21 schools dropped out of the study due to serious software problems (Biggart et al., 2015) that were detailed further on. The small number of schools that were identified as “delivering the program” were still considerably behind in the completion of the intended number of sessions. Quint et al. (2015) studied the implementation of Team Alphie (small-group tutoring). Only 9 of the 19 SfA schools implemented this program in the third year of implementation. The authors did acknowledge that this finding does not entail that schools did not provide tutoring. They were, for example, found to use other tutoring programs.
Factors affecting the implementation of tutoring
Hindering factors for the implementation of tutoring most frequently pertained to the organizational capacity. The first reason negatively affecting implementation was the following. The majority of principals surveyed in the research of Quint and colleagues (2015) indicated not being able to implement tutoring because of insufficient funding and/or staffing. It might be that because of this issue, alternative resources were sought or that qualifications were dropped. A second concern on logistics was also labeled at this level. Teachers in the study of Ross and colleagues (1995) expressed their concerns about the logistics of pulling students out of regular class, even during support activities (as students are not allowed to be pulled out during language arts or mathematics). A third factor labeled at this level that negatively affected implementation was insufficient IT capacities of several schools in the study of Biggart et al. (2015). In that same study, it was discovered that teaching assistants found it difficult to find sufficient time to be released from class or attain general technical support with computers pertained to organizational capacity as well as provider characteristics.
Two innovation characteristics were identified in the study of Biggart et al. (2015). The first one pertained to software problems, where the program that was introduced in schools had not sufficiently been piloted, and thus not suitable to the needs of the students (i.e., the adaptability argument). The second one pertained to the timing of program (toward the end of the summer term); this was another barrier to smooth program delivery. At this time, there were many competing activities as well as schools experiencing not benefiting from improved results—therefore, the program was not compatible with a school’s existing goals for that time frame resulting in schools not feeling the need to invest in the program (Biggart et al., 2015).
In the report of Quint et al. (2015), the use of other tutoring programs was mentioned, which were “provided or required by their districts” (p. 36), qualified as a community characteristic.
Students with special needs
Factors affecting the implementation of the SfA-specific approach for students with special needs
None of the 16 studies discussed the structural implementation of SfA’s approach for students with specials needs—that is, doing whatever it takes in order to deal with students’ reading disabilities and/or learning problems within the context of the regular classroom, with the help of tutors. Only one publication addressed hindering factors for this component. Klingner and colleagues (2006) observed several older students not able to progress to higher levels, while being left without tutoring or other additional support. The authors report that they were taught by the “least qualified or least effective teachers” (p. 341), needing to recycle through the same materials, leaving students bored and frustrated. Where the lack of fit (i.e., adaptability) between the needs of students and the design of the reform is qualified as an innovation characteristic, a lack of skill is identified as a provider characteristic. We would like to acknowledge that this component is highly intertwined with the cross-grade grouping issues identified earlier.
Components addressing non-instructional issues that affect learning
Schoolwide Solutions Network
The Schoolwide Solutions Network pertains to the teams that target (1) Parent and Family Involvement, (2) Cooperative Culture, (3) Attendance, (4) Intervention, and (5) Community Connections. The Parent and Family Involvement team is the only team that has been discussed in multiple studies. Therefore, we will discuss this team separately, and the other teams together.
Structural implementation of the Parent and Family Involvement team
The report of Quint et al. (2015) is the only report in which the entire schoolwide solutions-structure was studied. Here it was found that, by the third year of implementation, the teams were in place in 16 of the 19 participating SfA schools. The authors did acknowledge that many schools had already been provided with “family liaisons” by their district prior to starting with SfA. A similar comment was made in the study of Ross and Smith (1994).
Information on the structural implementation of the Parent and Family Involvement team—also referred to as Family Support team—shows a varying picture. Datnow and Castellano (2000b) discuss that the Family Support team component was established in their two schools under study, whereas Klinger et al. (2006) identified that it was not in place in two schools, and only met sporadically in two other schools. Both in the United States in the study of Ross and Smith (1994) and in the United Kingdom in the study of Hopkins et al. (1999) it was indicated that less success than had been anticipated was realized in involving parents in school governance and classroom activities.
Factors affecting the implementation of the Parent and Family Involvement team
In two studies, it was described that school staff had little information or seemed unsure about the purpose of the Parent and Family Involvement team (Klinger et al., 2006; Ross & Smith, 1994). This was qualified as an innovation characteristic, in which the compatibility with a school’s mission was under pressure—due to unclarity.
Structural implementation of the other Schoolwide Solutions Network teams
The report of Quint et al. (2015) is the only report in which the other teams in the Schoolwide Solutions Network are studied. Here it was found that, by the third year of implementation, the teams were in place in the majority (varying between 13 and 17) of the 19 participating SfA schools. The authors do acknowledge that many schools had similar teams already working in the schools prior to SfA. None of the studies looked into factors facilitating or hindering the implementation of these teams.
Focus on continuous improvement
Program facilitator
Structural and process dimensions of implementing of a program facilitator’s job
In two studies, it was noted that the majority of the facilitators worked full-time (Datnow & Castellano, 2001). In the study of Ross et al. (2004), one large school had employed two full-time facilitators in one school, whereas the other school in the study was lacking a full-time facilitator. Moreover, in most schools included in the study of Quint et al. (2015), facilitators were found to have other responsibilities as well. In some schools (Datnow & Castellano, 2001), facilitators were working only 4 days a week or on campus 3 days a week. As aforementioned, a half-time facilitator was reported in (two) UK-based studies (Hopkins et al., 1999; Jolliffe, 2006). Quint et al. (2015) compared the implementation scores of the schools with and without facilitators: Schools without a facilitator received an average implementation score of 59% of the maximum possible score, whereas schools that did have a facilitator had an average implementation score of 89% of the maximum possible score. A similar pattern—though focusing more on the process implementation than structural implementation—was reported by Datnow and Castellano (2001). The one school that struggled with its implementation of SfA had a facilitator that was judged by the authors not to be as strong in comparison to the other five schools.
Another, more qualitative (i.e., process) finding, is reported in three studies (Quint et al., 2015; Ross & Smith, 1994; Ross et al., 1995), in which the vast majority of teachers was very positive about the quality of the facilitator support. Unfortunately, these data cannot be corroborated with data from external observers. And as aforementioned, the program facilitators in the study of Datnow and Castellano (2000b) were found to tolerate adaptations, to ensure support for SfA among the teaching staff. This is qualified as a structural feature, as it affects the dosage of the reform.
Factors affecting the implementation of a program facilitator’s job
Funding issues, labeled as issues of organizational capacity, negatively influenced implementation in two U.S. studies (Datnow & Castellano, 2000b; Quint et al., 2015). A factor that positively influenced implementation was finding “the right type of person for the job,” as identified in one study (Datnow & Castellano, 2001). This is qualified as a provider characteristic.
Leading for success
None of the studies investigated the implementation of the Leading for Success-structure at the school level or factors that affected implementation.
Training and coaching
Structural and process dimensions of implementing training and coaching
There is quite some variation in the amount of training and coaching described in various articles. Miller and colleagues (2017) reported 16 days of training and support, which spread over two years. Datnow and Castellano (2001) reported teachers received 3 days of training before implementation began, and facilitators and principals received 5 days of training. Hopkins et al. (1999) described tutors and teachers receiving 2 days of training from SfA coaches prior to the start of the year and several in-service sessions throughout the year. This in-service support was quantified in other studies as biannual implementation visits (Datnow & Castellano, 2001) or triannual implementation visits during the school year (Chambers et al., 2008). The majority of survey respondents in the study of Miller et al. (2017) indicated receiving sufficient ongoing support, but this could not be corroborated with the interview data in that study. In the report of Quint et al. (2015), an even more variable image was described—as not all schools received training prior to the implementation of SfA nor was there a consistency in the duration of training and support (ranging between one and three years for the entire length of the study).
The quality of the work of the SfA coaches—including training and coaching—has never been rated by external observers. Teachers, facilitators and/or principals rated the quality of the training positively in three publications (Datnow & Castellano, 2000b; Hopkins et al., 1999; Miller et al., 2017), although in the interviews of Miller et al. (2017) it was contextualized by adding the importance of “doing it was the way to really learn it” (p. 28). In contrast, teachers in the study of Ross and Smith (1994) noted that the training did not adequately prepare them to deal with the cooperative and independent learning components. Jolliffe (2006) also reported an ongoing need for training on the underlying ethos of cooperative learning. The general model for professional development was rated positively in the study of Ross et al. (2004). In two studies, the SfA coaches themselves were described as being knowledgeable (Cooper et al., 1998; Datnow & Castellano, 2000b). Interestingly, many teachers in the same study of Datnow and Castellano (2000b) felt uncomfortable about the implementation visits by SfA coaches, as they worried they were not doing things properly. In Datnow and Castellano (2001), some principals reported trying to buffer teachers from SfA coaches' criticism, in their effort to ensure stability of SfA in their schools. But then again, in Miller et al. (2017), several teachers reported the ongoing support as very helpful—pertaining to the feedback that was given by the coaches, the targets the teachers had to reach and the continual e-mail support.
The training of tutors and use of the tutoring program was generally experienced positively in the UK study of Biggart et al (2015). However, as some sessions were conducted at schools without passwords to log onto the program, this resulted in a lack of “hands-on” experience (Biggart et al., 2015).
Factors affecting the implementation of training and coaching
Three stimulating factors for the implementation of training and coaching-component of SfA were qualified at the level of training and technical assistance. Given the mixed experiences in the quality of the training and coaching, a possibly stimulating factor pertains to “finding the right person for the right job” in the case of SfA coaches. We qualified this as an issue of training and technical assistance as it pertains to the work of the SfA Foundation (and not at the provider-level as this level pertains to the teachers that are providers of the programs). It is considered a potentially stimulating factor, deduced from the fact that five studies reported positive experiences compared to two studies that reported room for improvement. A potentially stimulating factor was identified in two studies in which facilitators formed a mutually supportive group, sharing difficulties and addressing problems at the school level (Hopkins et al., 1999; Ross et al., 2004). A third possibly stimulating factor was participation in the national conference, where the workshops offered there are described to deal with the technical day-to-day realities of implementing school reform (Cooper et al., 1998).
Instructional component teams
The information on the instructional component teams is limited. In two of the sixteen studies, it was reported that meetings of these teams were held (Datnow & Castellano, 2000b; Quint et al., 2015). None of the studies looked into facilitating or hindering factors.
Added category: Leadership style of the principal and other issues of power influencing implementation
Factors affecting the implementation pertaining to the leadership style of the principal and other issues of power
As this category does not pertain to an SfA-specified component, no information on its structural implementation can be provided. We created this category as we deduced it from our data as an aspect that can potentially stimulate or hinder implementation. It was qualified as pertaining to the level of organizational capacity in two cases. First, in the study of Datnow and Castellano (2001), there was variation in how principals’ leadership styles meshed with the demands of the reform. The principals’ ideologies and leadership styles influenced how they interacted with teachers and facilitators with respect to SfA and also influenced implementation. Datnow and Castellano (2001) concluded that there was variation. “However, almost all of the principals made efforts to support implementation wholeheartedly. They appeared to understand the importance of their role as leader of the school and of the reform” (p. 233). It was therefore qualified as a stimulating factor. The second factor at this level pertained to ownership of the participating teachers. Despite the 80% vote, genuine consensus among teachers to adopt SfA was not apparent in the studies of Datnow and Castellano (2001) or Cooper et al. (1998), even though the importance of commitment to reform through, for example, staff discussion was discussed by principals in the latter study. We consider the lack of genuine consensus a hindering factor.
Furthermore, support (Cooper et al., 1998) and even strong pressure from the district (Datnow & Castellano, 2001) were reported as strong influencers in the decision to commence with the SfA reform, which are categorized here as a community characteristic. As we associate support as a positive feature (based on one study), but pressure as a negative feature (based on one study as well), we qualify this factor with the “±” symbol in Table 5, in which the results are summarized.
Summary of results pertaining to the number of factors that stimulate or hinder implementation using Durlak and DuPre’s (2008) framework.
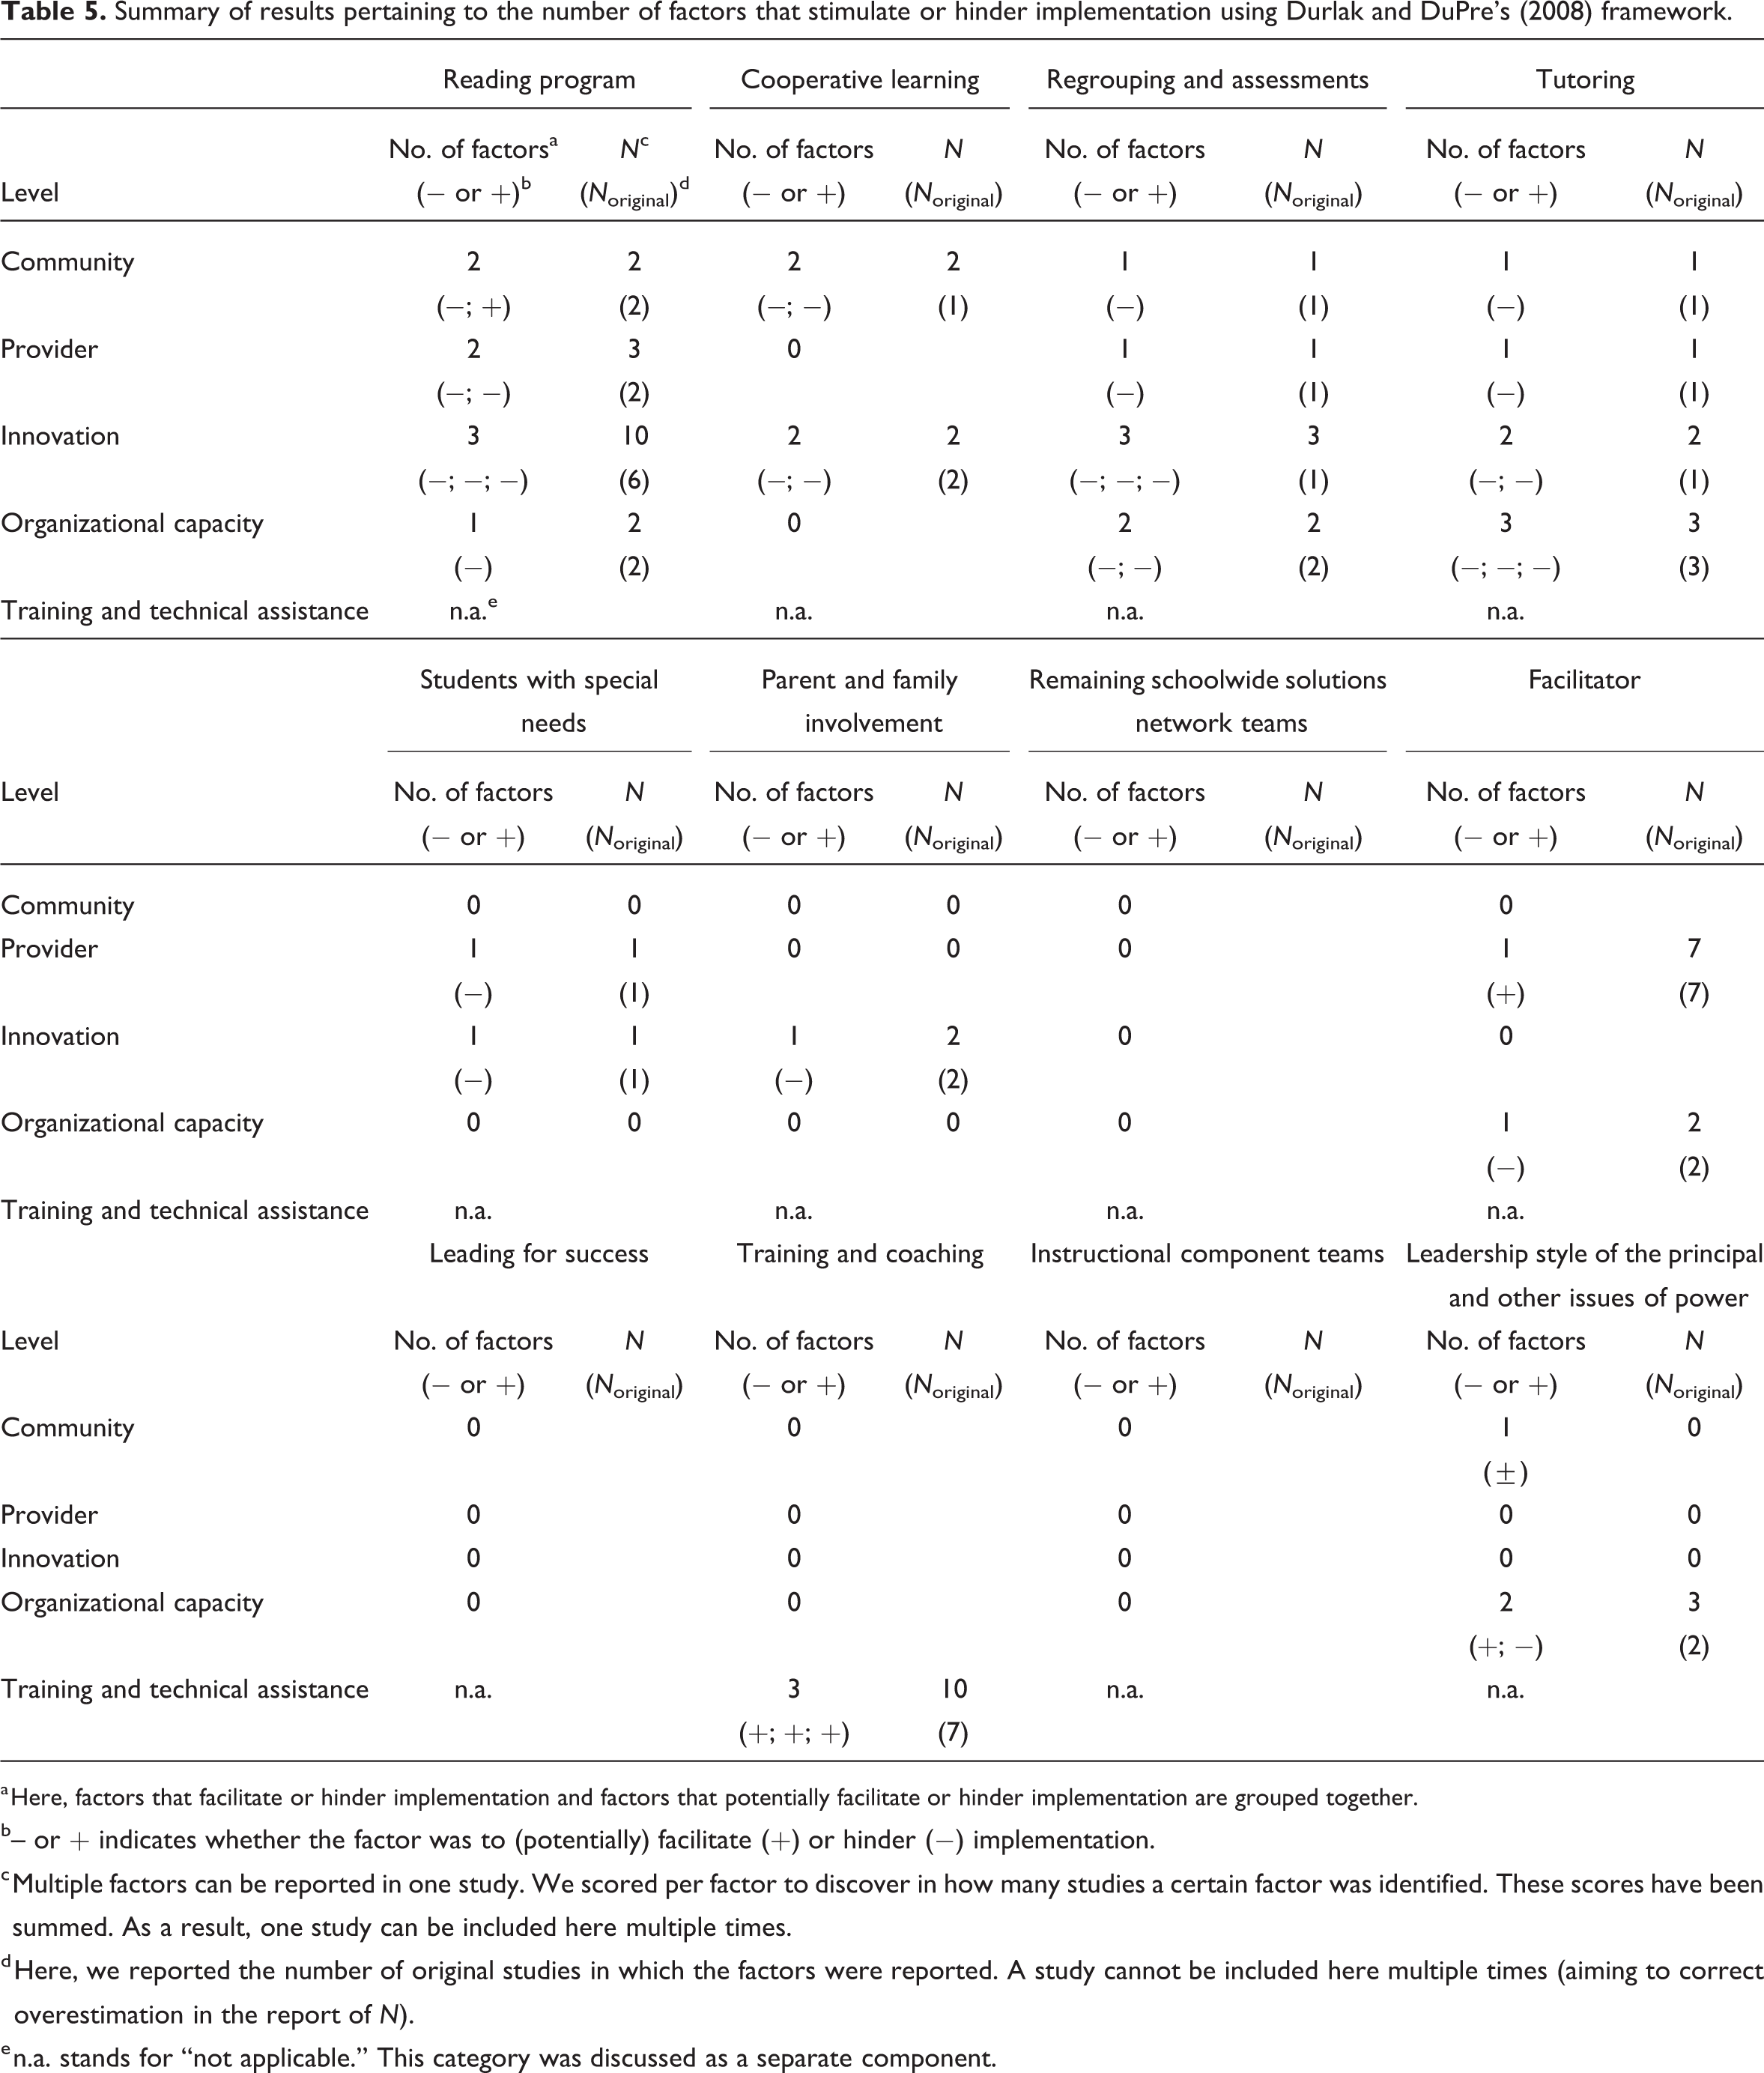
a Here, factors that facilitate or hinder implementation and factors that potentially facilitate or hinder implementation are grouped together.
b– or + indicates whether the factor was to (potentially) facilitate (+) or hinder (−) implementation.
c Multiple factors can be reported in one study. We scored per factor to discover in how many studies a certain factor was identified. These scores have been summed. As a result, one study can be included here multiple times.
d Here, we reported the number of original studies in which the factors were reported. A study cannot be included here multiple times (aiming to correct overestimation in the report of N).
e n.a. stands for “not applicable.” This category was discussed as a separate component.
In Table 5, one can see that the majority of stimulating and hindering factors for the 14 components of SfA have been identified at the level of the innovation. We will discuss this finding more extensively in the following paragraph.
Conclusion and discussion
In the current review study, we investigated the implementation of the evidence-based program SfA, a whole-school reform containing 14 components, that has been demonstrated to have a positive impact on student outcomes in a large number of studies. In prior studies, its implementation had been investigated to a limited extent, focusing on different SfA-components and using different designs. Our goal for this study was to add to the body of knowledge on SfA’s implementation and identify factors facilitating or hindering implementation using studies from the United States and the United Kingdom. We distinguished between process (qualitative) and structural (quantitative) aspects of implementation, following the work of Harn et al. (2013). Factors that (possibly) explained this degree of implementation were coded using the framework proposed by Durlak and DuPre (2008) containing factors at the level of (a) community, (b) provider, (c) intervention, (d) organizational capacity, and (e) training and technical assistance.
Of the 66 publications initially found, only 16 studies were included in our review. For the issue of implementation measurement, we found it striking how little information on actual behavior or conduct was provided per component, even though this appears to be a common problem in the field of educational research (Swanson et al., 2013). Particularly information on the process dimension of implementation, that is, the quality of implementation, was missing in the studies under review, again consistent with the review results of Swanson and colleagues (2013).
That being said, general fidelity measures provided in seven articles indicated that 48% of the participating schools in the United States and the United Kingdom in those studies implemented SfA at the minimal level (receiving a “+/−” rating), 45% at a more advanced level (receiving a “+” or “++” rating) and 7% at an insufficient level. Here, we would like to acknowledge the complexity of synthesizing implementation information due to scaling issues. Researchers of studies included in our review used different terms and labels to describe the degree of implementation without clearly defining them (using terms like “fair” or “medium”) or made use of implementation scores provided by SfA coaches, in which the implementation of SfA was identified as a developmental model, going from “mechanical” to “routine” up to “refined” (Success for All Foundation, 2014). We used the label “minimal” to describe the “+/−” rating as there is room for improvement. If we would consider only these results—together with SfA’s well-established effectiveness—one could deduce that minimal implementation of such an extensive whole-school reform might already be beneficial for student outcomes. This might imply a stronger “potential” of SfA for improving student outcomes if the program is implemented to a positive (+) or advanced (++) level.
If we consider the results we qualified as “structural features of implementation,” a varied picture emerges. In some studies, schools succeed in meeting certain SfA-requirements, while in other studies schools do not, for example, meeting the 90-min requirement, hiring tutors with sufficient teaching credentials, or hiring a full-time facilitator. The positive impact of the program facilitator was clearly quantified in the study of Quint et al (2015).
If we consider the factors we identified to facilitate or hinder implementation, we would like to acknowledge that the vast majority of factors that affected implementation were factors that (were expected to) impede implementation rather than stimulate it. Only 3 of the 37 factors in total were identified as stimulating factors. Perhaps there is a negativity bias: When schools and teachers are interviewed on their experiences in working with SfA, the focus might be on aspects that could be improved rather than those that are working well. Or perhaps this is caused by scientific journals, preferring manuscripts specifying information on what can be improved rather than those indicating what is going well.
In our review, 33% of all factors were classified as an innovation characteristic (n = 12, for a total number of 37 identified factors). Its subcategories “adaptability” was mentioned slightly more frequent (n = 7) than “compatibility” (n = 5). The strength of this reform—an extensive, scripted reform—might also have negative side effects, as school staff might experience that its content might not be applicable in their context, either pertaining to their students or their own professional preferences. Or perhaps schools that sign up for working with SfA are unfamiliar with the SfA’s underlying program theory (Rossi et al., 2004), implying that the procedure used to inform schools that are considering working with SfA needs further work. As reported earlier, genuine consensus for working with the program was not apparent in studies included in our review, despite the SfA-requirement of 80% of school staff being positive about starting with the program prior to working with it.
Factors impeding implementation of the program at the organizational level were reported nine times in total. Factors impeding implementation of the program at the community level were discussed seven times, and provider characteristics were mentioned six times. Training and technical assistance were mentioned merely three times. We scored these factors in our efforts to disentangle essential preconditions for successful implementation (see, e.g., Linnan & Steckler, 2002), but more work needs to be done in order for this goal to be attained. Given the fact that the majority of issues hindering implementation pertained to the design of the reform, we would like to turn to what is referred to as the adaptability versus fidelity-debate. Durlak and DuPre (2008) made the case that, even though frequently described in either-or terms, fidelity and adaptability can co-occur. Datnow et al. (1998, in Klingner et al., 2003) described the importance of “mutual adaptation”: implementing a strategy to fit the unique needs of the school context without losing sight of the strategy’s original purpose. A similar approach was recommended by Harn et al. (2013). An implication for practice would be the recommendation for explicated guidelines provided by SfA on essential components and concrete descriptions of adequate levels of implementation as well as “negotiables” to facilitate a better fit between schools, the needs of their students and the content of the reform, in an effort to smoothen the implementation process. For instance, the relentlessness in the implementation of the program, as promoted by Slavin and Madden (2012) can be experienced by others as rigidness (e.g., Datnow & Castellano, 2000b); through co-creation between developer and provider, this might be improved. We find that this recommendation can be particularly valuable for countries such as the Netherlands, Germany, and South-Africa that are exploring the value and feasibility of implementation of this whole-school reform in a new context.
For successful implementation of the SfA program, but that may also hold for other evidence-based whole-school reform programs, the crucial factors appear to be leadership both at the school and the district level, fulfilling necessary organizational and resource conditions, initial and continuous staff development, and relentlessly implementing all 14 components together.
Limitations
We would first like to acknowledge that it might be that variation in implementation identified in articles could be an artifact of SfA evolving over time. Even though we are not under the impression that more recent publications are more positive than relatively dated ones, it could be that we overlooked changes and improvements over time. Future studies should include this information on the content of the program at certain time points.
Differences between results of studies conducted in the United States and the United Kingdom might be due to differences in the SfA content, to differences in context or both—as was the case for the UK computer tutoring program. A more in-depth contextualization was considered to fall outside the scope of the current review.
A further limitation is that the policy context is changing, and that the studies we included and used in this review, describe program functioning in schools 10 years or even longer ago. In the meantime implementing evidence-based programs has become more mainstream and, moreover, tool kits for schools to implement these programs properly have become available (e.g., Sharples et al., 2019).
Furthermore, we would like to acknowledge that we did not require certain research designs for the studies included in our review. Our aim was to derive a better understanding of all types of issues that could be encountered when implementing SfA, even though there are arguments for only including those studies with a longitudinal design. As Harn et al. (2013) pointed out, fidelity should not be considered a stable construct given the “often unpredictable and sometimes chaotic realities of schools and classrooms” (p. 184). School contexts are known to change over time due to, for example, staff turnover as was identified to be an issue in several studies included in our review.
Finally, we would like to acknowledge that much of the information provided in the articles under study—for example, a certain behavior, viewpoint, or experience—was presented in a way that is very difficult to quantify (e.g., “some teachers,” “a few times”). By only referring to the number of articles that mentioned a certain conduct, it might be that the experiences of a (perhaps a very small) minority are reported and thus overemphasized in our research.
Implications for further research
Harn and colleagues (2013) discussed a so-called fidelity-threshold, in which the implementation of a program “above 60 percent” will not add additional value to the effects on student outcome. This is in contrast to prior research on SfA where higher degrees of implementation were found to correlate with higher student outcomes (e.g., Hopkins et al., 1999; Ross et al., 1997). Given the recommendation of mutual adaptation, this should be investigated further empirically to investigate what levels of fidelity and implementation result in the highest effects for students as well as implementation feasibility. On a related note, Klingner et al. (2006) concluded that “good teachers make good SfA teachers” (p. 338): Teacher quality and the quality of the lessons taught should be studied to a more detailed extent, so that possible contributions of fidelity as well as adaptations are better linked to student outcomes. Moreover, mutual adaptation might also ensure a better starting point for schools and teachers; the required buy-in procedure of 80% support vote prior to the start of SfA does not ensure genuine buy-in beforehand (Datnow & Castellano, 2000a), while buy-in is recommended for implementation quality and quantity (also in Meyers et al., 2012).
A second recommendation would be to further explore the content, quantity, and quality of the work of the SfA coaches as well as their relationship with the schools. In the work of Harn et al. (2013) differentiated coaching is recommended, in which a distinction is made in the approach of experienced versus beginning teachers. More in-depth information in the context of SfA would be considered valuable.
Footnotes
Declaration of conflicting interests
The author(s) declared no potential conflicts of interest with respect to the research, authorship, and/or publication of this article.
Funding
The author(s) received no financial support for the research, authorship, and/or publication of this article.
Contributorship
Mechteld van Kuijk conceived the present idea, and developed it further with Marijke Mullender-Wijnsma and Roel Bosker. van Kuijk did the literature search and initial review, and wrote the first version of the manuscript. Whereafter it was critically revised by van Kuijk, Mullender-Wijnsma, and Bosker.