
Abstract
While paper mail-based surveys avoid much of the risk of bots and fraudulent data, they suffer from lower response rates and ever-inflating material and logistical costs. In response, there is a nascent, but growing literature investigating a lower cost, explicitly anonymous, mail-based survey distribution method called Every Door Direct Mail (EDDM). This study contributes to this growing body of literature by using EDDM to disseminate a sequential mixed-mode census-style survey that meets best use-case recommendations per past research. We make several design alterations to elicit higher response rates including using an outer envelope and cash incentive. The survey, distributed near large-scale solar developments in three urban Michigan communities (~1554 households), was geographically based, targeted a specific and limited population, and covered the potentially sensitive topic of local solar development, which may have also led to a higher response rate. The survey achieved an overall response rate of 10.2% with 158 complete surveys returned, demonstrating this work’s usefulness, use case, and flexibility.
Introduction
Mail surveys that use both paper contact and response modes have certain advantages over telephone and web-based survey methods. Compared to telephone surveys, paper surveys provide respondents greater anonymity, better accommodate ranking and more complex questions that can use visual design, and have demonstrated higher response rates (Dillman, 2017; Grubert, 2017; Olson et al., 2021; Stedman et al., 2019). Compared to web-based surveys that use online distribution and response modes, paper surveys have been shown to result in higher response rates (Daikeler et al., 2020; Gigliotti, 2011; Levi et al., 2022; Sakshaug et al., 2019; Shih and Fan, 2008), be better at reaching small or specific populations not reachable via the Internet (Grubert, 2017), potentially reduce satisficing and straightlining (Kim et al., 2019), and be less likely than emails to be overlooked or routed to spam folders (Daikeler et al., 2020).
Paper surveys also avoid the issue of “bots” and other causes of fraudulent survey data that currently plague online non-probability surveys (Agans et al., 2024; Bell and Gift, 2023; Gonzalez et al., 2023; Goodrich et al., 2023; Kennedy et al., 2020; Levi et al., 2022; Thompson and Utz, 2024), even corrupting one survey that was judiciously distributed to Master of Social Work students in accredited social work programs in the US (Irish and Saba, 2023). Internet bots or software created to automatically complete specific tasks (Eslahi et al., 2012) can lead to high rates of fraudulent survey responses that appear legitimate. Bots, along with other online technology that can be used to bypass safeguards such as virtual private networks and virtual private servers, present an increasingly prevalent threat to the quality and authenticity of online survey responses (Griffin et al., 2022). Although there are some measures available for preventing and removing fraudulent responses, there is no perfect strategy (Roman et al., 2022; Yarrish et al., 2019) and bots and other fraudulent online survey strategies continue to increase in sophistication (Agans et al., 2024). One foolproof strategy of reducing bots’ influence is to avoid the Internet and rely instead on mail-based paper surveys.
There are drawbacks to mail-based paper surveys: specifically, a significant decline in response rates over the last few decades, in some areas dropping from an average of 77% in the 1970s to 43% in the 2010s, to a projected 21% response rate in the 2030s (Stedman et al., 2019). Others support these findings: (Olson et al., 2021) reported 20% response rates on average, while a recent test by (Greenberg and Dillman, 2023) of different communication techniques achieved survey response rates near 25%. Additionally, material costs for physically disseminated surveys are much higher than web-based surveys (Campbell et al., 2018) and continue to increase. Since 2016 Consumer Price Index (CPI) inflation has been approximately 30.2% (BLS, 2024). The CPI does not account for more significant price increases in relevant sectors, such as thosse occurring in the printing and paper industry due to issues with high energy and raw material costs in the last few years (Dillon, 2022; Wallin, 2022).
Mail-response mode surveys can also become quite long due to a lack of automation that can help simplify or abbreviate complex skip logic, resulting in relatively more missing data and errors (Olson et al., 2021). Additionally, mail-based (both contact and response-mode) surveys require additional time and cost—and potential errors—associated with data input and processing, and seem increasingly at odds with the amount of time especially young respondents spend online (Martin, 2021). Finally, relative to electronic surveys, paper surveys may have significant environmental costs to consider, including paper, ink, printing services, and transportation—and the emissions associated with each, particularly as the size of a survey increases.
With this in mind, it is important to investigate various mail-based paper survey methods that can provide quality data and sufficient response rates, but also minimize cost. Below we describe a case study using Every Door Direct Mail (EDDM). We describe the three study sites used for this research, alterations that were made over past work in survey design, and an analysis comparing the current use of EDDM with both previous EDDM uses and a traditional mail-based survey that examined a similar study topic. While not intended to solve the problem of declining survey response rates overall, here we aim to increase the response rate and reduce costs of one mail-based survey method in particular.
Every Door Direct Mail
EDDM is a United States Postal Service (USPS) census-style, mail postal-route saturation program (meaning all households on a particular postal route receive the mailing) designed for marketing. EDDM is advertised to small businesses, restaurants, and realtors as a way to affordably reach local customers without having to compile an address list (USPS, 2017). Users of the program can select specific USPS mail routes to send their mailings at the current (2024) rate of $ 0.203 for EDDM Retail® USPS Marketing Flats. These less expensive rates necessitate most of the preparation and handling work needing to be done by users and specific limitations on mail-piece formatting (USPS, 2017). While intended for marketing, there is the opportunity for EDDM to be a suitable method to disseminate surveys, as demonstrated below.
Previous work has demonstrated that EDDM has both strengths and weaknesses over traditional addressed-mail surveys, depending on specific use cases. EDDM-based surveys are more anonymous, may solicit less sociable responses, are less resource-intensive (both labor and cost), and because they are distributed to every dwelling on a particular mail route (i.e. are census-style), they do not require manually addressing survey envelopes (nor relying on Mail Merge) and may generate samples that are more representative of the target population (Al-Muhanna et al., 2023; Grubert, 2019). At the same time, EDDM is unable to conduct household-level sampling and selective nonresponse follow-up; it requires minimum mailing size, and there is difficulty in calculating accurate response rates (Grubert, 2019). As a result, Grubert (2019) recommended EDDM for studies that are geographically based, resource constrained, focus on a specific or limited population, and examine a potentially sensitive topic.
In light of these considerations, we conducted a physical, EDDM-delivered mixed-mode census-style survey focused on eliciting residents’ perceptions of nearby large-scale urban and brownfield solar in 2023. Recent qualitative work looking at urban and brownfield solar perceptions has illuminated several concerns, in particular local officials and developers facing difficulty getting information to and from both urban and rural residents (Bessette et al., 2024). With this in mind, we chose EDDM as the mechanism for disseminating surveys here. While previous research has demonstrated the general efficacy of EDDM as a vector for surveys, EDDM has not yet been used as a way to distribute surveys to capture resident renewable energy perceptions or redevelopment preferences, presenting a unique case study opportunity. The case study not only builds on previous recommendations, by including a survey studying a sensitive and salient topic deployed in specific and small spatial areas (that are demographically diverse), but also allows us to compare our response rates and cost-to-response ratio to previous uses of EDDM (Al-Muhanna et al., 2023; Grubert, 2019).
Methods and materials
EDDM protocol
We first created a USPS account in order to utilize the EDDM USPS product (found here: https://www.usps.com/business/every-door-direct-mail.htm) and to place EDDM orders. Next the EDDM Online Tool was used to select mail routes immediately adjacent to the three solar developments (https://eddm.usps.com/eddm/select-routes.htm). Figure 1 shows the mail route for the first of the three solar developments; previous mail surveys examining residents’ perceptions of solar projects have intentionally oversampled residents living within 0.5 miles (Rand et al., 2023). 1
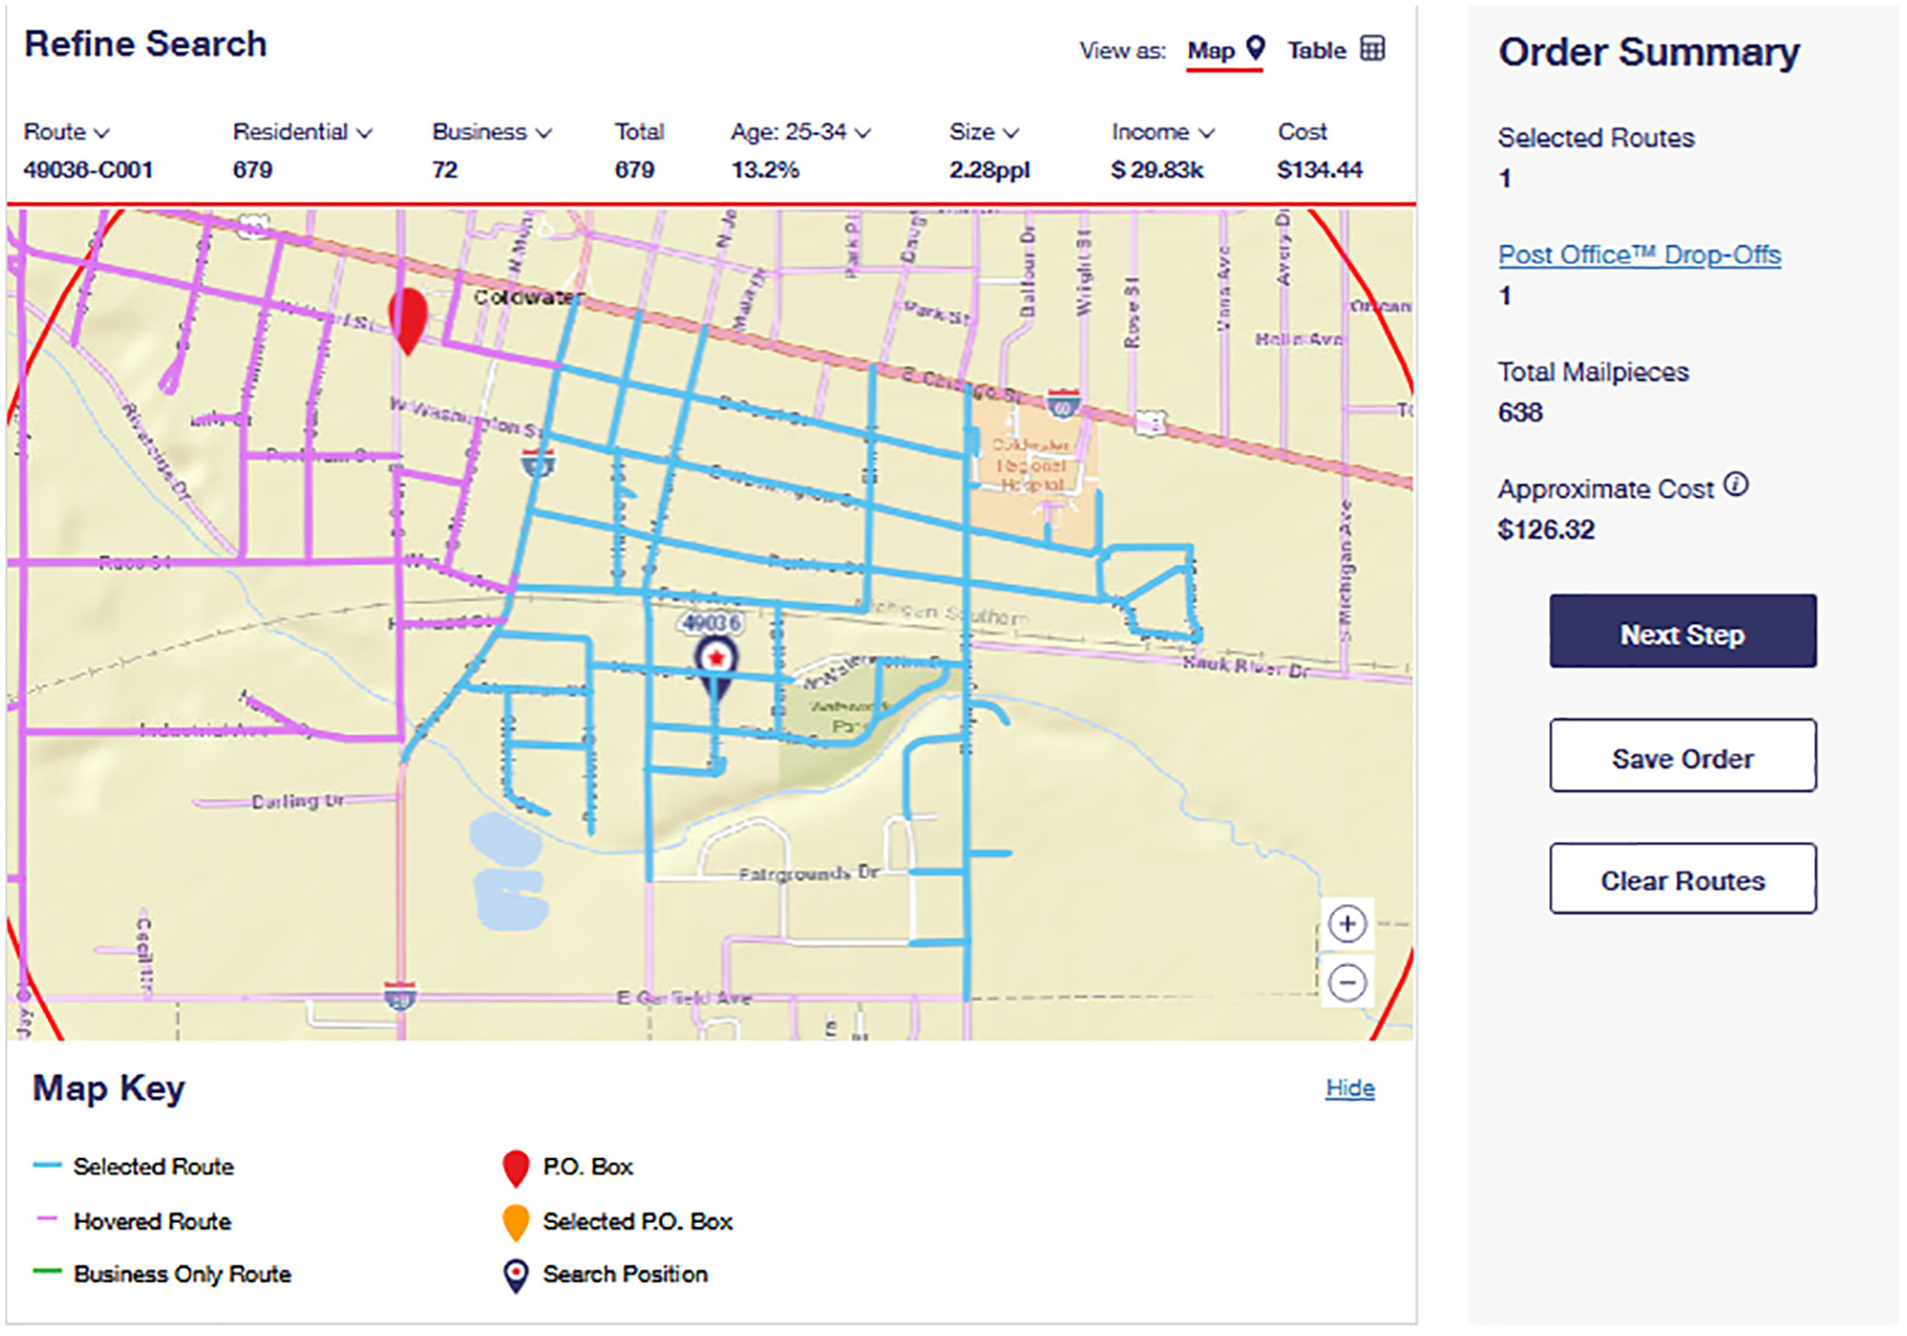
Coldwater USPS mail route surveyed. Red line is approximately one mile from solar development.
The mail pieces for the survey instrument were designed to meet the specifications for all mail sent via EDDM (exact measurements of mailers used in this research can be found below in section 2.3): flat with a thickness between 0.0007″ and 0.75″, a length between 3.5″ and 15″, a height between 3.5″ and 12″, and a weight of 3.3 oz or less. Height must be less than or equal to the length, and all mailers must meet one of the following three requirements: a length greater than 10.5″, a height greater than 6.125″, or a thickness greater than 0.25″. At the top right of the EDDM Online Tool the USPS provides a convenient tool called “Mailpiece Size Checker” for seeing if a mailpiece meets specifications. 2
With mail routes selected, and the number of needed mail pieces known and designed to meet EDDM specifications, a third-party print shop that advertised EDDM expertise was contacted, and materials were printed and assembled. Orders were made on the EDDM USPS webpage, requiring confirmation of the mail routes, selecting any filters for delivery (for this research the residential only filter was selected) and a drop-off date for handing the mailers over to the local USPS office (usually the closest office to the mail route selected), and finally payment options. We also prepared and organized the mailers for drop-off. For EDDM drop-offs, all mail pieces need to be bundled in stacks of 50–100, with no stack higher than 6″. Facing slips must be filled out and placed on the top of each bundle. Additionally, Mailing Statement-USPS Form PS3587 must also be filled out. Finally, survey mailers were dropped off at the local USPS offices for our three study sites. Researchers should note that USPS employees are allowed to open up EDDM mail and inspect the contents.
Case study topic, sites, and sample population
The characteristics of the case study topic, study sites, and sample population drove the selection of EDDM as a survey method. The survey covered a potentially sensitive topic: urban resident perceptions and preferences toward urban and brownfield large-scale solar development. Solar development, especially at larger scales, i.e., over 1 MW or covering land of at least five acres, can be and has been contentious, and a growing literature examines local resident and community opposition to the siting of large-scale solar (Bessette et al., 2024; Crawford et al., 2022; Ko, 2023; Nilson and Stedman, 2023). Throughout this work, concerns over who chooses to respond to surveys and interview requests, and whether their responses are influenced by their own social or political identity or that of the researcher have arisen. This condition encouraged an explicitly anonymous approach, like EDDM. EDDM surveys do not require identifying respondents by name or address on the envelope or survey.
Second, the populations targeted for this survey were specific and limited to a small spatial area. The three Michigan (MI) communities selected were all located immediately adjacent to urban solar developments—two were brownfield-solar projects. The sites in Cadillac and Coldwater, MI are both formally recognized brownfields by Michigan’s Department of Environment, Great Lakes, and Energy (EGLE) and were both previously the site of industrial manufacturing. The site in Detroit is not a recognized brownfield; however, it was disturbed land and prior to solar development was previously the location of a playground, sports fields, and a decommissioned recreation center (Schaap et al., 2019).
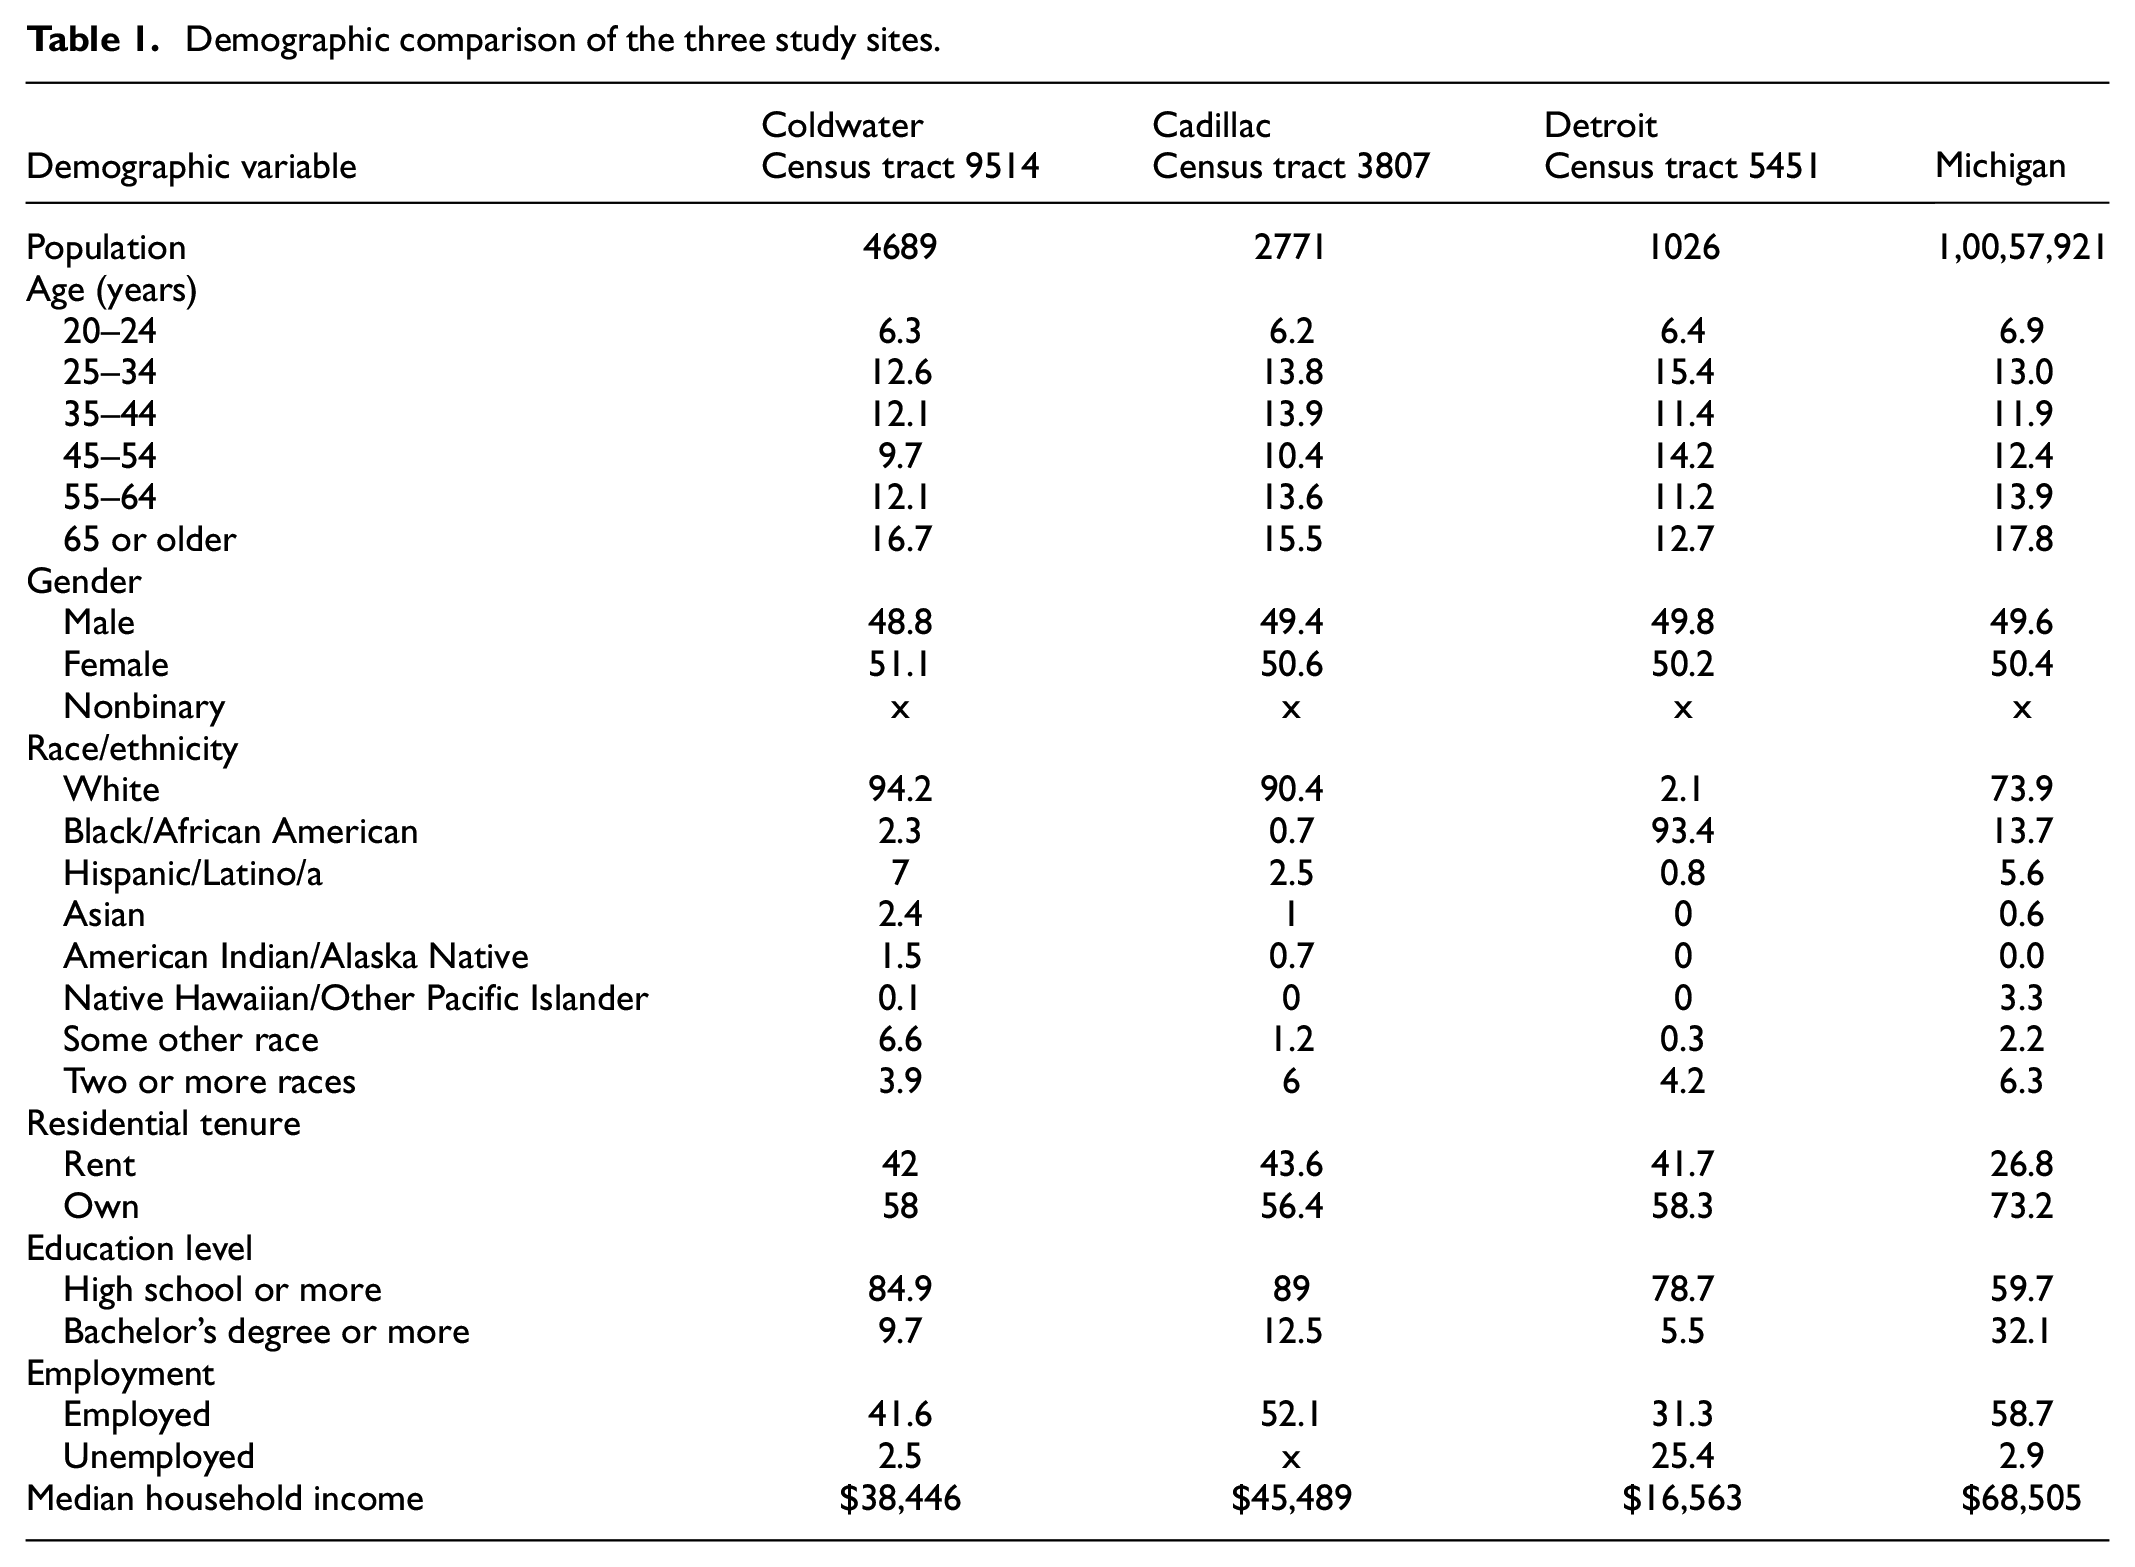
The three communities themselves were also diverse both demographically and in community history which allowed for comparison in EDDM response rates between different community demographic compositions and contexts. Coldwater is located in central southern Michigan and as of 2020 had a population of 13,822 people. Coldwater is predominantly white (~81%) and so is census tract 9514 that covers the area around the solar development (~88%). For a more complete breakdown of the 2020 census demographics for census tract 9514 and the two other census tracts mentioned below see Table 1 below. These data are a best-fit approximation of community demographics. Each of the 3 USPS mail routes used (i.e. Coldwater USPS route 49036-C004) is entirely within the census tract (9514: 1620 households) used for comparison. It should be noted that the largest minority population in Coldwater are Arab Americans (Barnes and Cialdella, 2017)—whom the federal government currently categorizes as white in the census (Kai-Hwa Wang, 2023). Nine percent of the Coldwater population is currently estimated to be Arab American (Zip Atlas, 2024). Cadillac is located in the Northwest region of Michigan’s lower peninsula. In 2020 its population was 10,371 people. The census tract covering the mail route (USPS route 49601-C005) used to survey the Cadillac solar development (census tract 3807: 1178 households) is predominately white (~90%) and similar in characteristics to the census tract in Coldwater. However, the median income in Cadillac is almost 20% higher. The final site surveyed was in Detroit, MI. The USPS mail route used (48227-C006) is entirely within census tract 5451: 330 households, which as of 2020 is predominately African American (~93%). The median household income in census tract 5451 in 2020 was $16,563.
Demographic comparison of the three study sites.
A final reason for selecting these three sites was the authors’ proximity to these neighborhoods. Being geographically proximate to study sites is not required for utilizing EDDM—researchers are able to ship boxed survey mailers to local USPS offices—however, it is ideal as dropping off survey packets and mailers directly to the USPS office that delivers them is key to minimizing cost. These three criteria, along with the conditions detailed above by Grubert (2019) positioned EDDM as an optimal method for disseminating paper surveys and for analyzing its efficacy in an optimal use case.
Survey design and procedure
A two-contact sequential mixed-mode approach was used to reach anonymous respondents along the three USPS mail routes. These mail routes were selected due to their immediate proximity to a solar project. Across all three sites, 1554 houses were intended for contact: 638 households in Coldwater, 459 households in Cadillac, and 457 households in Detroit. Differences between site samples were due to the size of the mail routes and the EDDM requirement that all households on a mail route be included.
Each of the 1554 households were intended to be contacted first with the complete survey packet, comprising an outer envelope (9″ × 2 ″; Supplemental Figure B1—Supplemental Appendix B), an eight-page survey questionnaire booklet (8.5″x 11″), a Business Reply Mail Envelope (8 7/8″ × 3 7/8″), and a crisp 2-dollar bill. Previous work using 2-dollar bills, as opposed to two 1-dollar bills, has suggested the former may improve response rates, particularly with farmers (Avemegah et al., 2021; Dillman et al., 2014; Glas et al., 2019; Groves and Couper, 1998; Mills, 2019). The 2-dollar bill was placed over the front page of the questionnaire and was oriented to be at the top of the outer envelope so the 2-dollar bill would be seen immediately when the envelope was opened (see Supplemental Figure B5—Supplemental Appendix B). No instructions regarding who in the household should respond to the survey were provided; this was done to simplify the survey, increase the response rate, and protect the anonymity of the respondent.
No addressing or stamping was needed on the outer envelope. Instead, an EDDM indicia provided by the USPS was printed on directly. Business Reply Mail (BRM) envelopes were procured through the University’s Mail Processing Department, thus the return address and required BRM markings came pre-printed. A label with the researcher’s departmental mail address was added manually to the BRM envelope via applied adhesive label (Brand: Avery, Item# 5160). These labels were purchased blank and printed via a personal printer using the 5160 Avery label template.
The initial survey packet did not include a link to complete the survey via the web. Instead, a post-questionnaire reminder postcard (9″ × 6.5″) was sent to every household after approximately two weeks. This reminder postcard included a QR code and URL for access to an online version of the questionnaire.
Response rates
Response rates were calculated using the American Association for Public Opinion Research (AAPOR, 2023) Response Rate 1 (RR1) formula (Figure 2):

Response rate 1 formula.
RR1 does not consider any undeliverable or ineligible surveys in its calculation and is simply the number of completed surveys over the total number of surveys sent out . For the purpose of calculating response rates in this research, an 80% completion rate of questions equaled a ‘complete survey’, 50%–80% completion of questions equaled a partial, and less than 50% equaled break off (AAPOR, 2023). RR1 was chosen due to the unique nature of EDDM surveys. Because EDDM is an anonymous USPS mail route saturation method, calculating undeliverables and household occupancy status is not possible. Additionally, RR1 was used previously to calculate response rate for EDDM surveys (Grubert, 2019).
Cost and time
All material costs and EDDM processes described here are from the time period of June 7th 2023 through November 15th 2023. Total costs reported include survey materials and costs, including printing, BRM envelopes, adhesive labels, and USPS mailing costs.
All survey preparation was timed via stopwatch including the stuffing of envelopes and the counting and organization of materials to be “EDDM ready.” Driving time was also calculated. Other times if noted are approximate, such as the purchasing of supplies and pre-survey research, including conversations with USPS employees, BRM test runs, and reading USPS EDDM regulations.
Demographics
Best-fit tract-level U.S Census data were compared with self-reported resident demographic data. Analysis was completed via simple division of the sample proportions by the census population proportions for each of the demographic characteristics, as done by (Grubert, 2019; see Table 3).
Results
Response rates
The overall response rate (RR1) for this survey was 10.2%, with a total of 158 complete responses out of 1554 surveys distributed. Eleven partial and seven break-off surveys were also returned. For Coldwater, the response rate was 9.9%, with 63 complete surveys returned (4 partials and 2 break offs.), only 7 of which were submitted online via the Qualtrics link. The response rate in Cadillac was 14.6%, with 67 complete surveys (5 partials and 5 break offs), zero submitted online. Detroit had a response rate of 6.1%, with 28 complete and 2 partial surveys returned, 3 submitted online.
Cost
The total material cost of this survey, including the complete survey mailers, post-mailer postcards, and EDDM postage was approximately $9624.18. With 1554 total households surveyed, this equates to a survey cost of $6.12 per household. 3 A more detailed breakdown of materials and cost is provided in Table 2.
Material costs for a 1554 household EDDM survey in Michigan, 2023.

As outlined above, the 158 complete surveys returned brought the overall cost per response to $61.70. 4 The cost per response for each of the three study sites was: Coldwater $63.50, Cadillac $43.20, and Detroit $101.82.
Time
The time required for preparation or “stuffing” of all survey materials was approximately 34 hours or 2020 minutes. Three people were involved in survey material preparation—two of whom had no prior survey preparation experience (none had prepared surveys for EDDM previously). The average time per survey packet was 1.28 minutes (note this average time also included a period of applying labels to the BRM return envelopes). Average time improved over the process, with an average of 1.33 minutes per survey packet for the first study site and 1.18 minutes per packet on average for the last study site.
After the survey packets were prepared, counting, and organizing for mailing via EDDM took approximately 30 minutes for each of the three study sites. An additional 30 minutes was spent per study site counting and organizing the post-mailer postcards, thus bringing the total time spent on all survey material preparation and organizing to approximately 36.67 hours (meaning the survey could have been prepared by one individual in one 40-hour work week).
The total time involved in driving the mailers to each of the USPS offices was just over 18 hours or 1092 minutes.
Total labor time for this work was approximately 3112 minutes, or just under 52 hours. Thus, labor time per complete response was just under 20 minutes (19:42).
Not included in these calculations, but an important consideration, particularly relative to web-based surveys, is the time required to input the data into MS Excel once the paper surveys were returned. Here it required an undergraduate researcher 36.5 hours, or 2190 minutes, to gather, input and clean the data from the 158 completed surveys. 5
Demographics
Unweighted survey sample and best-fit approximation census demographics were compared to assess the survey’s representativeness. In Table 3 below, a value of 100% demonstrates a perfect match between the sample proportion for that characteristic and the population proportion. A value below 100% indicates that the characteristic was underrepresented in the survey sample, and a value over 100% indicates an overrepresentation of that characteristic in the survey sample compared to the population (Grubert, 2019).
Percentage of site demographics as a percentage of best fit census tract demographics.
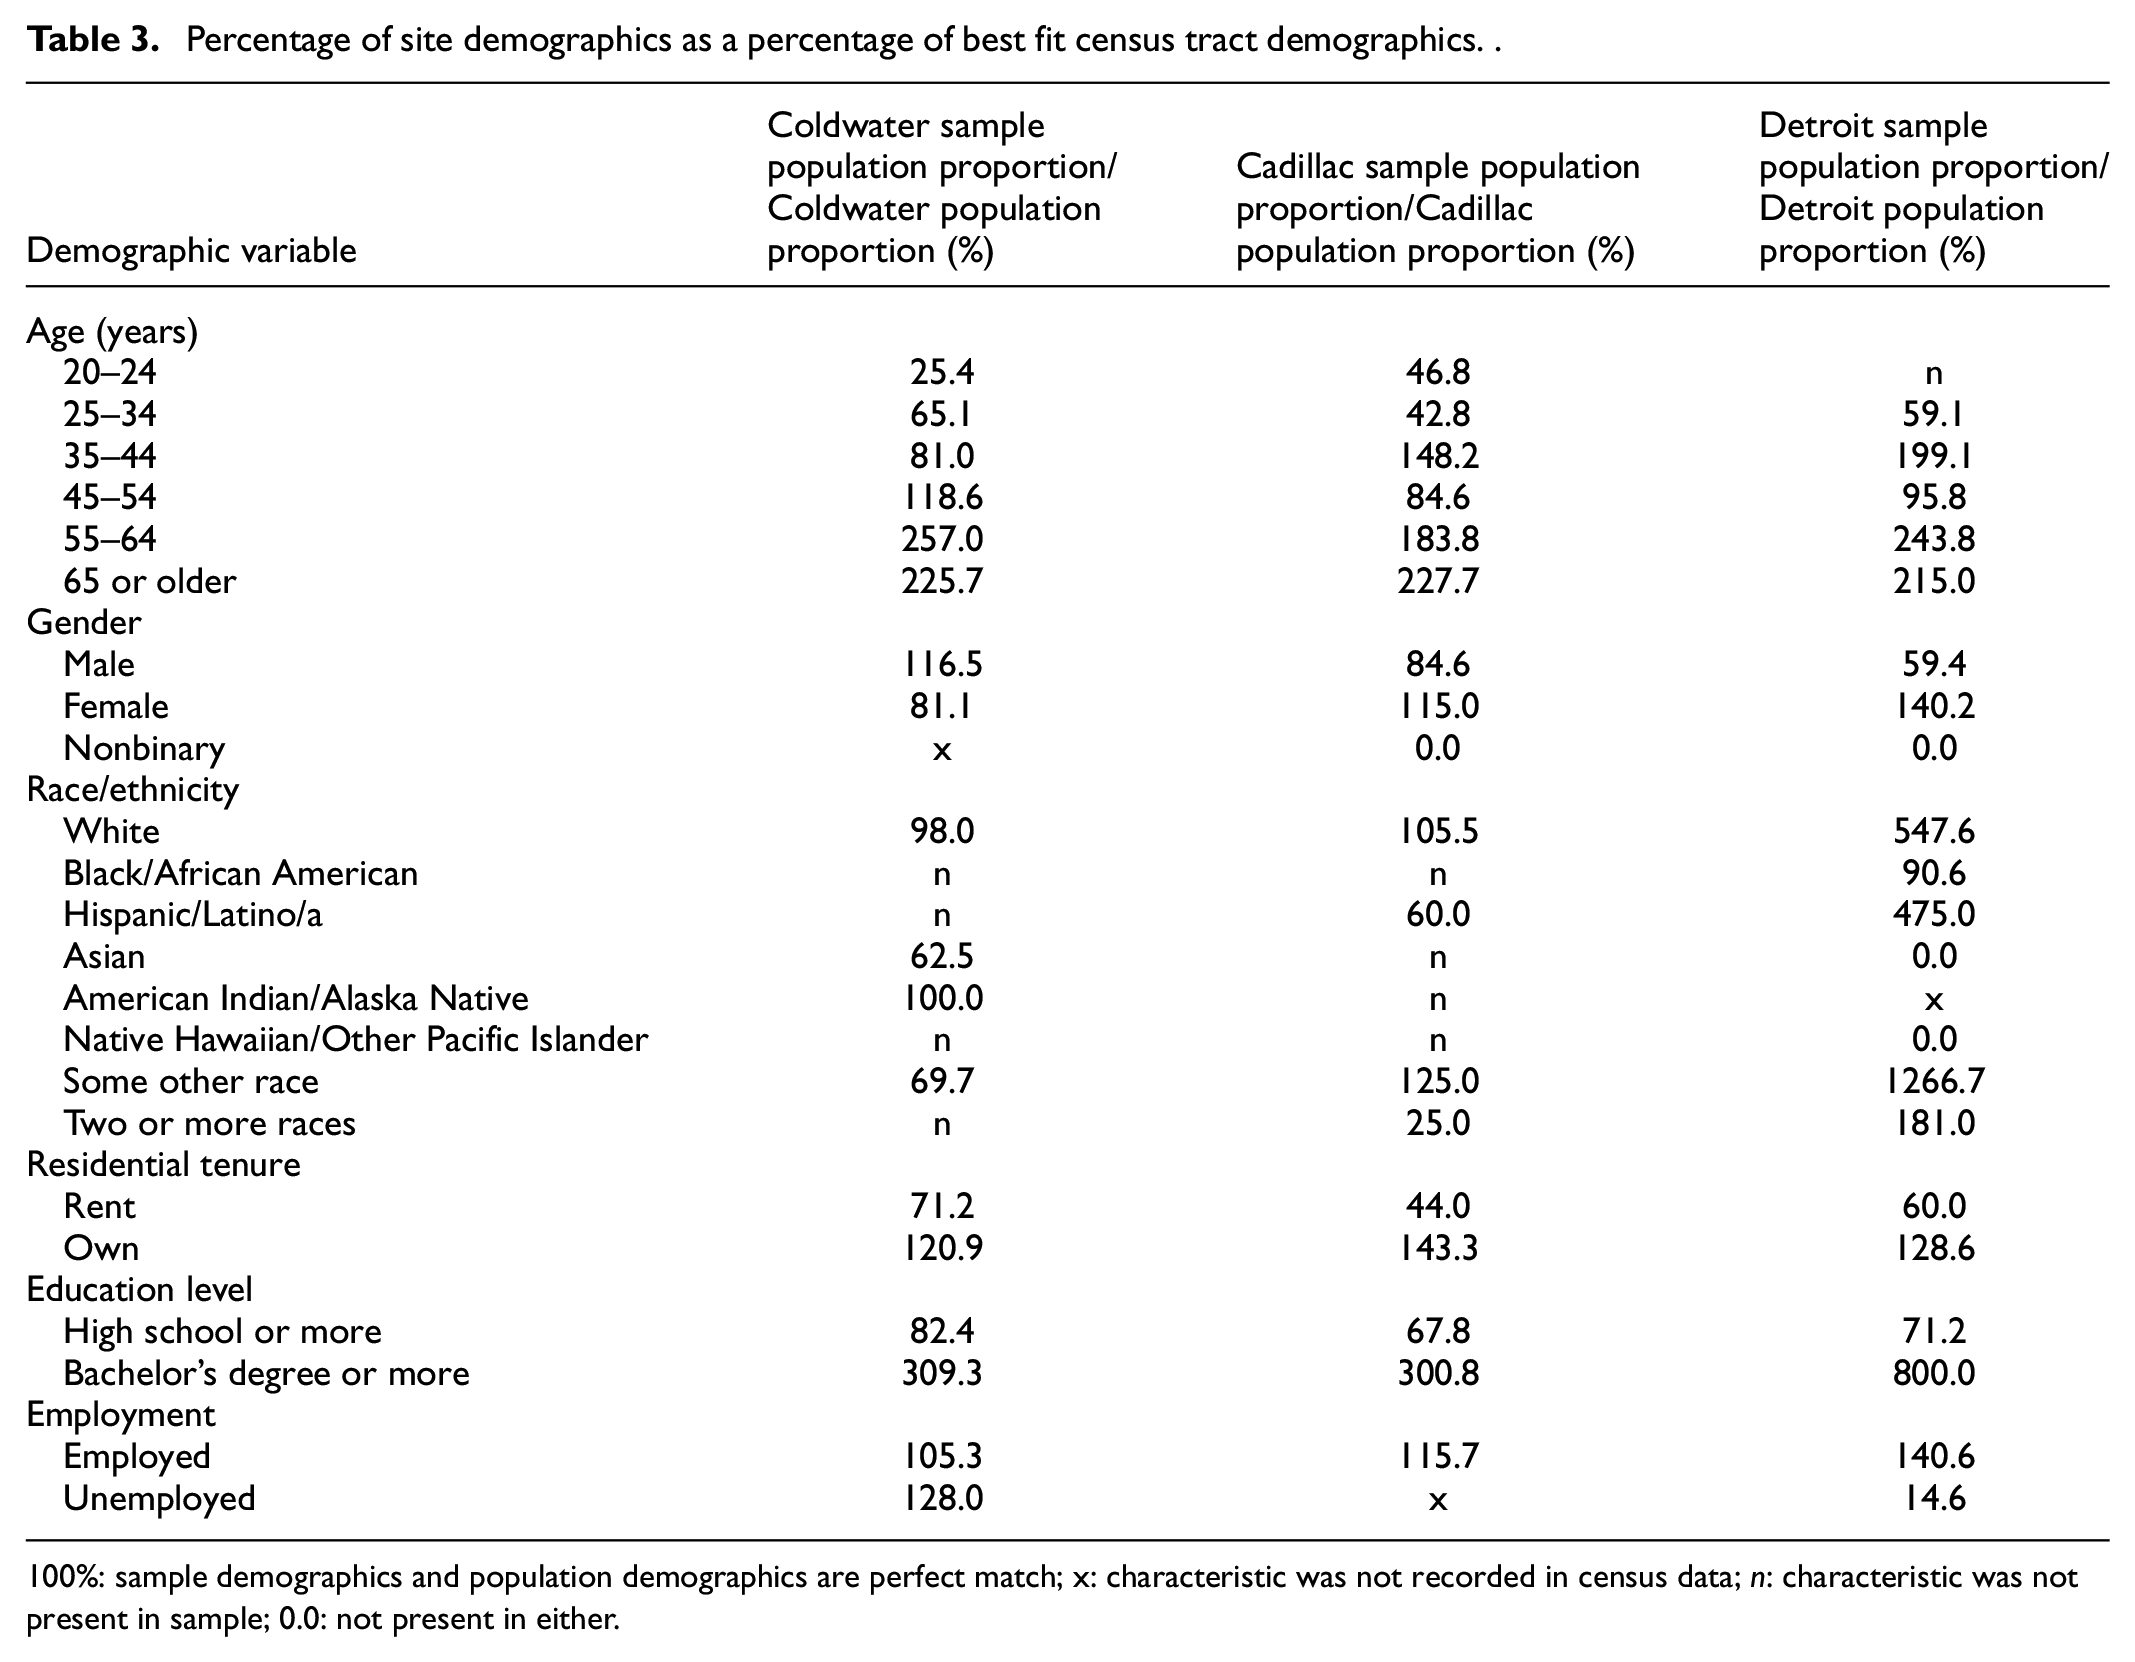
100%: sample demographics and population demographics are perfect match; x: characteristic was not recorded in census data; n: characteristic was not present in sample; 0.0: not present in either.
Across all three sites, survey respondents were older, had a higher rate of owning their home, were better educated, and were better paid than described by best-fit census tracts. In Coldwater, the median household income ranged from $50,000 to $79,999 compared to $38,446 for census tract 9514. Cadillac survey respondents had a median household income of $25,000–$49,000 compared to $45,489 for census tract 3807, and finally Detroit survey respondents had a median household income of $50,000–$74,999 compared with census tract 5451’s average of $16,563.
Discussion
While not achieving higher response rates than mail-based or mixed-mode surveys more broadly, we did achieve a higher response rate here than did two previous surveys sent via EDDM (e.g. Al-Muhanna et al., 2023; Grubert, 2019), and higher or equivalent response rates than some other mailed surveys examining community acceptance and perceptions of energy technologies (e.g. Baxter et al., 2024; Firestone et al., 2018; Frederiks et al., 2020) without sufficient difficulty or delay. At the same time, our response rate was under recently reported and expected averages (e.g. 21%–25%) reported for mail-based mixed-mode surveys (Greenberg and Dillman, 2023; Olson et al., 2021; Stedman et al., 2019) and lower than some other contemporary surveys examining community acceptance of energy technologies (e.g. Junod and Jacquet, 2023; Mills et al., 2019; Nilson and Stedman, 2023), but five times greater than the rate advertised to expect by marketing firms (Geofactor, 2021; McCarthy and King Marketing, 2022). It is of course important to highlight that many other contemporary surveys examining community acceptance of energy technologies, including a few cited above, deployed more labor, time, and cost-intensive surveying methods such as drop-off/pick-up (Junod and Jacquet, 2023), mixed-modes (Firestone et al., 2018), and multi-mailing, addressed surveying (Rand et al., 2023). A potentially more precise way of comparing survey responses rates would be by using a cost-response ratio and labor time-response ratio as we calculated above.
We propose three explanations for the higher response rate achieved here, recognizing that changing more than one method variable from previous EDDM work at a time makes isolating the exact change that increased the response rate difficult—future work should endeavor to modify only one attribute. First, we used a larger outer envelope, which has been shown to increase response rates from 1% to 6% (Dillman et al., 2014). Second, we included a two-dollar incentive and placed it so that it would be seen immediately upon opening the survey packet (see Supplemental Figure B5—Supplemental Appendix B). Previous research has demonstrated that not only the incentive, but its placement is important in increasing response rates (Dillman et al., 2014; Mills et al., 2019). A third explanation is that this survey was potentially more salient than previous EDDM surveys to respondents (Dillman et al., 2014; Grubert, 2019). Notable here though is that no mention of the survey’s focus on solar development was provided on the outer envelope, which alternatively may have limited salience as a factor in respondents’ motivation to open the packet. Going forward, we recommend adding the survey focus to the outer envelope in situations where doing so may be expected to motivate participation.
Our overall response rate was higher than in previous EDDM work; however, Detroit had a lower response rate. The 6.1% attained at the Detroit study site is much closer to Grubert’s (2019) response rate of 5%. It is important to highlight again that the Detroit site is predominantly African American, a population in the United States that has historically been hard to survey (Tourangeau et al., 2014) and are often under-covered by the census (US Census Bureau, 2022). The US Census Bureau (2021a) also provides information on self-response rates for census tracts. Self-response rates show the percentage of households that respond to the census by self-response via mail, phone, or internet. When looking at the census tracts mostly closely aligned with our three mail-routes a similar trend in response rates is evident to our survey response rates. In 2020, the self-response rate to the census in tract 5451 (Detroit) was 40.2% compared to much higher response rates in tract 9514 (Coldwater) and tract 3807 (Cadillac) at 72.9% and 71.5% respectively (US Census Bureau, 2021b).
The quantity of data collected is not the sole measure of a survey method’s success. Another important factor is the quality of the data collected. Eighty-nine percent of the returned surveys were complete, that is, with over 80% of the survey questions answered. We also examined each returned survey for, but found no evidence of, straight-lining. We did not attempt to reduce self-selection bias in our surveys by providing explicit instructions regarding who in the household should complete the survey, for example, an adult with the next or more recent birthday, or the oldest or youngest person in the household (Olson and Smyth, 2017). This was done to simplify the survey, increase response rates and maintain the anonymity of respondents. Nevertheless, the demographics of respondents approached, but were not identical to, the census tract demographics. Our respondents were older, more educated, and more likely to own a home than the underlying populations, while the representativeness of their race/ethnicity, gender, and employment each varied across the three samples.
We were able to essentially eliminate fraudulent responses, that is, responses from participants who misrepresent their eligibility in order to take a survey and get compensated, or participants who respond more than once in order to get compensated again (Agans et al., 2024; Ballard et al., 2019). This method also eliminated algorithm or bot-based fraud at least in our paper responses, which via software created to automatically complete specific tasks (Eslahi et al., 2012) can lead to high rates of fraudulent survey responses that appear legitimate. Fraudulent responses have increasingly been observed and studied in web-based surveying methods disseminated via social media (Goodrich et al., 2023; Griffin et al., 2022; Pozzar et al., 2020) and crowdsourcing platforms like Amazon’s MTurk (Ahler et al., 2025; Kennedy et al., 2020), and other non-probability based survey methods (Agans et al., 2024; Bell and Gift, 2023; Gonzalez et al., 2023; Levi et al., 2022; Thompson and Utz, 2024). To be fair, some panel surveys have also been shown to generate high quality data (Douglas et al., 2023). Panel surveys offered by online data collection services such as Dynata and Qualtrics may have other issues such as the inability to know the actual payments given to respondents, and higher costs than more direct methods such as MTurk (Peer et al., 2022). In comparison to these online surveys, our EDDM survey generated fewer responses, but also little to no concern over bot or algorithm-based fraud. Additionally, the current survey was only sent to eligible participants in a small geographic location. A third feature of our EDDM survey was that the incentive was offered upfront, regardless of whether a response was submitted or not, meaning that there was no incentive to complete a survey more than once. We do not—and cannot—know if any of the 10 online submissions were duplicate responses, but because no financial incentive was provided to residents upon completing a survey, this seems unlikely.
It is also important to note that our survey costs may be difficult to compare with previous EDDM studies. Grubert (2019) deployed their survey in 2016. As mentioned above, since 2016 CPI inflation was approximately 30% and does not account for likely more significant price increases in the printing and paper industry. Thus, while we would have preferred to present more concrete conclusions on cost-per-response between EDDM surveys here—we refrain from doing so given our inability to accurately calculate price increases in paper and printing.
A more useful comparison may be to a more recent mixed-response mode survey that also sought to elicit perceptions of residents living near solar developments distributed via US mail. This survey, distributed as part of the Community-Centered Solar Development (CCSD) project (Rand et al., 2023), was twelve 8.5″ × 11″ pages compared to our eight-page survey, and was deployed via a more traditional addressed mail-survey approach. The survey was distributed to 4974 households across the U.S. within 3 miles of a solar development, received 951 complete responses (for a 19% response rate) and cost $62,501. The cost per survey sent out was approximately $12.57, and the cost per complete response was $65.72. In contrast to the CCSD survey, our EDDM solar survey cost 51% less per household contacted and 6.12% less for each complete response. This is comparable to previous research, which found EDDM to cost about 40% less for each household contacted and between 10 and 20 less for each response (Grubert, 2019). Additionally, less expensive services may have been available from other print shops or by utilizing online-only printers. Printing in black and white could also have reduced costs; our survey included color photographs of the solar developments.
It may also have been less expensive to use other surveying methods such as drop-off/pick-up. In comparison to Junod and Jacquet (2023) who deployed their drop-off/pick-up survey in 2019, our EDDM survey was more expensive per complete response—approximately 5.7 times as expensive. However, drop-off/pick-up surveys are labor and time intensive. Junod and Jacquet (2023) reported requiring 1.91 field hours per collected survey packet. That is just over 5.7 times more labor time than the labor time needed for this EDDM survey. Notably, the number reported by Junod and Jacquet (2023) only counts the estimated total number of days spent in the field by staff persons, and does not include things such as survey packet preparation time, travel time to field location, nor the number of hours required to stay at lodging near the field sites. Our EDDM survey is likely less labor intensive compared to the number reported above. 6
An important best practice from drop-off/pick-up surveys that could be useful for future EDDM surveys is the building of community support and relationships prior to the survey being distributed. This could include activities such as placing notices in local newspapers and with social-media groups about the upcoming survey and working to create relationships with local residents (Junod and Jacquet, 2023). These local residents could further help by raising awareness about the upcoming survey themselves. This kind of pre-survey community engagement would likely have increased our response rate; however, labor time would have increased as well, as would the potential, particularly if social media was used, for fraudulent responses.
Conclusion
The EDDM survey method was quick, labor-time efficient, and was able to achieve a response-rate-to-cost ratio similar to a more expensive mail-based mixed-mode survey fielded by a larger team of researchers all while avoiding the issue of fraudulent responses currently affecting modern web-based non-probability survey methods. This research further highlights the use case of EDDM, particularly in specific contexts such as those recommended by Grubert (2019), that is, surveys that are geographically based, resource constrained, target a specific and limited population, and cover a potentially sensitive topic. Going forward, we recommend that future work adds the survey’s focus to the outer envelope situations where doing so may be expected to motivate participation and considers other alterations based on money and labor-time constraints. For reducing monetary expense, we recommend searching for less expensive services such as online-only printers and printing in black and white. If more labor-time is available, we recommend working to build community support and local relationships prior to survey distribution.
Supplemental Material
sj-docx-1-mio-10.1177_20597991251329754 – Supplemental material for Distributing a survey using Every Door Direct Mail in an ideal use case
Supplemental material, sj-docx-1-mio-10.1177_20597991251329754 for Distributing a survey using Every Door Direct Mail in an ideal use case by Jacob C White and Douglas L Bessette in Methodological Innovations
Footnotes
Acknowledgements
TBD: Background research, study creation, study execution, data analysis, and the writing, editing, and completion of the article were done without the use of any large language models colloquially referred to as “AI.”
Declaration of conflicting interests
The author(s) declared no potential conflicts of interest with respect to the research, authorship, and/or publication of this article.
Funding
The author(s) disclosed receipt of the following financial support for the research, authorship, and/or publication of this article. This work was supported by National Science Foundation Convergence Grant #1934346 “GCR: Collaborative Research: SocioTechnological System Transitions: Michigan Community and Anishinaabe Renewable Energy Sovereignty.” Any opinions, findings, and conclusions or recommendations expressed in this material are those of the authors and do not necessarily reflect the views of the National Science Foundation.
Supplemental material
Supplemental material for this article is available online.
Notes
Author biographies
References
Supplementary Material
Please find the following supplemental material available below.
For Open Access articles published under a Creative Commons License, all supplemental material carries the same license as the article it is associated with.
For non-Open Access articles published, all supplemental material carries a non-exclusive license, and permission requests for re-use of supplemental material or any part of supplemental material shall be sent directly to the copyright owner as specified in the copyright notice associated with the article.