
Abstract
Mail surveys remain a popular method of eliciting attitudinal information, but declining response rates motivate inquiry into new, lower cost methods of contacting potential respondents. This work presents methodological findings from a medium-sized (~12,000 addresses) mail survey testing a United States Postal Service direct mail product called Every Door Direct Mail as a low-cost approach to anonymous mail survey distribution. The results suggest that under certain conditions, Every Door Direct Mail can be a useful approach for mail survey distribution, with response rates similar to those observed with analogous first-class mailing approaches but lower cost per response. As a tool for postal carrier-route saturation mailing that does not use names or addresses, Every Door Direct Mail is potentially useful for researchers who work in small, specific geographies or value or require anonymity. The results from this work suggest good performance on demographics and socially undesirable answers for Every Door Direct Mail relative to addressed mailings. The major disadvantages include an inability to conduct household-level probability sampling, an inability to customize nonresponse follow-up, and minimum mailing sizes associated with the postal carrier route saturation requirement. Every Door Direct Mail is unlikely to become a major tool for survey researchers, but it could be useful in niche applications. This study introduces Every Door Direct Mail to the survey methodology literature and presents empirical data intended to help researchers considering using Every Door Direct Mail.
Introduction
Mail surveys are a well-established mode of reaching potential respondents in a given location (Groves et al., 2011). Mail surveys face limitations, however, including cost and time requirements (Grubert, 2017a). Reliable methods for surveying the general population at relatively low cost are widely sought (Battaglia et al., 2016), particularly given the declining response rates over time (Connelly et al., 2003; Curtin et al., 2005).
The United States Postal Service (USPS) offers a direct mail product called Every Door Direct Mail (EDDM) that could potentially reduce mail survey costs in specific settings. EDDM is a carrier-route saturation mail program that offers low postage rates in exchange for low handling requirements (United States Postal Service, 2017). EDDM imposes strict limitations on mailpiece formats, no ability to personalize mailpieces, and a bulk mailing requirement: mailings are distributed to entire carrier routes, with no addresses or ordering. EDDM is most commonly used for advertising, as are similar programs in other countries, like Australia’s Unaddressed Mail program (Australian Postal Corporation, 2017) and Canada’s Neighbourhood Mail program (Canada Post, 2017).
The use of EDDM for survey distribution is not represented in the literature. Given USPS’ emphasis on the product as a low-cost mailing option and researchers’ likely personal experience as recipients of direct mail, researchers might consider using EDDM for mail surveys without a strong basis for decision making, given the lack of reported experience. Accordingly, this article describes the process of EDDM-based survey deployment and presents methodological results from a medium-sized (~12,000) survey mailing conducted in the United States during 2016 using both EDDM and addressed mail. The restrictions associated with unaddressed, carrier-route-based distribution approaches are disqualifying in many survey contexts, particularly given the limited ability to customize nonresponse follow-up and a requirement that sample design be geographically based. Despite the restrictions, however, EDDM has lower distribution costs and a higher standard of respondent anonymity than traditional mail surveys, which could be useful in settings in which its weaknesses are acceptable.
This study addresses two primary methodological hypotheses:
H1: EDDM response rates are not different from response rates for mailings using addresses and first-class postage;
H2: Cost per response is lower for EDDM than for addressed mail.
The remainder of this article presents a logistical overview of EDDM, analyses related to these two hypotheses, and some exploratory analysis of demographic differences between respondents to EDDM versus addressed questionnaires.
The logistics of an EDDM campaign
This section describes the most relevant aspects of EDDM logistics for mail survey researchers: formatting, cost, and distribution. Unless otherwise specified, this article describes an EDDM Retail campaign, not a business mail entry unit (BMEU) EDDM campaign. The main differences are permit requirements, mailpiece entry logistics, and cost. Details on both programs are available in the USPS user guide (United States Postal Service, 2017).
EDDM mailpieces are subject to strict formatting requirements. Most relevantly for mail survey researchers, mailpieces are required to have one large dimension, addressing is done via identical address labels (to “Local Postal Customer,” with no name or address), and prepaid postage indicia are used in place of stamps (United States Postal Service, 2017). Figure 1 shows an example of this formatting.
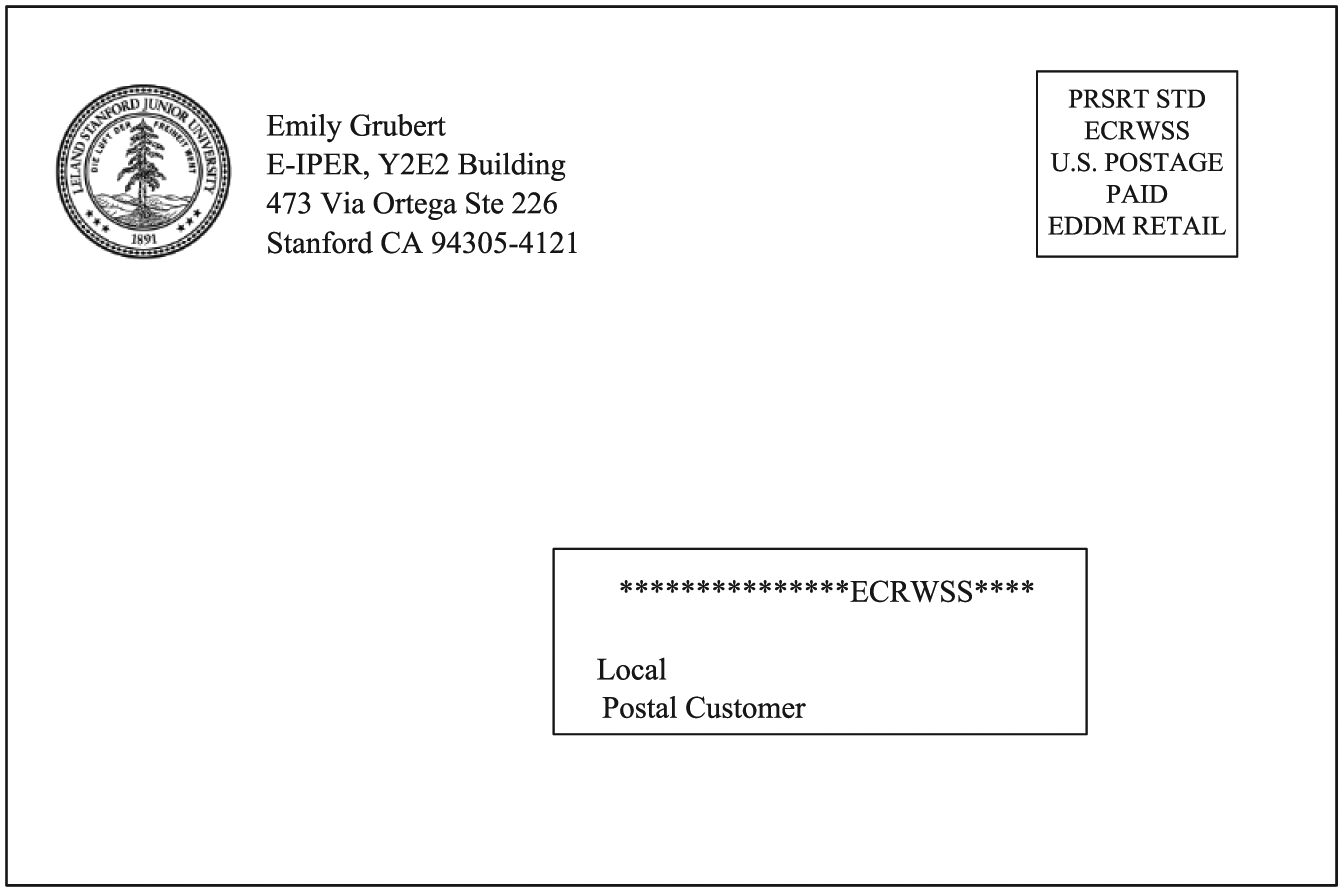
Printed EDDM address labels and postage indicia.
The major implications of these restrictions are that EDDM materials tend to be more expensive to procure, but easier to prepare and cheaper to distribute, than conventional mailpieces. EDDM materials are generally more expensive both because they are larger than standard mailpiece materials (e.g. postcards, #10 envelopes, and 6 × 9 in envelopes) and because compliant sizes are less commonly available. Preparation, however, is simplified because address labels and prepaid postage indicia can be printed directly on mailpieces (Figure 1). This benefit can be large: for a 10,000 household, three-contact study, not needing to apply stamps and labels to each mailpiece saves an estimated 3 weeks of full-time work (Grubert, 2017a).
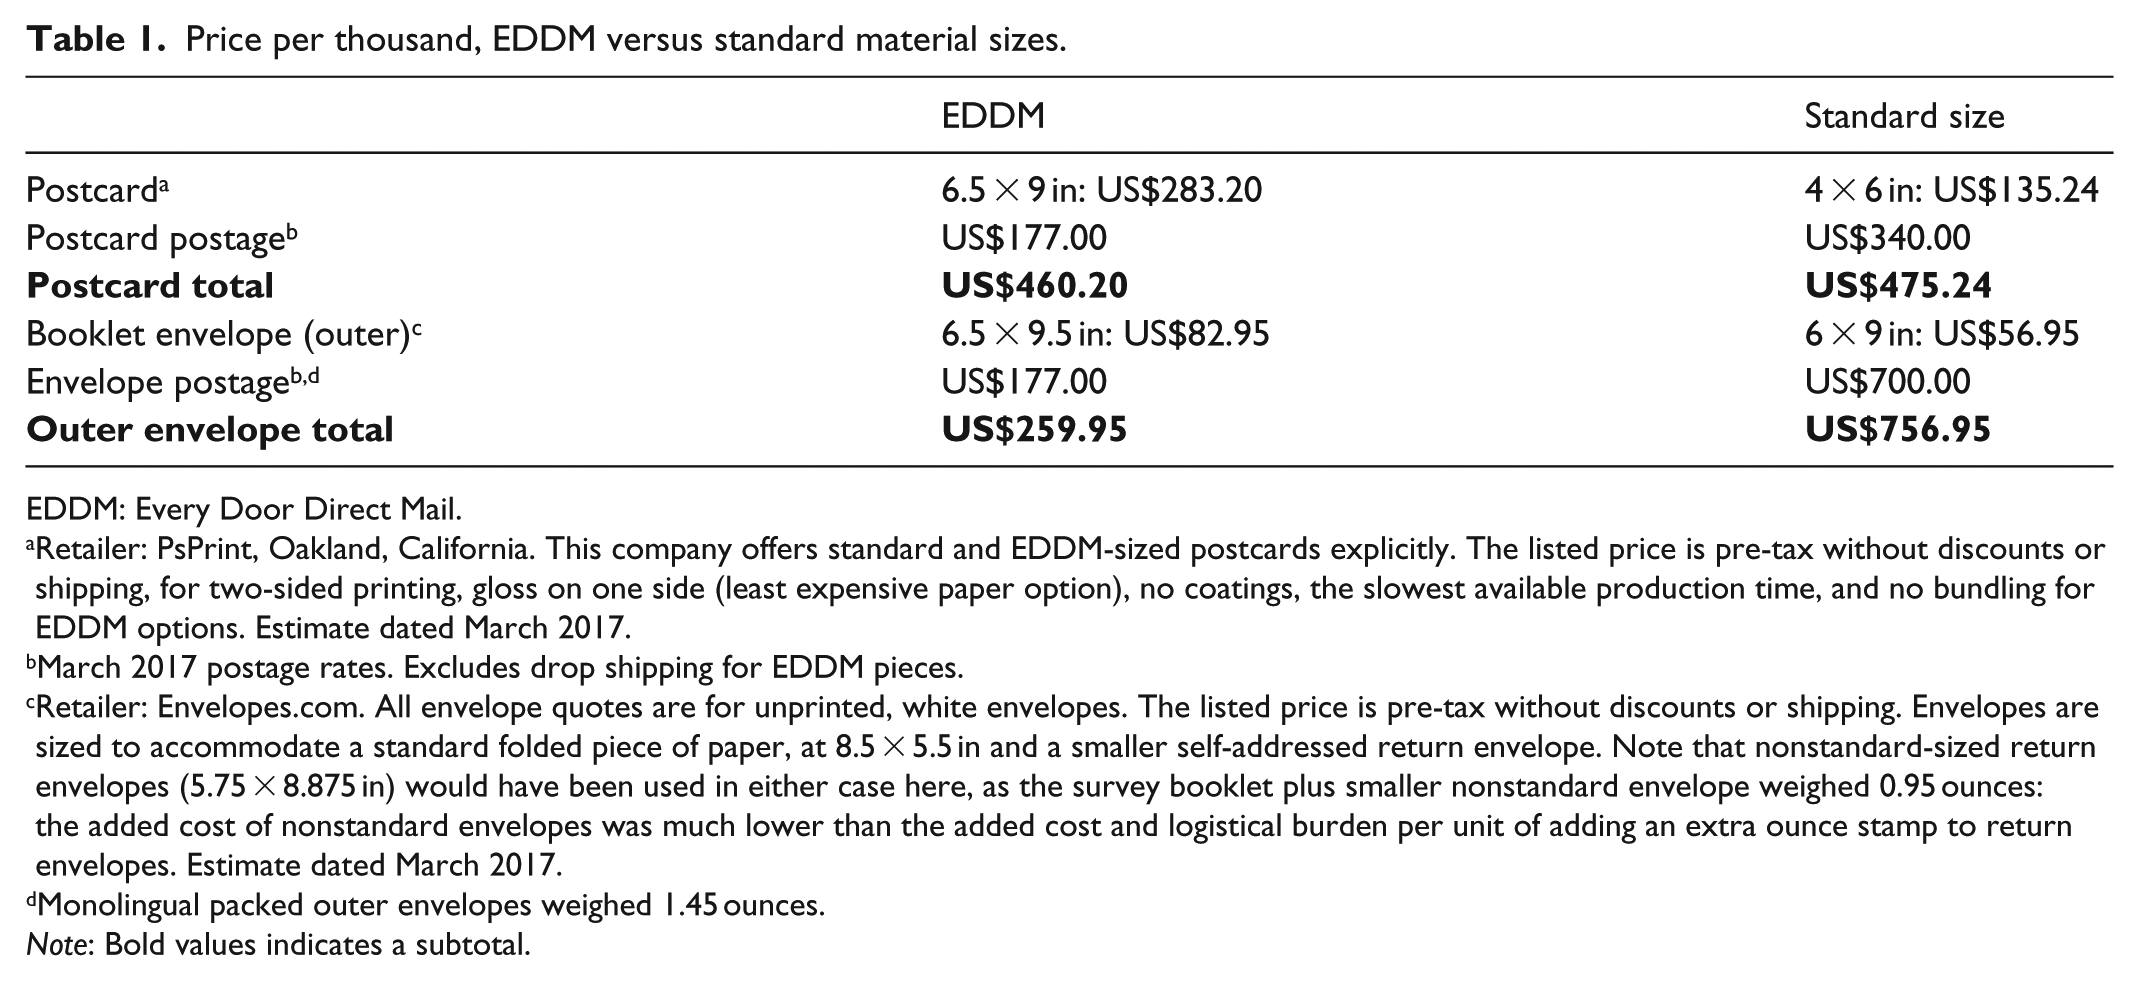
EDDM’s prepaid postage is designed to be low. As of late January 2019, EDDM Retail postage is US$0.187 for mailpieces up to 3.3 ounces, versus first-class postage of US$0.55–US$1.00 for flats of similar weight or US$0.35 for 4 × 6 in postcards (USPS, 2019). Table 1 illustrates the tradeoffs between the material and postage prices for EDDM versus conventional mailings using estimates from this study’s suppliers (dated March 2017). EDDM provides a clear financial benefit for envelope mailings, but cost-effectiveness for postcards is limited due to the need for large sizes and the lower first-class postage.
Price per thousand, EDDM versus standard material sizes.
EDDM: Every Door Direct Mail.
Retailer: PsPrint, Oakland, California. This company offers standard and EDDM-sized postcards explicitly. The listed price is pre-tax without discounts or shipping, for two-sided printing, gloss on one side (least expensive paper option), no coatings, the slowest available production time, and no bundling for EDDM options. Estimate dated March 2017.
March 2017 postage rates. Excludes drop shipping for EDDM pieces.
Retailer: Envelopes.com. All envelope quotes are for unprinted, white envelopes. The listed price is pre-tax without discounts or shipping. Envelopes are sized to accommodate a standard folded piece of paper, at 8.5 × 5.5 in and a smaller self-addressed return envelope. Note that nonstandard-sized return envelopes (5.75 × 8.875 in) would have been used in either case here, as the survey booklet plus smaller nonstandard envelope weighed 0.95 ounces: the added cost of nonstandard envelopes was much lower than the added cost and logistical burden per unit of adding an extra ounce stamp to return envelopes. Estimate dated March 2017.
Monolingual packed outer envelopes weighed 1.45 ounces.
Note: Bold values indicates a subtotal.
Two major caveats to the low postage rate associated with EDDM are that (1) unlike business reply mail, EDDM does not reduce the postage rates for respondents or for self-addressed return envelopes, and (2) the total distribution costs can be much higher than postage costs if surveys are not being delivered locally. EDDM Retail mailpieces can be entered directly at post offices without permits, but they must originate at their Destination Delivery Unit (DDU)—generally the post office that serves the relevant carrier route. This means that if researchers cannot drop off mailpieces at the appropriate DDU, the mailpieces must be shipped to that DDU at the conventional package shipping costs. Especially given minimum mailing sizes of either 200 units or the total number of addresses served by a given DDU, bulk shipping costs can be large (Grubert, 2017a). Additional time is also required for processing: in this study, the time between bulk shipping and actual mailpiece distribution was generally 3–5 mail days. BMEU-type EDDM requires mailpiece entry at the BMEU where the purchased permit is held, even if it is not local to the EDDM distribution area: see the USPS user guide for details (United States Postal Service, 2017).
Advantages and disadvantages of EDDM in survey research
The key potential advantages of EDDM for survey research are lower unit costs and a clearly evident commitment to anonymity, given that no addresses are used and that EDDM mailpieces are addressed to “Local Postal Customer” (Figure 1). EDDM is unusual in that it does not rely on recipients’ trust that promises of data anonymity or confidentiality will be kept: EDDM recipients can see that their names and addresses are not used. With addressed mail, even when names are not used, recipients can see that the sender at some point had access to their address. Practices like the use of serial numbers, bar codes, and other sometimes nonobvious markers that can be used to match an addressee to a questionnaire (Yang and Yu, 2011) might lead potential respondents to suspect that they could be traced through their response. By contrast, as EDDM mailings are not guaranteed to be delivered in the same order every time and minimum mailing volumes preclude manipulation (e.g. through judicious use of “Do Not Deliver Address” requests), even knowledge of the addresses and individuals on a given carrier route and use of questionnaire identifiers (like bar codes) would not reliably match individuals to responses. For rare populations, demographic data might still mean that individuals can be reidentified, but this issue is not unique to EDDM. Since survey data are not necessarily legally protected (Lee and Renzetti, 1990), researchers concerned about potential conflicts that could compromise anonymity, like a subpoena, might also benefit from completely blinded respondent identities that EDDM can provide.
Using EDDM in place of a traditional mailing-list-based survey has some clear sampling drawbacks. The most significant is that EDDM relies on sampling entire postal carrier routes. Thus, household-level random sampling is not possible, though cluster sampling of carrier routes is (within-household randomization proceeds in the same manner as for any other mail survey). In some cases, this characteristic might be nonproblematic or even desirable. For example, a postal carrier route census could be useful to surveys with geographic frames, particularly those in small communities or where alternative modes, like web surveys, are infeasible. A postal carrier-route census could also be useful in cases in which researchers are interested in screening for rare populations, given the ability to send mailings to entire carrier routes anywhere in the United States. In many cases, however, carrier-route-level census sampling using EDDM might be resource prohibitive (e.g. because of minimum mailing sizes) or otherwise undesirable (e.g. because address-level data cannot be linked to responses).
As with other methods that grant anonymity rather than confidentiality, EDDM precludes some techniques for increasing response rates. Most obviously, standardized addressing and the use of postal indicia mean that personalization and stamps—both of which have been linked to higher response rates (Dillman et al., 2007)—cannot be used. A related limitation is that individual nonrespondents cannot be identified for follow-up. EDDM-based follow-ups must be sent to everyone (which can be costly for mailers and annoying for respondents) or no one.
Finally, EDDM’s premailing logistical benefits are somewhat offset by post-mailing logistical disadvantages. Undeliverable EDDM mailpieces are not automatically returned to the sender, so mailers must contact post offices for undeliverable counts or to recover undelivered materials. In many cases during this study, post offices did not respond to contact, did not know how many undelivered mailpieces there were, and/or did not have access to them. For survey researchers, this lack of returns means losing information about undeliverable rates, reasons for nondelivery, and processing times. Furthermore, and significantly for studies that include incentives or scarce resources, it also means that unused materials (e.g. unused stamped return envelopes) often cannot be recovered.
Methods
This article focuses on the methodological results of a mail survey study using EDDM and addressed contact approaches under Stanford University Institutional Review Board Protocol IRB-33232. Motivation for the specific project, details of survey preparation, and additional results are described elsewhere in detail (Grubert, 2017a, 2017b: Appendix 3, 2017c).
Contact design and mailing procedure
This three-contact mail survey of unnamed persons used two primary approaches to contacting potential respondents, for a total of 12,333 households contacted, using EDDM distribution for questionnaires (6897 households, “EDDM”) and using addressed questionnaires (5436 households, “addressed”). Each group also included subgroups designed to test for major cost or response rate differences (Figure 2).
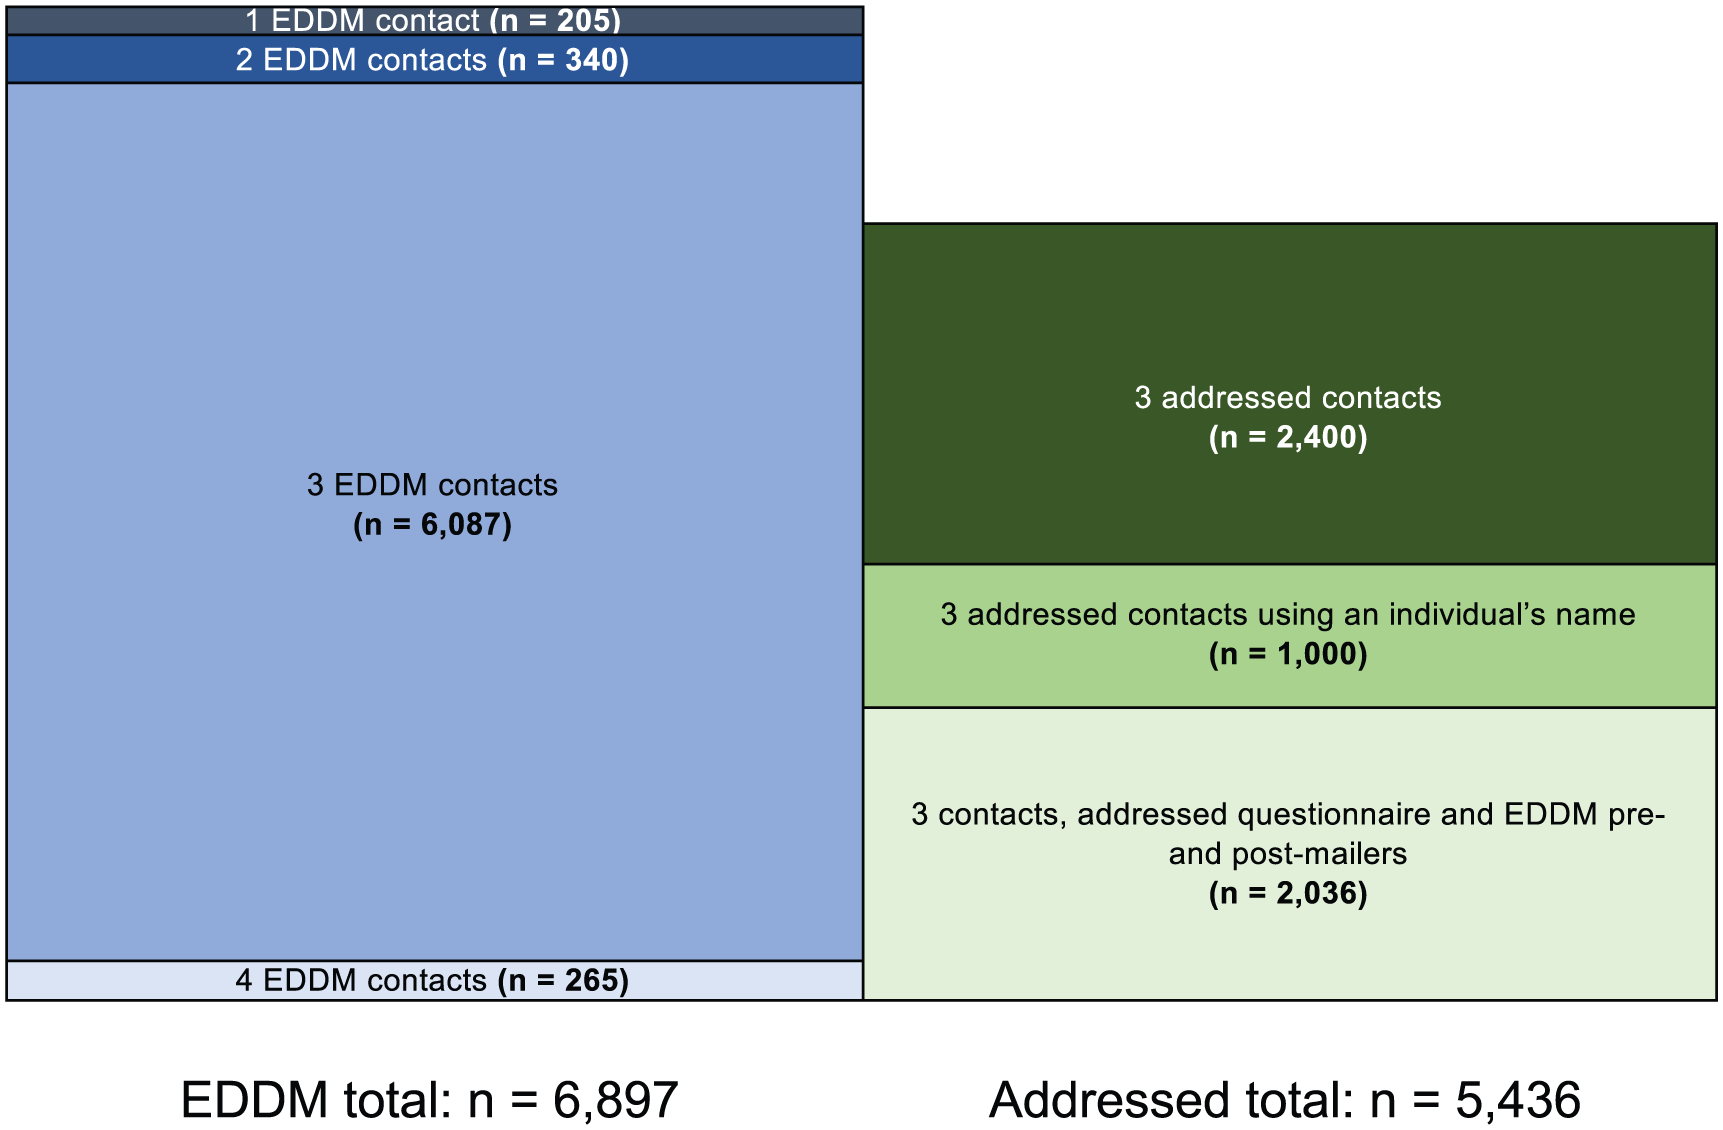
EDDM and addressed sampling groups.
The EDDM group was contacted using EDDM distribution for all contacts: premailer postcards, questionnaires (including cover letters and self-addressed return envelopes), and post-mailer postcards. Three subgroups received more or fewer than three contacts: 205 households were contacted only once (with the questionnaire mailing), 340 households were contacted only twice (with a premailer and questionnaire; post-mailer reminder postcards were not delivered due to a post office problem), and 265 households were contacted four times (with two, rather than one, post-mailer reminder postcards). The addressed group was divided into three subgroups: 2400 households received three contacts addressed to “Local Postal Customer” at their street address, 1000 households received three contacts addressed to a named individual at their street address, and 2036 households received questionnaires addressed to “Local Postal Customer” at their street address, but pre- and post-mailer postcards were distributed via EDDM. Note that the subsample of 1000 households contacted with names attached is still considered a survey of unnamed persons by the American Association for Public Opinion Research (AAPOR) definition, given the goal of contacting an eligible adult at a specific address rather than contacting a specific person. In no case was a return envelope or questionnaire ever associated to a particular individual or address, including those mailed to named individuals.
Sampling
Samples were drawn from the population of adults in specific zip codes, chosen because of their proximity to the points of interest (Appendix 3 in Grubert, 2017b). Table 2 summarizes the basic demographic data and the response rates for each of the 37 sampled zip codes. The selected zip codes were diverse. For example, zip code populations ranged from 32 to over 68,000, the population below the poverty level ranged from 0% to 51%, and the White populations ranged between 30% and 100% (U.S. Census Bureau, 2017). No strong correlations between response rates and demographic data in Table 2 were observed.
Demographics by sampled zip code, US Census Bureau.
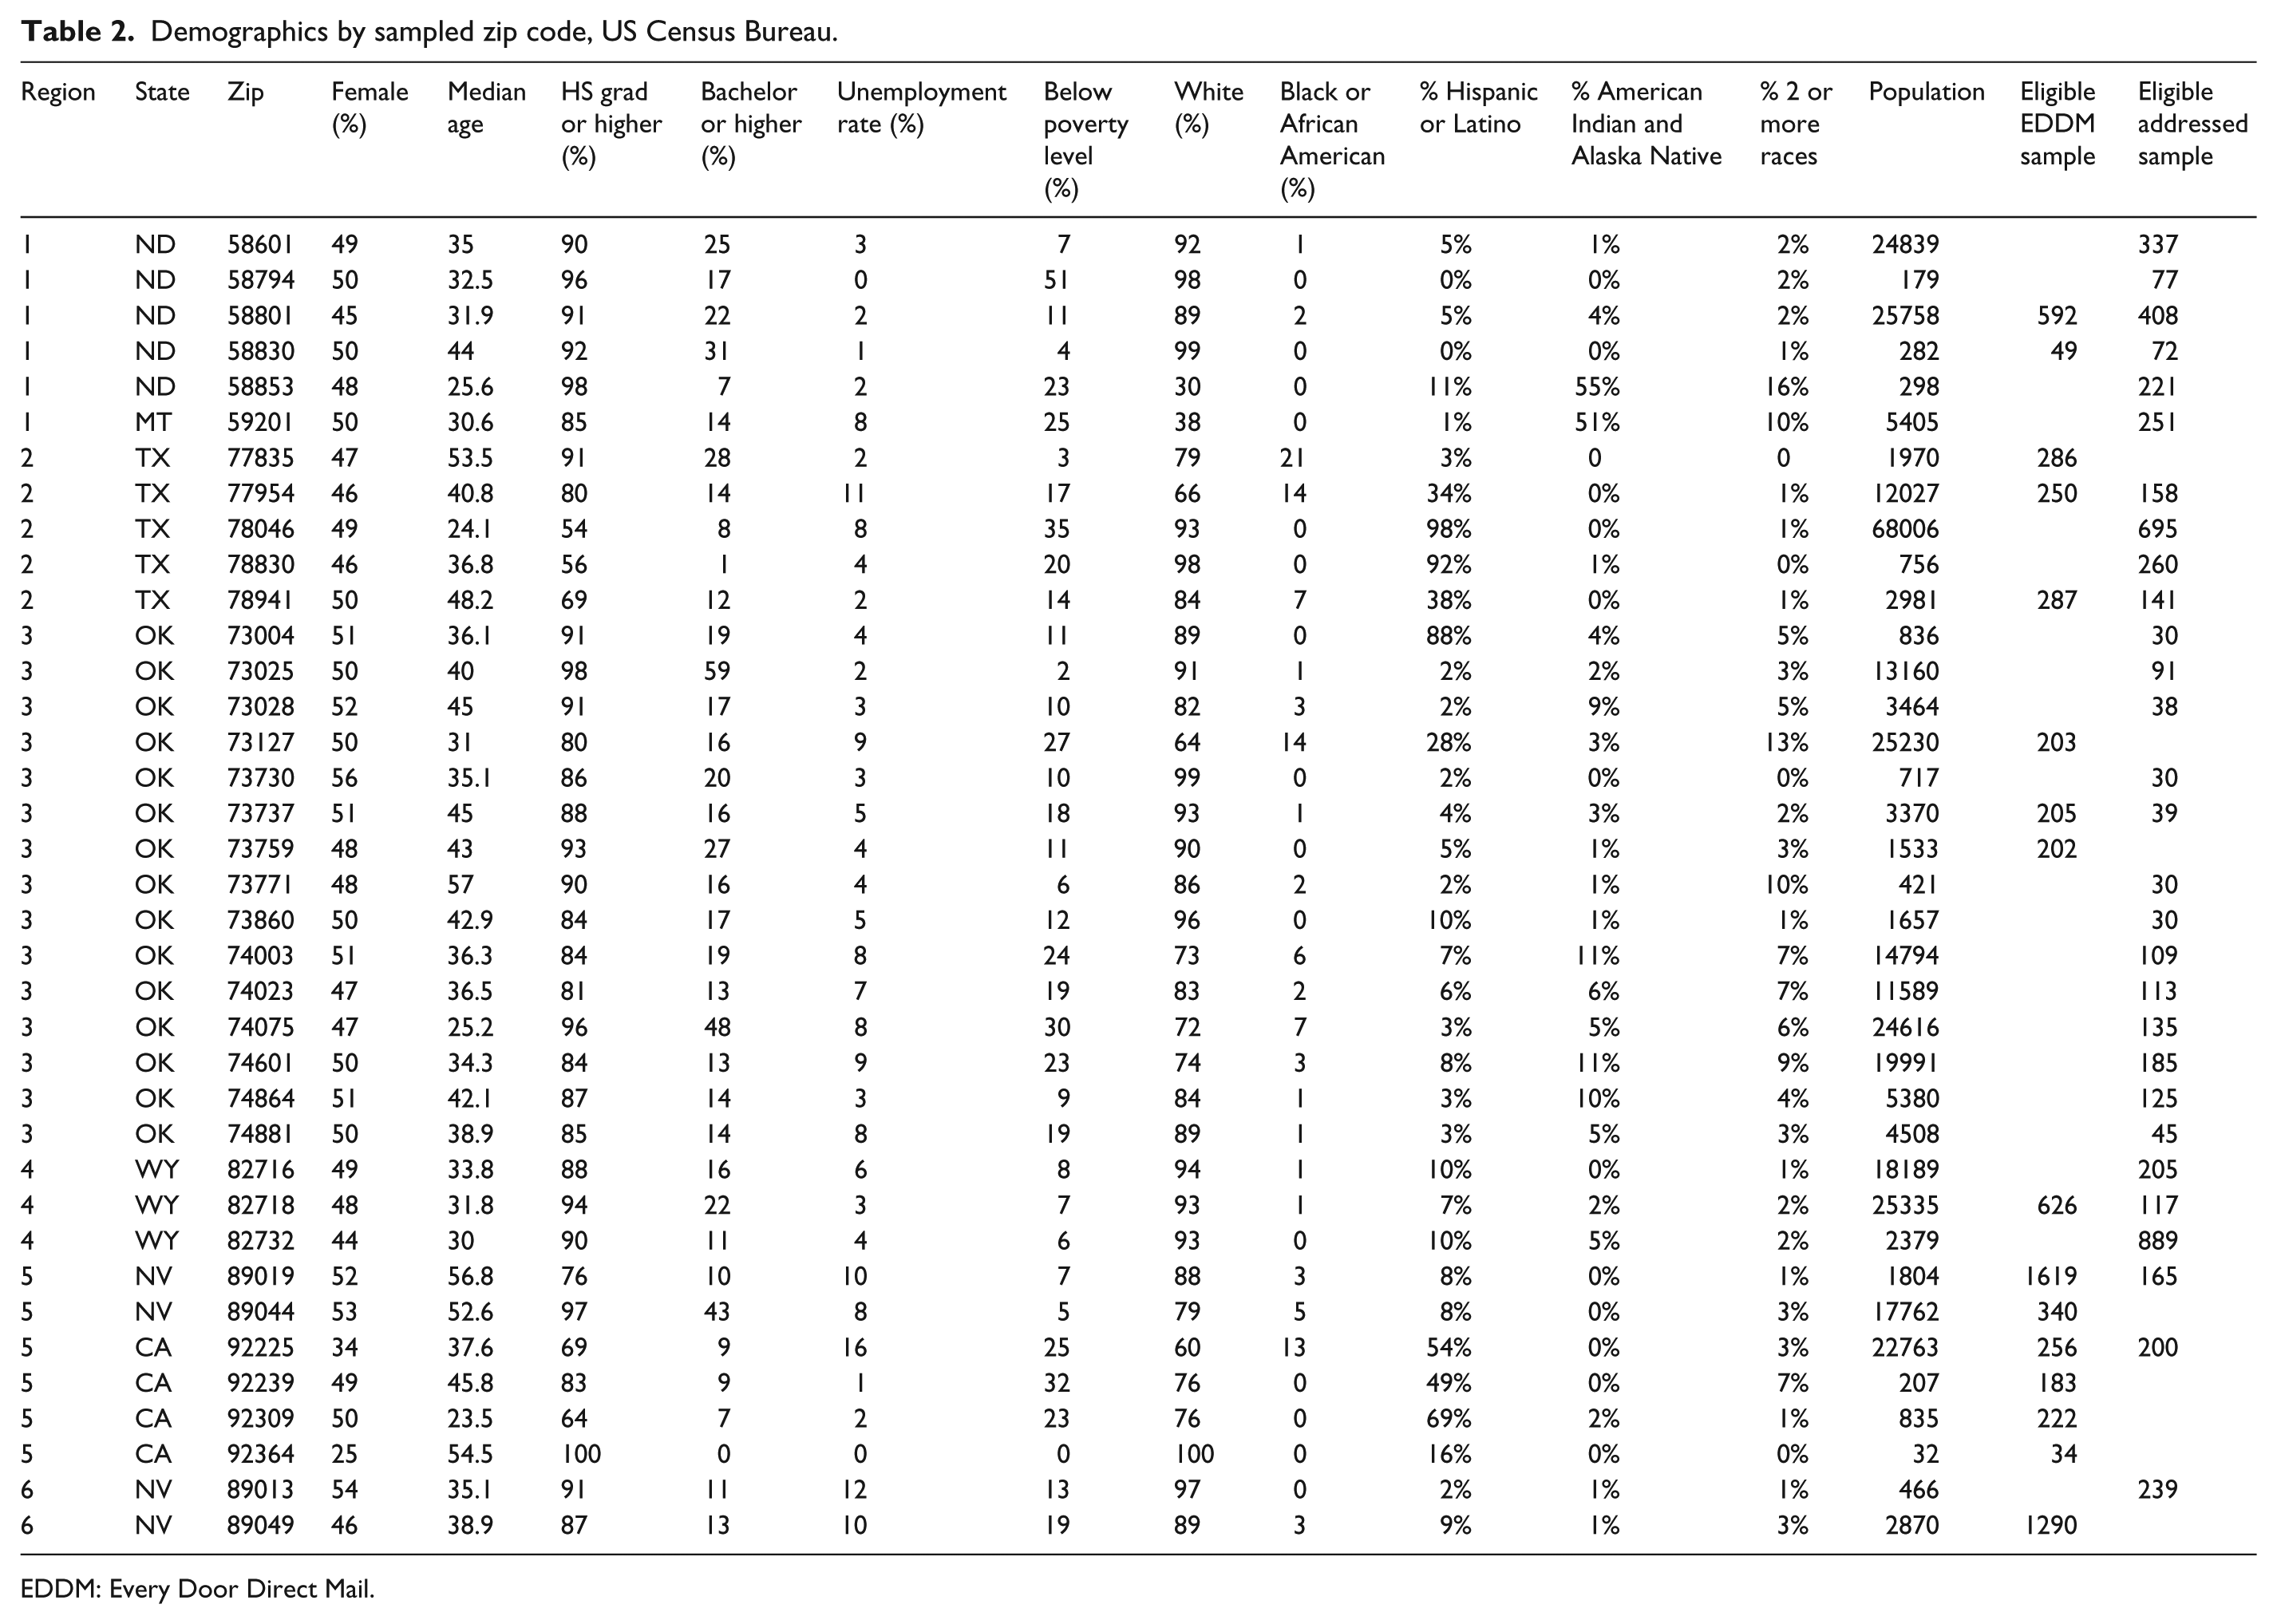
EDDM: Every Door Direct Mail.
This study used a postal carrier-route-based sampling approach for all mailings without names. That is, every address on a given postal route was contacted. Care was taken to approximately match the routes selected for EDDM or addressed mailings based on density, approximate demographics (per available USPS data: age, density, and income), and location where possible. The purchased mailing list address counts were compared with counts from the USPS EDDM route selection tool to ensure that the mailing lists were complete for a given route. For named mailings, individual households were randomly selected from sampled carrier routes.
Sample sizes were chosen based on a combination of costs, local population constraints, and interest in sufficient statistical power to (1) enable cross-regional comparisons of rating responses and (2) detect a response rate difference between EDDM and addressed mail that would erase EDDM’s cost advantage. Once the sample sizes were chosen, fully randomized selection of carrier routes from the selected zip codes was not practical given the specific geographies of interest, dramatic differences in zip code and individual route size, and limitations on allowable EDDM mailing sizes. For researchers who do not want the likely social correlation of neighborhood-level clustering or who cannot accept a sampling procedure that is not a probability sample at the individual level, EDDM is inappropriate.
Analytical methods
Response rates
Response rates are calculated using the May 2016 AAPOR Response Rate Calculator Version 4.0 (all) based on Standard Definition, 9th Ed (AAPOR, 2016). The response rates reported in this article are AAPOR RR1, which assumes that all addresses of unknown eligibility (including those that are never successfully contacted) are eligible for participation. RR1 is the most conservative response rate, as it assumes e (the eligibility ratio) is 1 (Smith, 2009). Thus, the “true” response rate is likely higher than that reported here, but since the goal is to compare EDDM and addressed response rates, and since anticipated eligibility is identical for EDDM and addressed mailings, the use of RR1 simplifies the discussion.
In considering the use of more conventional response rates that assume that only some unknown eligibility addresses are eligible, it is important to recognize that AAPOR definitions for undeliverable mailpieces are ambiguous (AAPOR, 2016). For context, this study’s calculated RR3 response rate doubles when undeliverable questionnaires are designated as “No such number” (Code 4.3131) versus “USPS: No such number” (Code 3.3131), or other similar pairings, even though all are designated for use with mail surveys of unnamed persons. This study used USPS-designated AAPOR disposition codes for 604 undeliverable questionnaires (primarily under 3.31 codes), meaning that undeliverable questionnaires were considered eligible (RR1) or partly eligible (RR3) for response rate calculations despite evidence that they might not be associated to an actual household.
Ineligible cases are tallied based on received questionnaires and the knowledge that some EDDM Retail mailings were sent to business PO boxes. Here, questionnaires were marked ineligible if the reported zip code was out of sample (AAPOR code 4.1000, n = 5) or if the returned questionnaire indicated a duplicate listing (AAPOR code 4.8100, n = 1). An additional 253 EDDM mailings were deemed ineligible as business PO boxes using purchased address lists. Note that even with this higher resolution list available, the nature of carrier route selection means that ineligible PO Box addresses cannot easily be excluded from EDDM mailings.
Statistical analysis of response rate differences (H1) is performed assuming a two-tailed hypothesis, as the study investigates whether EDDM and addressed response rates are different in either direction. The base significance level is set at α = 0.05. When multiple comparisons are made for a given set of results (e.g. response rates or answers to a particular question), significance levels are presented against both Bonferroni (more conservative) and Holm–Bonferroni (less conservative) multiple comparison corrections in addition to the raw value.
Cost per response
The total costs are reported based on external material and service costs, including printing, office supplies, paper goods, postage, and services like translations. Costs associated with time and provision of “in kind” services like storage space are not included, which is consistent with other literature but masks a large hidden cost (see Grubert, 2017a for details on time requirements).
Costs are divided evenly across returned completed responses in a group and reported separately for mailings done by EDDM only, addressed mail only, and addressed questionnaires accompanied by EDDM postcards. Both mailed responses and web responses known to have been prompted by a mailed web link are included in the total response count, but returned blank questionnaires are not.
Demographics and sociability
The potential anonymity benefits were not an anticipated outcome of using EDDM and were thus not part of a defined hypothesis, but free response and other data associated with the survey indicated that EDDM’s higher standard of anonymity might have meaningfully influenced respondents’ behavior. Thus, this work includes exploratory analysis of demographics and item responses to addressed versus EDDM-mailed questionnaires, based on the idea that some people might have been more comfortable participating, or responding to specific questions, in an obviously anonymous setting. Self-reported demographic data were compared with population demographics for the zip codes from which each subsample was drawn (zip-code level 2015 census data, U.S. Census Bureau, 2017: see Table 2). For demographic item responses that are not externally verifiable, responses were compared between the contact modes, with a focus on questions with probable sociability influences. The goal is to investigate whether respondents with more assurance of anonymity report different characteristics.
Results
Evidence from the sample supports both H1 and H2: response rates were not statistically distinguishable between the EDDM and addressed mailings, and EDDM costs per response were lower. The overall minimum response rate for the survey described in this study was 5.6% (AAPOR version 4.0, RR1: EDDM: 5.2%, addressed: 6.1%), for a total of 673 complete responses to 12,333 questionnaires mailed. In total, 259 cases are known to be ineligible.
Given this work’s designation of undelivered mailpieces as having unknown eligibility, and given that RR1 assumes all unknown eligibility households are eligible, RR1 is not sensitive to undeliverable rates. For context, however, 482 of 5436 addressed questionnaires (9%) were returned to the sender, and 122 of 6897 of EDDM questionnaires (2% of total, and 11% of the questionnaires distributed by the post offices from which the 122 were recovered) were recovered from post offices. Based on discussion with post offices, the majority of undelivered EDDM mailpieces (which are not automatically returned to sender) were destroyed without formal record. This information suggests that the true undeliverable rate was about 10%.
The overall refusal rate was at least 0.4% (EDDM: 0.3%; addressed: 0.6%), based on the receipt of 53 blank questionnaires. Potential respondents were asked to return the blank questionnaire in the enclosed self-addressed return envelope if they read the description and did not wish to participate. Returns of blank questionnaires are thus considered a lower bound for active refusals.
The overall cost per response was US$35.87, with material costs per address of US$1.97 (English-only EDDM: US$29.37/US$1.48; English-only, all contacts addressed: US$33.30/US$2.54). People with higher educational attainment, non-Hispanic Whites, and adults above 65 were overrepresented among respondents relative to the population, which is fairly typical. For most indicators, EDDM response demographics were more similar to population demographics than addressed response demographics in this study. Furthermore, EDDM responses tended to be less sociable, though none of these differences were statistically significant based on a chi-square test of independence. The remainder of this section presents more detail on the response rate, cost per response, and demographics by mailing type in order to characterize EDDM as a survey contact method.
Response rate
For this study, the response rates for EDDM and addressed mailings were statistically indistinguishable for a significance level of α = 0.05 after correcting for the use of multiple comparisons by either Bonferroni or Holm–Bonferroni correction (α = 0.05, 12 comparisons; 95% confidence interval (−2%, 0.01%)). Overall, using RR1, EDDM response rates appear to be lower than addressed mail response rates (by about 15%, at 5% versus 6%). All addressed mail response rates (Figure 2) were about 6% and are reported collectively under “addressed.”
One important note on the response rate is that this study uses the most conservative definition available in order to facilitate comparison between addressed mail and EDDM without relying on assumptions. Specifically, the reported response rate is AAPOR’s RR1; it assumes that undelivered questionnaire eligibility is unknown, and assumes that only recovered mailpieces were undeliverable, which likely underestimates EDDM’s true undeliverable rate by a factor of five. The motivation for this conservative approach is that it relies strictly on observations. Overall, the raw response rate for this study is similar to those seen elsewhere. For example, the phone-based Behavioral Risk Factor Surveillance System (with a calculated response rate of about 50% after accounting for ineligibility, which is arguably more lenient for phone than mail surveys under AAPOR guidelines) has completed interview rates of between 1.8% and 11.1%, with a mean of 4.5% (Centers for Disease Control and Prevention (CDC), 2015). Anecdotally, recent unpublished US mail survey-based studies with similar goals (i.e. surveying the general population of a community about a topic with low personal salience but meaningful community-scale implications) have observed response rates of 2%–10% (personal communication with author).
Figure 3 illustrates why a conservative estimate of response rate is desirable for comparing EDDM with addressed mail. The figure shows the results of eight seemingly reasonable ways to calculate the response rate, based on two options for each of three choices: (1) using AAPOR’s RR1 versus RR3, a more conventional response rate that assumes some fraction of nonrespondents were ineligible for participation; (2) classifying undeliverable mailpieces as unknown versus not eligible; and (3) assuming observed (i.e. physically recovered) rates of undeliverable questionnaires versus the estimated true rate for EDDM.
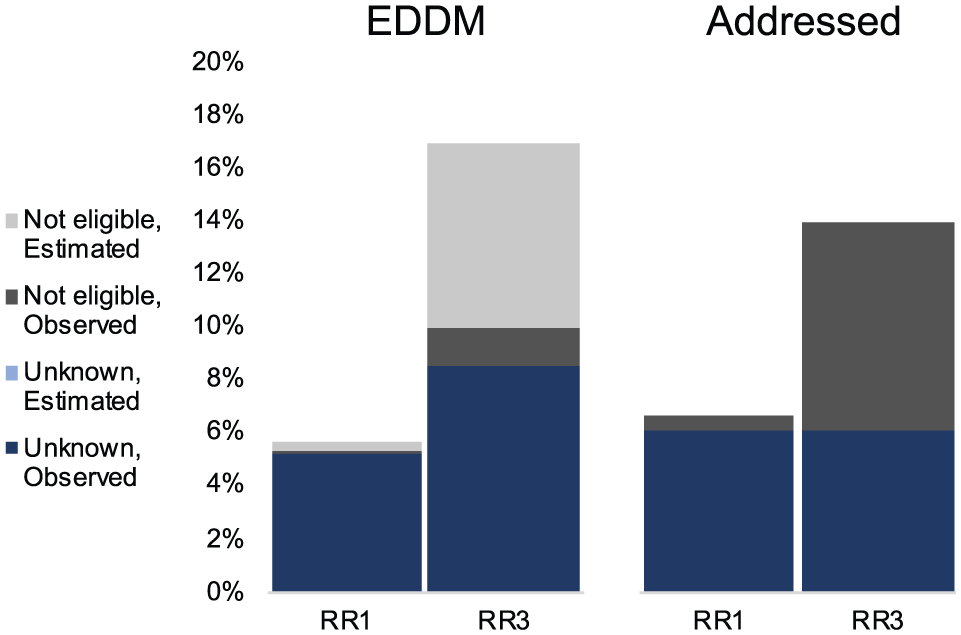
EDDM and addressed response rates, multiple definitions.
As Figure 3 shows, depending on the assumptions, this study’s reportable EDDM response rate ranges from 5.2% to 17%, and the addressed mail response rate ranges from 6.1% to 14%. Depending on which of the eight methods is used, either EDDM or addressed mail response rates are significantly (p < 0.00001) higher than the other. Notably, however, both the most conservative (RR1, unknown undeliverable questionnaire eligibility, and observed undeliverable rate; EDDM response rate = 5.2%, addressed = 6.2%, p = 0.04) and the “best guess” (RR3, undeliverable questionnaires not eligible, and estimated undeliverable rate; EDDM response rate = 17%, Addressed = 14%, p = 0.02) estimates show statistically insignificant differences in response rates after correcting for multiple comparisons. Thus, this study concludes that there is insufficient evidence to reject H1.
Another caveat to the finding that EDDM and addressed mail response rates are not statistically distinguishable overall is that EDDM and addressed mail were not equally distributed across the study regions. This choice was largely due to limitations on the minimum EDDM mailing size versus the total population size and access to purchasable mailing lists, particularly in very small communities. Given that response rates vary by location, the more appropriate comparison for EDDM versus addressed response rate is at a regional level rather than an overall study level. For example, EDDM mailings were overrepresented in states where response rates are observably lower in general, like California (CDC, 2015).
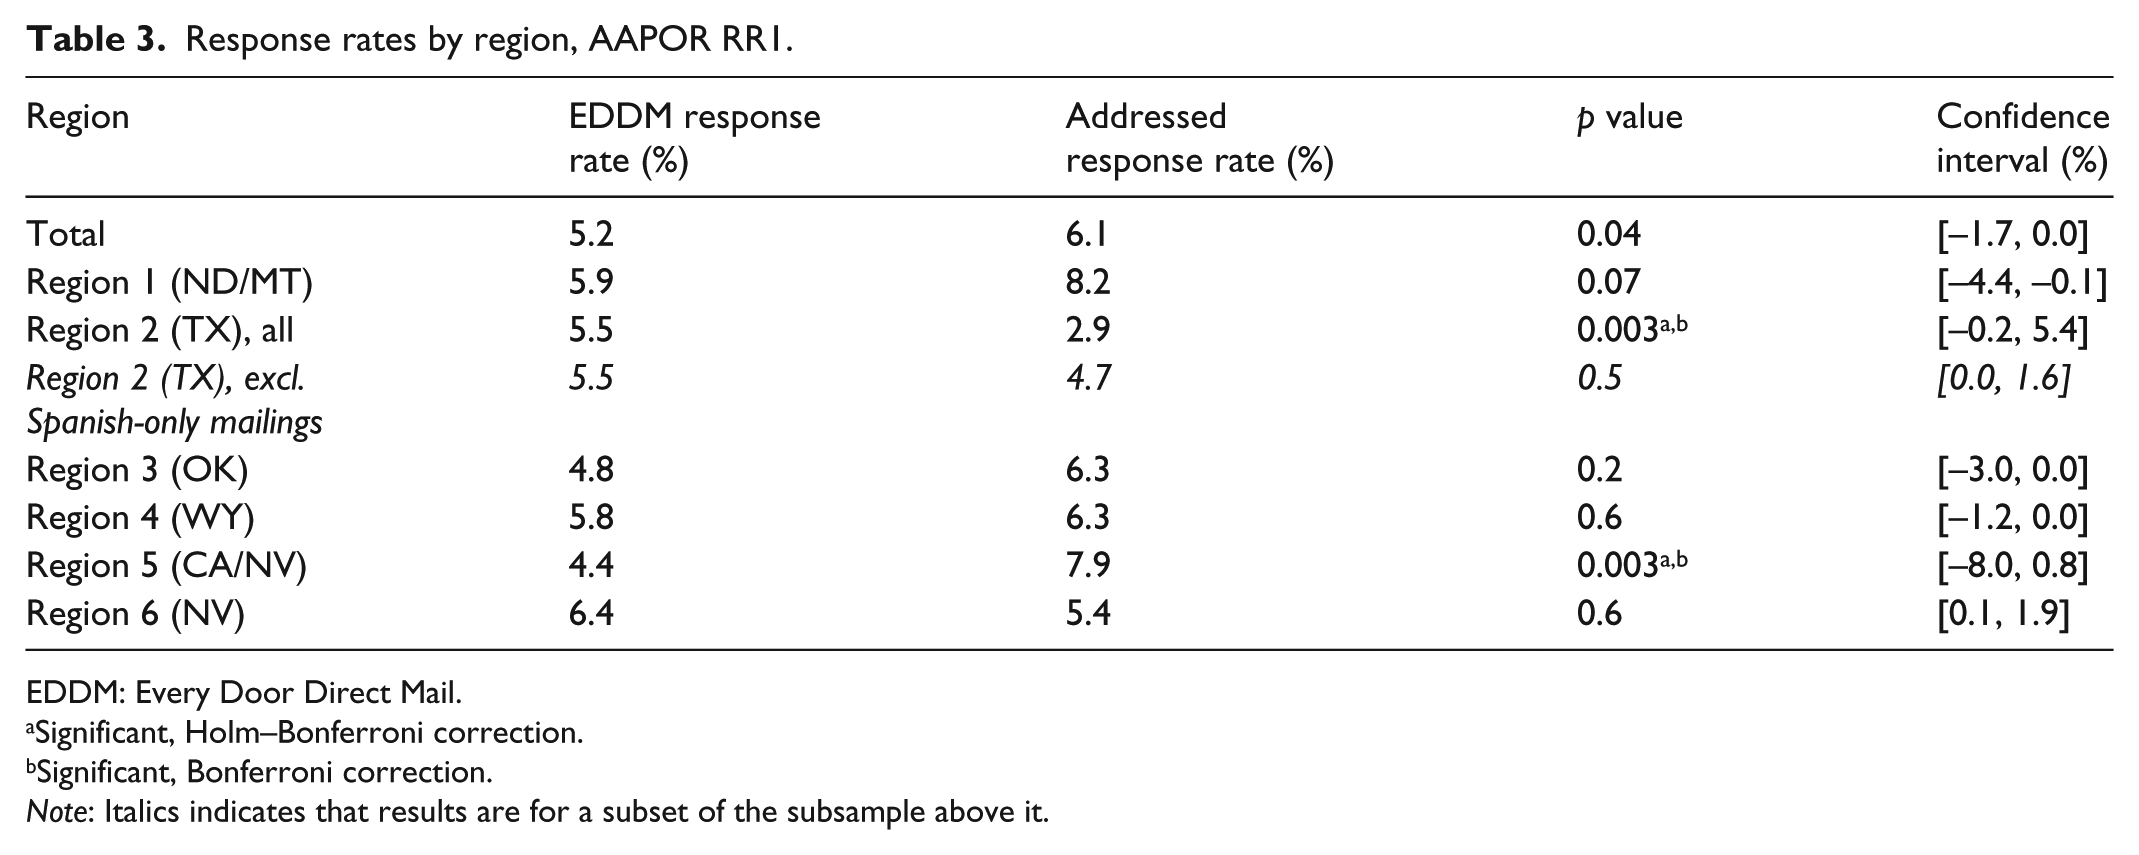
When EDDM and addressed mailing response rates are compared within the same region, statistically significant differences are still not generally observed. As with the effect of definitional assumptions (Figure 3), the direction of the effect is inconsistent. In Regions 1 (eastern Montana/western North Dakota), 3 (northern/central Oklahoma), 4 (northeastern Wyoming), and 5 (southeastern California/southwestern Nevada), addressed mail response rates exceeded EDDM response rates. In Regions 2 (south Texas) and 6 (central Nevada), EDDM response rates exceeded addressed mail response rates. In all cases except for Regions 1 and 6, 95% confidence intervals cross or include 0. The response rates (AAPOR RR1), p values, and confidence intervals are reported in Table 3.
Response rates by region, AAPOR RR1.
EDDM: Every Door Direct Mail.
Significant, Holm–Bonferroni correction.
Significant, Bonferroni correction.
Note: Italics indicates that results are for a subset of the subsample above it.
The only statistically significant response rate differences between EDDM and addressed mail (in Regions 2 and 6) are (1) in different directions and (2) subject to caveats that suggest the addressing approach was not causal. For Region 2 (Texas), where the EDDM response rate was statistically significantly higher than the addressed response rate, about half of the addressed mailings were Spanish-language surveys sent to the predominantly Spanish-speaking community of Laredo (U.S. Census Bureau, 2017). When the Spanish-only surveys are removed, leaving mailings with either English-only or both English and Spanish questionnaires, no significant difference in response rate is observed (p value = 0.50). In Region 5 (southeastern California/southwestern Nevada), the EDDM response rate was statistically significantly lower than the addressed response rate, but EDDM mailings were subject to multiple serious post office delivery issues. The most significant issue is that a change in addressing procedures concurrent with this study led to an unknown number of mismatched or undelivered mailers in the largest single zip code EDDM mailing (n = 1697). Along one carrier route in this zip code, over 20% of the mailers were confirmed undeliverable. Multiple people contacted the author or IRB and reported receiving either a prenotification or a follow-up postcard, but not other mailers, which suggests that even contacted households were inconsistently reached. Note that when these anomalies are removed, the overall RR1 response rate for the study is 6.5%. Similar observations emerge when the same analysis is performed using RR3, though RR3 tends to suggest that EDDM response rates exceed addressed response rates when proportional allocation is used to calculate e (Smith, 2009).
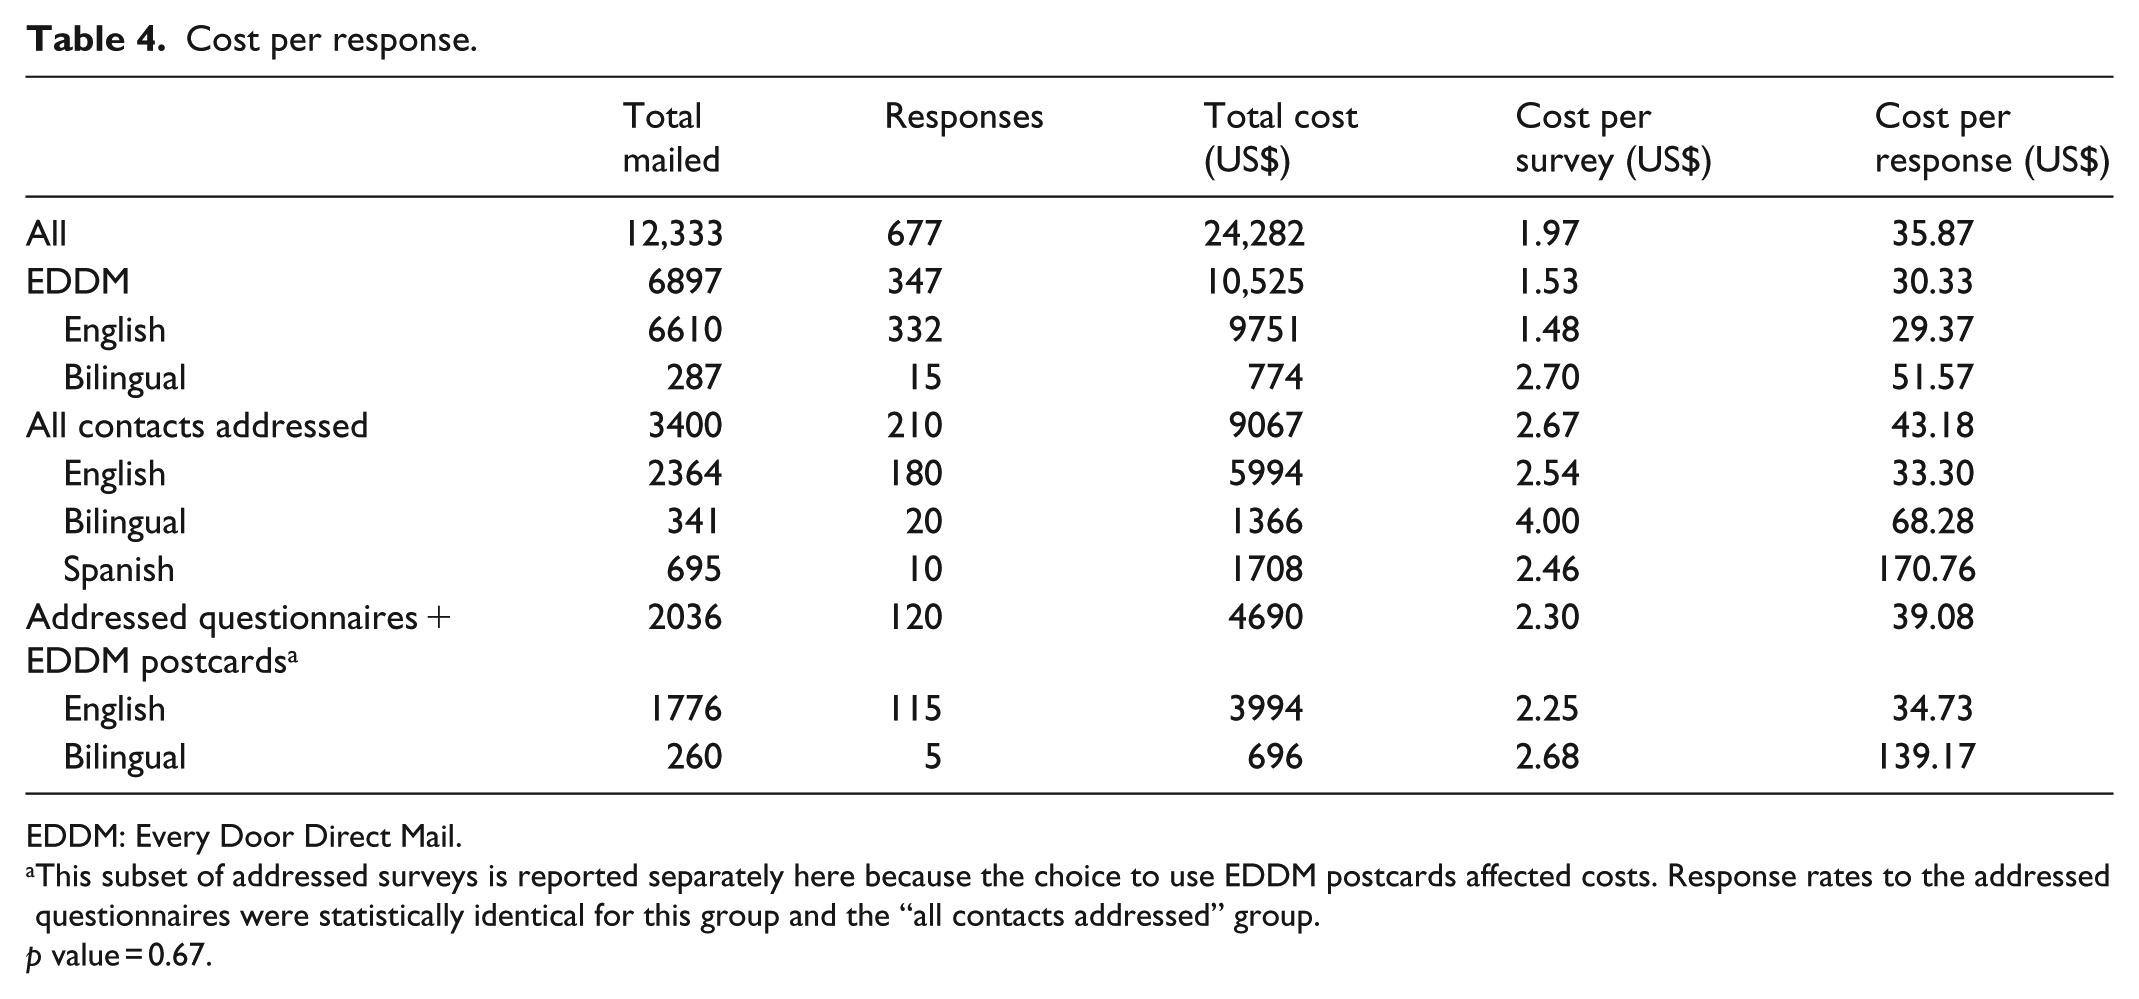
Cost per response
A primary goal of investigating EDDM as a survey distribution method is to test the relative cost per response. Costs per response for the major cost-relevant subsamples are presented in Table 4.
Cost per response.
EDDM: Every Door Direct Mail.
This subset of addressed surveys is reported separately here because the choice to use EDDM postcards affected costs. Response rates to the addressed questionnaires were statistically identical for this group and the “all contacts addressed” group.
p value = 0.67.
For simplicity, this section discusses the cost per response data for the English-only portion of the survey (10,750 of the 12,333 surveys mailed), as the higher weight of bilingual mailpieces and the need for smaller print runs of Spanish-language pieces led to higher unit costs. Overall, despite the slightly lower full-study RR1 response rate for EDDM mailings, EDDM responses cost about 10% less than addressed responses. Per mailed unit, EDDM mailings cost about 40% less than addressed mailings. This lower unit cost means that addressed mailings need to produce 1.7 responses for every EDDM response for cost/response to be equal. Note that if this study had been undertaken locally such that drop shipping mailpieces to DDUs was not necessary, the cost per EDDM response would be about US$3 lower, or about 20% less than addressed responses (requiring 1.9 addressed responses per EDDM response for equal cost per response). Using EDDM postcards in place of addressed postcards for addressed mailings was not cost-effective: EDDM postcards have less cost benefit than EDDM flats, more postcards than questionnaires were sent to avoid issues of mailing list mismatch, and the observed response rate was slightly lower (p = 0.67).
Demographics and sociability
Exploratory analysis suggests that on average, self-reported demographics are more similar to zip code-level census population demographics (U.S. Census Bureau, 2017) for EDDM responses than for addressed responses (Table 5). Using a chi-square test of independence and a significance level of α = 0.05, however, none of the differences are statistically significant. In both the groups, respondents are older, Whiter, and better educated than their populations. EDDM samples, however, were more representative of their populations on virtually all the indicators examined here.
Percentage of sample demographics for EDDM and addressed questionnaire responses as percentage of sampled zip code population demographics (100% = sample demographics match population demographics).
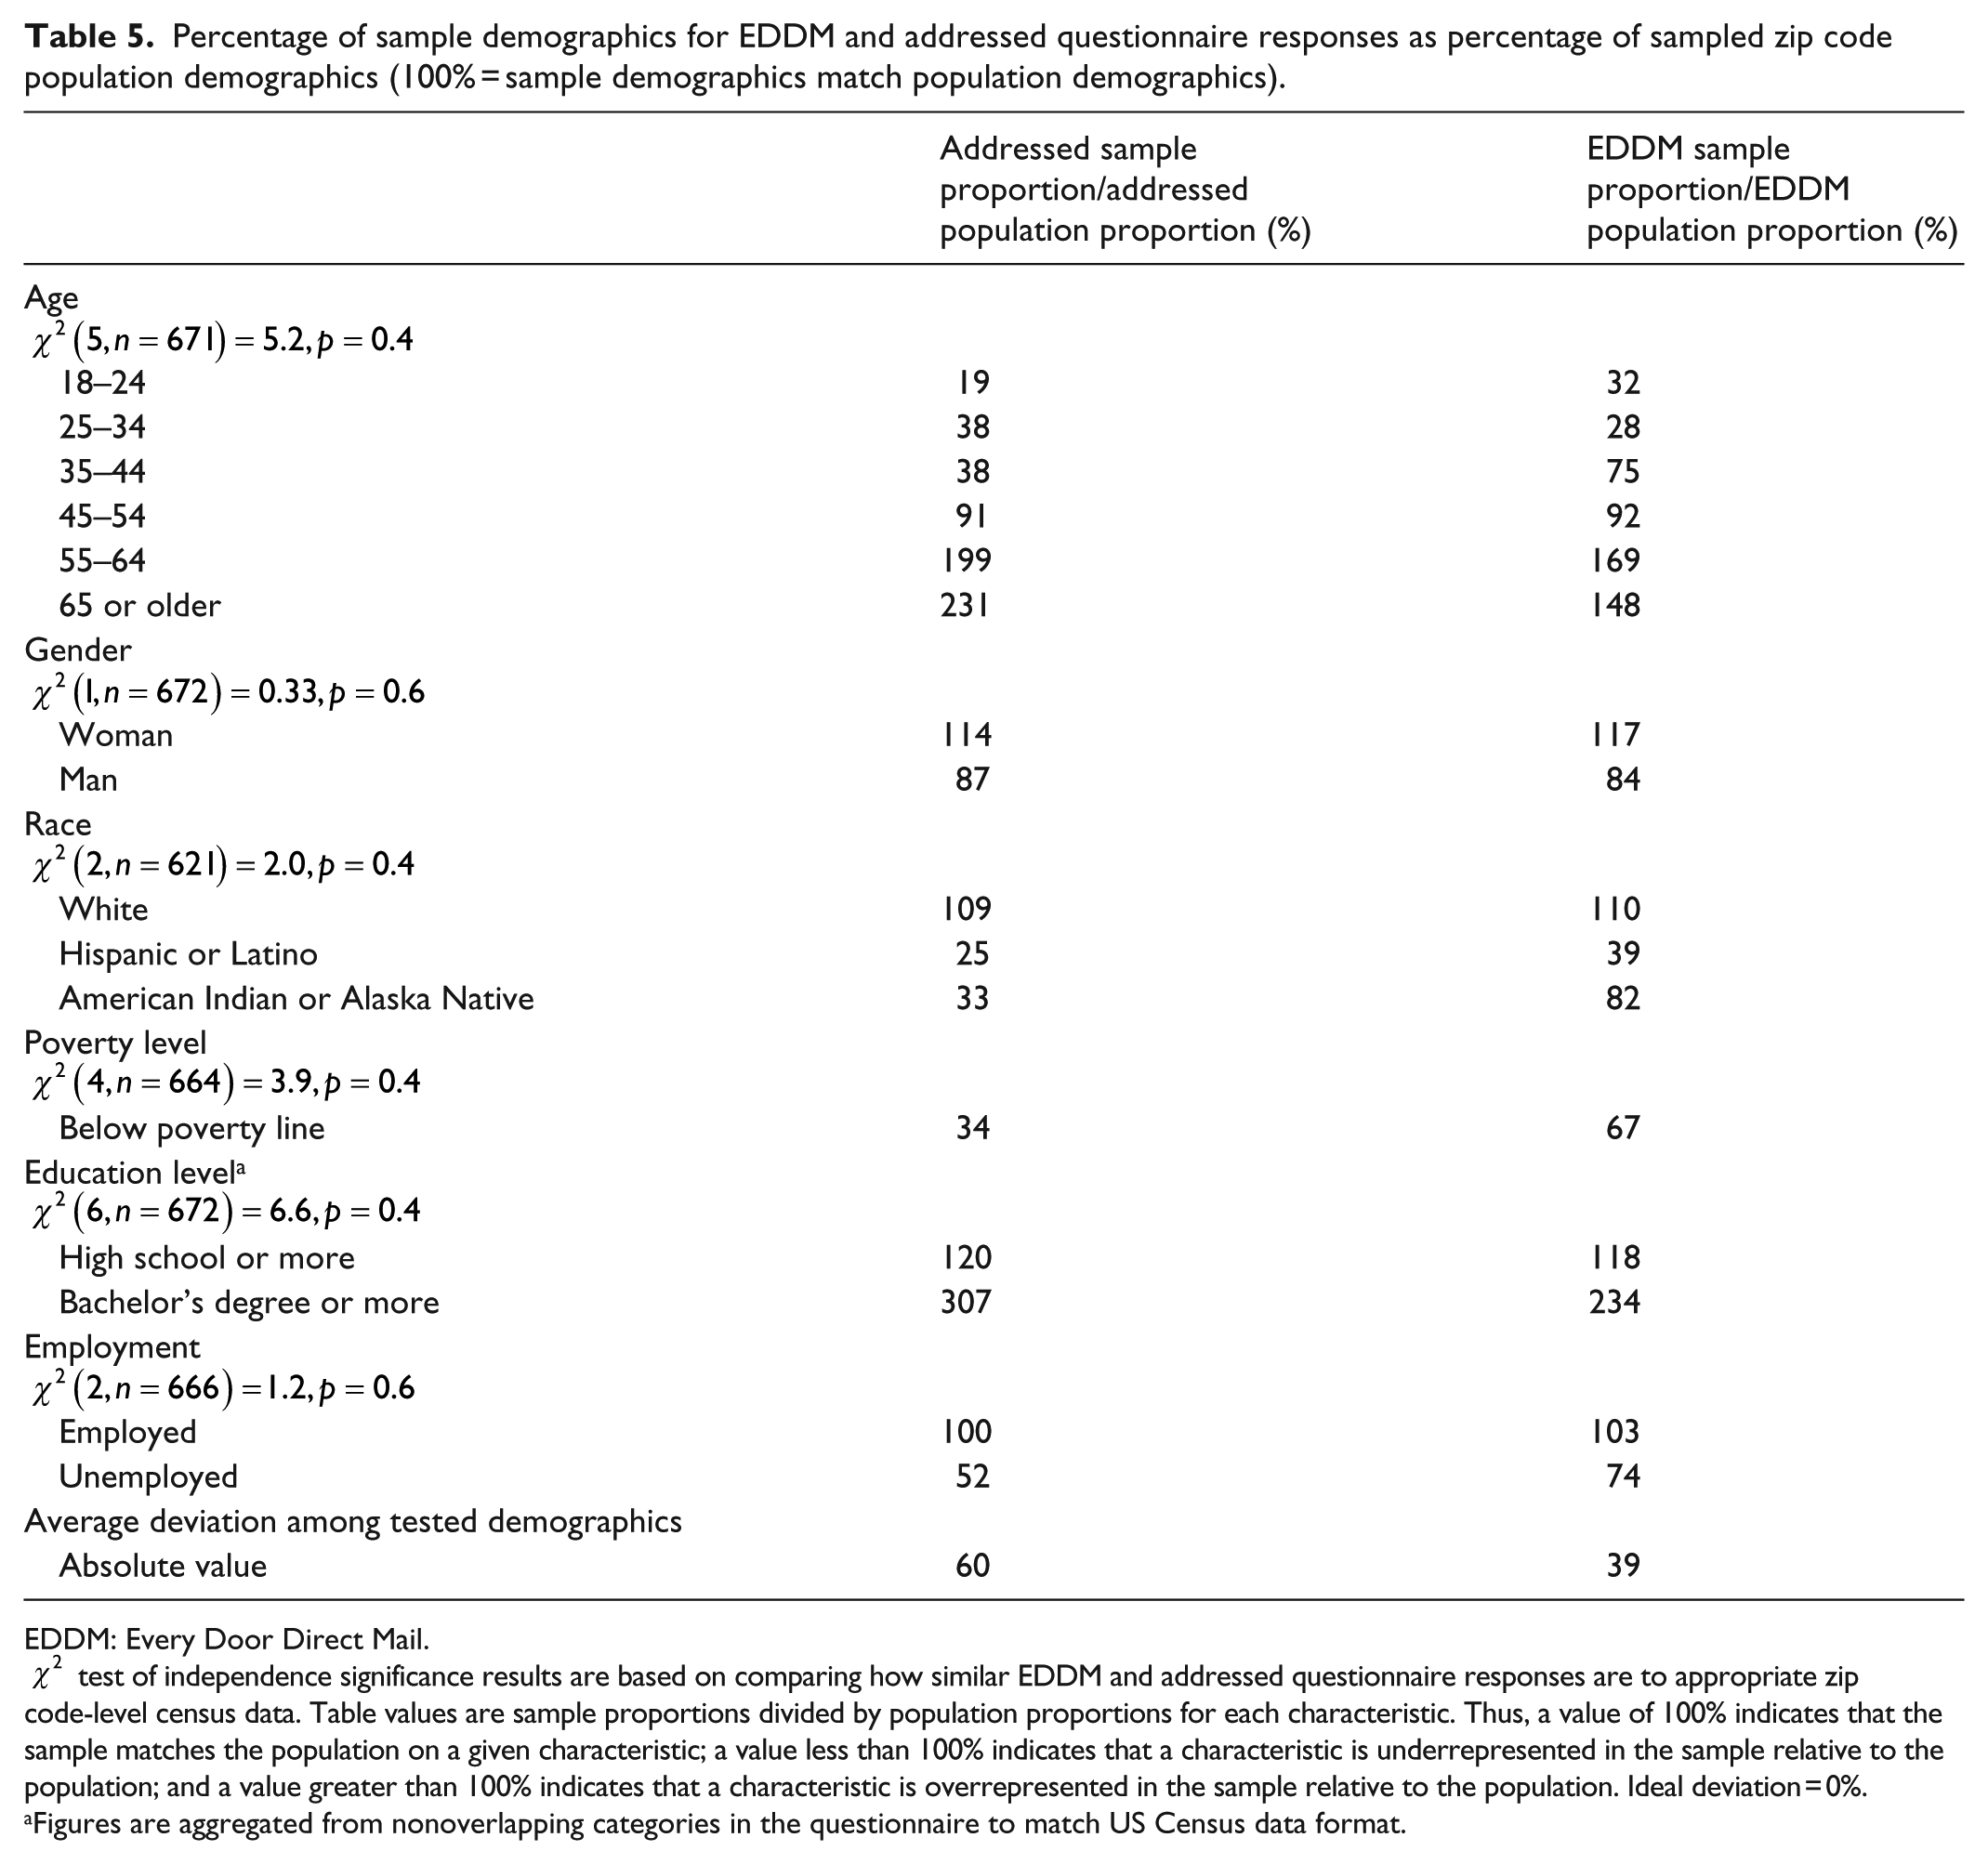
EDDM: Every Door Direct Mail.
Figures are aggregated from nonoverlapping categories in the questionnaire to match US Census data format.
EDDM responses to questions about respondent happiness and interest in the study appear to be less sociable than addressed responses, with higher reports of being unhappy and uninterested (Figure 4). As with demographic data, no results are statistically significant (α = 0.05).
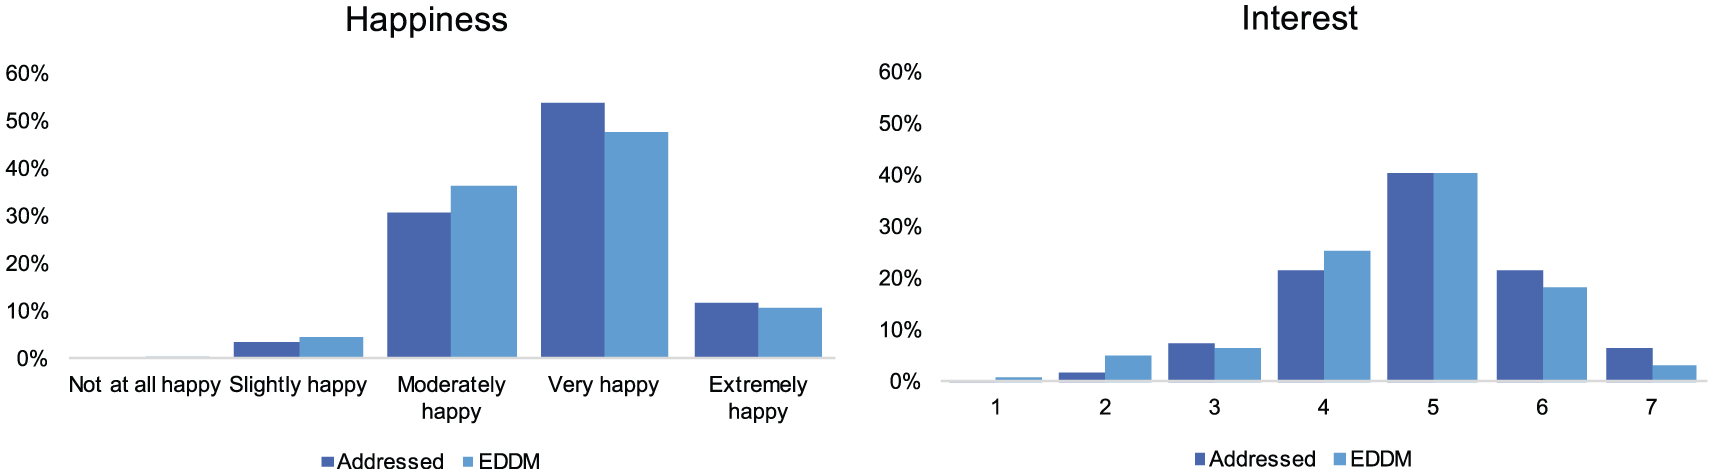
Self-reported happiness and survey interest, addressed and EDDM questionnaires.
On average, the results for the main study constructs are essentially identical for EDDM and addressed questionnaires.
Discussion and conclusion
Based on the ~12,000 address survey described here, EDDM might be viable as a low-cost, anonymity-preserving mail survey distribution tool under certain circumstances. There is insufficient evidence to reject H1 that the response rate is not different for EDDM and addressed mailings, though the data suggest that using EDDM likely slightly suppresses RR1 response rate (and slightly raises RR3 response rate). H2, that EDDM has lower cost per response than addressed mailings, is also directionally supported by the evidence. Observed cost savings of about 10% per response (~20% if bulk shipping out of the researcher’s immediate region is not necessary) are valuable but not paradigm shifting.
EDDM is not appropriate for all mail surveys. Its most limiting characteristics are likely that (1) EDDM is not a probability sampling technique at the individual level (though it could be used for geographically framed cluster sampling) and (2) nonrespondents cannot be selectively contacted. For those who can accept these limitations, however, EDDM and analogous direct mail programs are potentially useful tools—particularly if anonymity is highly valued.
Although it was not the focus of the initial study design, EDDM’s value as an anonymous census mailing method is possibly more interesting than its potential as a lower cost contact method. Based on Census data, EDDM respondents were more similar to the populations from which they were drawn, than addressed survey respondents (Table 2). Furthermore, EDDM respondents tended to provide less sociable responses (Figure 4). This observation is interesting because it suggests that something about EDDM, potentially the clear anonymity, might encourage more honest responses. This study was not designed to (and did not) detect statistically significant differences in demographics and self-description between EDDM and addressed responses, but future work might consider investigating these directional findings.
Who should consider using EDDM?
As noted throughout this article, EDDM is not a good choice for every survey. Experience from this project suggests several conditions that might be conducive to EDDM use. A good candidate study for use of EDDM is as follows:
Geographically based, as EDDM is a method for saturating specific postal carrier routes;
Population-limited, as taking a census of a small community is realistic in scale, and sampling small (particularly rural) communities with other means can be challenging, given coverage limitations;
Potentially sensitive, as EDDM is fully anonymous in a way that is clear to potential respondents;
Resource constrained, as EDDM is both logistically simpler and lower cost than addressed mail.
Studies, polls, or other investigations that might benefit from EDDM include those in which a geographic community is of interest rather than a group of individuals. For example, if an investigator were interested in how attitudes in a community change over time, EDDM could be used to repeatedly contact all community members without concern about mailing lists’ update rate, changes to specific addresses in a community, or name changes associated with a mailing list. Particularly in small community contexts, a census sample might be desirable (Groth and Vogt, 2014). Another possible application of EDDM is to solicit rare populations for participation in a study, for example, by saturating carrier routes with informational postcards.
Overall, the results from this study suggest that EDDM and similar direct mail programs merit further study in the survey community. Evidence suggests that EDDM produces similar response rates with lower costs and possibly lower demographic bias versus addressed surveys, in addition to a complete, free, address-based sampling frame. For applications that can accept its limitations, EDDM is a useful addition to the mail survey toolkit.
Footnotes
Acknowledgements
Many thanks to Noelle Herring, Grayson Melby, and Virginia Drummond for their work as undergraduate research assistants on this project.
Declaration of conflicting interests
The author(s) declared no potential conflicts of interest with respect to the research, authorship, and/or publication of this article.
Funding
The author(s) disclosed receipt of the following financial support for the research, authorship, and/or publication of this article: This work was supported by Stanford University (Emmett Interdisciplinary Program in Environment and Resources (E-IPER) Summer Graduate Research Grant; A.I. Levorsen Grant; Diversity Dissertation Research Opportunity Grant; Stanford Earth Summer Undergraduate Research Grant; E-IPER Collaboration Grant). During this research, the author was supported by the National Science Foundation Graduate Research Fellowship Program (Grant no. DGE-114747). Any opinions, findings, and conclusions or recommendations expressed in this material are those of the author and do not necessarily reflect the views of the National Science Foundation.