
Abstract
Land use change impacts on Sámi reindeer husbandry are well-documented, but existing maps often fail to capture socio-ecological relationships between herders, reindeer and nature. Conventional Geographic Information Systems (GIS) simplify these relationships, lacking local context and excluding valuable knowledge due to their rigid structure. This paper introduces participatory topological mapping, a low-tech, knowledge co-production method that allows communities to share geospatial insights without advanced software. Combining hand-drawn maps with a standardised topological structure facilitates the visualisation of geographical relationships and dynamic land use systems from a local perspective. Developed and assessed through a Swedish case study in collaboration with Vittangi and Malå reindeer herding communities, the method aims to reduce barriers to knowledge exchange and enhance dialogue between Indigenous knowledge-holders, researchers and decision-makers. The paper discusses the authors’ experiences with participatory topological mapping, emphasising its potential and limitations for knowledge exchange. The method is advocated for broader use, recognising its value in articulating concerns about land use change beyond research settings and reindeer husbandry. Participatory topological mapping enables knowledge-holders to control the map and its narrative, deciding what is included or excluded. The maps and accompanying stories are valuable sources for documenting, sharing and analysing local perspectives on landscapes and the effects of land use change. The method treats mapping as a social process with the potential to affect how we understanding the world. When thoughtfully applied, it offers a valuable avenue for knowledge co-production, fostering deeper engagement, supporting informed decision-making and empowering communities.
Keywords
Introduction
Climate and environment shape the conditions in which traditional nature-based livelihoods are practised, requiring flexibility and resilience. Sámi reindeer herders, an Indigenous community of pastoralists in northern Fennoscandia and the Kola Penninsula, use reindeer’s mobility to adapt to temporal and spatial changes in nature, a strategy shared by pastoralists globally (Behnke et al., 2011: 611; Fernandez-Gimenez, 2000; Gillin, 2021; Johnsen et al., 2019; Krätli and Schareika, 2010; Niamir-Fuller, 1999; Scoones, 1994; Turner and Schlecht, 2019). Reindeer husbandry depends on flexible landscape use and extensive, undisturbed grazing areas. However, this flexibility is increasingly threatened by land use change (see e.g. Fohringer et al., 2021; Maynard et al., 2011; van Rooij et al., 2022). Of particular concern is pasture loss and fragmentation because of industrial development.
Despite reindeer husbandry’s intrinsic geographical complexity, few maps capture the dynamic socio-ecological relations between the herders, the reindeer and nature. Maps play an important part in land use decisions (see, e.g. Hongslo, 2017; Movik et al., 2021), but capturing reindeer husbandry’s use of landscapes through conventional mapping techniques is a challenge. The result is often a simplified representation that lacks local and socio-ecological context. Geographic Information Systems (GIS) is a powerful system that enables cartographers to work with large geographical datasets efficiently. However, it is not well suited to capturing data without exact coordinates or representing Indigenous Knowledge, including Sámi reindeer herders’ knowledge, which is relational and temporal.
Many reindeer herding communities lack the resources and capacity to develop maps visualising and communicating their land use practices and perspectives on the consequences of land use change (Johnsen, 2016). This paper speaks to the need for more inclusive and flexible approaches to mapmaking. It presents an innovative method for documenting and presenting geographic socio-ecological relations between people and nature. The method builds on extensive participatory mapping methods and projects carried out across the world to engage communities in creating maps to – for example – communicate geographical knowledge, manage natural resources, community planning or support decision-making processes (Cochrane and Corbett, 2018; Corbett, 2009).
Participatory mapping tools and methods vary widely in technical complexity. On one end of the spectrum, low-tech methods include hand drawing and three-dimensional modelling using plywood, carton board, polystyrene sheets or foam mats (Rambaldi, 2010), while more digital tools such as annotated aerial photographs, web mapping and participatory GIS cover the other side of the spectrum (Adams et al., 2023; Fagerholm et al., 2021; Giuffrida et al., 2019). Low-tech solutions are often more inclusive, less costly and more accessible to implement. Participatory approaches using digital mapping solutions offer scalability, standardisation and integration with other digital analysis and visualisation tools.
However, the method presented here uses hand-drawn maps combined with a rigid topological structure common to GIS systems. It is both simple to use and allows for scalability and comparison of participatory maps across different geographies. Through its standardised approach to visualising geographical relationships, the method also provides a tool for communicating local perspectives on dynamic land use systems that change over time. The authors call the method participatory topological mapping. In line with Sletto et al. (2021), they emphasise mapmaking ‘as situated, embodied and contingent’ performances. As land use changes are ongoing, the authors argue that the outputs (the maps and narratives) should be considered fresh produce.
Participatory topological mapping is based on the four principles of knowledge co-production as suggested by Norström et al. (2020): 1) The method was adjusted to fit the concerns of the herding communities engaged; 2) the mapping and storytelling sessions focussed on multiple ways of knowing; 3) the study and its outputs were organised to address the needs of the participants; and 4) there was mutual learning during several interactions between the researchers and participants. The method does not require GIS skills and access to technology, allowing communities to use it independently to share geospatial insights and concerns.
The participatory topological mapping approach was developed, used and evaluated in a case study during 2021–2023. The study aimed at capturing and communicating herders’ dynamic use of space and increasing public awareness of the herders’ experiences with how land use change affects Sámi reindeer husbandry in Sweden. The authors of this paper are three researchers (Johnsen, Westerveld and Persson) and two reindeer herders (Stenberg and Juntti). One of the researchers (Persson) is also a member of a reindeer herding community in the southern part of Swedish Sápmi. Close cooperation with two study participants made it natural to include them as co-authors. When referring to the group of authors, the paper uses ‘the authors’. It also differentiates between ‘the researchers’ and ‘the community representatives’ when appropriate.
The paper shares the authors’ reflections on the potential and limitations of using participatory topological mapping for knowledge exchange and empowerment. While the case study presented used the method in a research setting, the authors find that it can also be used independently by communities to communicate their concerns about land use change.
To contextualise the use of participatory topological mapping in the case study, the paper briefly presents Sámi reindeer husbandry and different types of mapping. It gives an overview of the current uses of maps in land use decisions concerning reindeer husbandry in Sweden.
Sámi reindeer husbandry
The Sámi are an Indigenous People of a region that today stretches across the northern parts of Sweden, Norway and Finland and the Kola Peninsula in Russia. In this region, often called Sápmi, the land of the Sámi people, reindeer husbandry is a traditional livelihood. In Sweden, reindeer husbandry is divided into fifty-one herding communities, constituting geographical, economic and legal entities. Most are mountain herding communities with long migratory routes between summer and winter pastures. Ten units are forest herding communities with shorter migration routes and utilise the grazing resources within forested areas throughout the year. In addition, eight units are known as concession communities, where reindeer herding is conducted with special permission. Most reindeer owners in Sweden are Sámi, but non-Sámi individuals can also own reindeer within the concession areas.
Sámi reindeer husbandry is based on extensive Indigenous Knowledge about the reindeer, herding practices and the surrounding environment. This knowledge is gained through experience and transferred from generation to generation. Díaz et al. (2015: 13) explain Indigenous Knowledge as ‘[a] cumulative body of knowledge, practice and belief, evolving by adaptive processes and handed down through generations by cultural transmission, about the relationship of living beings (including humans) with one another and with their environment’. Indigenous Knowledge is not static; it is constantly ‘carried out, tested, and renewed’ through a continuous process of adapting to the surroundings (Sara, 2009: 175). Traditional reindeer herding knowledge contains strategies for structuring a herd and moving through the landscape to benefit from the seasonal changes and the pastures’ diverse grazing resources and to minimise the negative impacts of the harsh climate, insects and predators (Paine, 1996).
The right to reindeer husbandry in Sweden is exclusive to the Sámi people. The livelihood is a recognised prerequisite of Sámi languages, Indigenous Knowledge, culture and traditions. Reindeer husbandry is ‘declared a matter of Swedish national interest (in the environmental code), emphasising the possibility of preserving reindeer grazing rights on private and state-owned land, according to law’ (OECD, 2019: 33). Yet, this traditional livelihood is threatened by several competing land uses that are also considered national interests (e.g. road transport, mineral resources and nature conservation). OECD (2019: 18) states, ‘Large infrastructure projects, mining activities, energy installations and forestry activities negatively impact access to grazing land and the reindeer’s main food – ground and tree lichen’. For example, Sandström et al. (2016) found a 71 % decline in lichen-abundant forests since the introduction of modern forestry practices in the 1950s. Also, the UN Committee on the Elimination of Racial Discrimination criticised Sweden in 2013 and 2017 for not considering Sámi reindeer herding communities’ rights when allowing mineral extraction within reindeer grazing areas.
Another factor that affects reindeer husbandry is global warming. Warmer temperatures are driving changes in flora, fauna and the physical appearance of the landscapes. The mean winter temperatures are increasing, and consequences include changes in the snow structure, reductions in lake and river ice cover and increases in winter thaw events (Hanssen-Bauer et al., 2023) – all of which affect the reindeer’s mobility and access to forage. Moreover, these changes affect the reindeer’s behaviour. For example, the Swedish Transport Administration (Trafikverket) reports that more reindeer are killed in traffic in years when snow and ice make access to grazing resources difficult (Aftonbladet, 2020).
Literature review
The authors refer to conventional maps to describe those we use to orient ourselves when hiking, navigating a city’s streets or when engineers plan a new road. These maps represent accurate locations, distances, angles (bearing) and shapes of the built and natural environment on a two-dimensional plane. Features commonly represented on geographical maps include roads, waterways, forests, etc. A cartesian grid system of latitudes and longitudes underpins empirical maps. Using different projection systems, the cartesian grid allows mapmakers to accurately place features from the real world on a map.
Geographical maps have been hugely beneficial to society but have also been shown to have limitations when it comes to conveying human experiences (Anthias, 2019; Mere-Roncal et al., 2021). Maps play a vital role in land use decisions but also have a long history of use to claim ownership and extend authority over people and lands (Alderman and Inwood, 2021). Critiques of GIS tools and mapmaking practices have emphasised the power inherent in maps and mapmaking, which is often neglected. For example, while maps are generally understood as neutral and apolitical, they can obscure cultural and socio-economic hierarchies of representation (Anthias, 2019; Crampton, 2009). Still, maps are generally evaluated as good or bad based on their aesthetic qualities and design, or ‘straightforward representation’ (Crampton, 2009: 841). However, there is a call for understanding maps as practices and acknowledging their performative potential (Crampton, 2009; Sletto et al., 2021).
Maps are powerful objects that shape perceptions and control discourse. Simple acts like not labelling a region can make entire communities invisible to a map reader (Bryan, 2015). As simplified representations of the natural world, the larger the real-world area represented on a map is, the more geographic data about that area must be simplified for the map to remain legible to its reader. When making a map, ‘choices have to be made about how to simplify the complexity of the world to be understandable on the map’ (Manson, 2017: 79). Mapmakers must choose what and how to show information. Conscious and unconscious decisions reflect the cartographer’s understanding of the mapped space. Drozdz (2020: 367) compares a map to a discourse about the world, which ‘can make an issue visible or invisible and influence how a problem is addressed’. Through their maps, cartographers participate in building societies’ understandings and interpretations of the world (Drozdz, 2020). In turn, these understandings shape the work of cartographers and ‘how maps are made and used’ (Bryan, 2015: 249).
Maps used for communicating reindeer husbandry and land use issues
Sweden’s Sámi Parliament, the central administrative authority for reindeer husbandry in Sweden, provides an open-access database (called iRenmark) of maps representing the land use of all reindeer herding communities. The maps present seasonal pastures, migration routes, herders’ infrastructure (e.g. fences and cabins) and community administrative borders. However, the maps provide a static presentation of a livelihood that constantly adapts to changes in the landscape and weather.
In 2005, Sámi herding communities began developing reindeer husbandry maps to visualise and explain the land use in a way that enabled outsiders to understand and consider its dynamics (Sandström et al., 2017). The purpose was to develop and maintain GIS maps that presented the herders’ multiple uses of the areas and competing land uses that negatively affected reindeer husbandry. The initiative (called RenGIS) came from the need for a tool to be used in dialogue and consultation around municipal planning and environmental impact assessments for competing land uses, such as forestry, mining and wind power (Sametinget, unknown). The communities developed online GIS maps that include information about grazing grounds, migration routes, difficult passages, infrastructure, competing land uses and GPS data on the reindeer’s movements over time. The maps also classify the grazing lands (e.g. forests, mountains and wetlands) and give an overview of land use changes. The individual community carries out the mapping and digitalisation of the spatial data. Moreover, the GIS maps are the property of the communities.
To use the full extent of the GIS tool, the herding community needs GPS-fitted reindeer and training in ‘interpreting satellite images, GIS, GPS, data management, field inventory methods, species identification, forestry measures, communication, and managing consultations’ (Sametinget, unknown: 3). Focussing on exact coordinates when recording this land use system in a GIS can come at the cost of capturing the essential relational dimension between spaces used and created by the reindeer herding communities. It reflects a dominant trend in environmental governance to translate Indigenous Knowledge and practices into discrete packages of knowledge that can be incorporated into the existing toolkit of practitioners and decision-makers (Blaser, 2009; Mistry and Berardi, 2016; Nadasdy, 1999). Attempts to capture parts of Indigenous Knowledge in GIS software create a similar challenge (Chambers, 2006). There is a need for a more inclusive and low-tech approach to presenting local concerns, reflecting Indigenous Knowledge and addressing dynamic socio-ecological relations between the herders, the reindeer and nature.
Participatory mapping
Participatory mapping combines participatory methods and geospatial analysis to create maps to provide ‘a visual discussion and representation of a place and the important features or issues within it’ (Mere-Roncal et al., 2021: 3). Participatory and counter-mapping facilitate discussion about spatial knowledge and emphasise local uses and values of the geography represented. Through these processes, local communities can drive the map narrative and decide what is shown and how it is visualised. McCall (2021) outlines four roots of participatory mapping since the late 1970s: (1) Desire for people’s participation in decision-making; (2) Interest in critical spatial knowledge opposing hegemonic knowledge; (3) Recognition that people’s spatial knowledge has validity and value and (4) Access to user-friendly geographical information technologies.
While participatory mapping can engage local communities with the intent to support social change and empowerment, the process has also been ‘used purely to extract information from participants’ to the advantage of outsider’s agenda (Cochrane and Corbett, 2018: 4). Participatory mapping critique includes concerns about the representative capacity of maps and the fact that sensitive information is shared outside the local community. For example, static maps misrepresent the land use of mobile species and human harvest practices adjusted to seasons and weather, and maps may increase governmental regulations by drawing attention to local uses (Gadamus and Raymond-Yakoubian, 2015).
Chambers (2006) argues that the outcome of participatory mapping depends on who controls the process and the behaviour of the facilitators. Bryan (2015) also engages with power relations within participatory mapping. He argues that participatory mapping follows ‘certain cartographic conventions that make maps recognisable to others’ and that the very act of making a map look like a map means adhering to the dominant understandings of ‘what can be mapped, their visual style and content’ (Bryan, 2015: 249). Bryan (2015: 257) suggests participatory mapping can ‘challenge our understanding of what counts as a map’. To empower participatory mapping, we should focus less on instrumentally representing the real world on maps and treat mapping as a social process that can ‘alter understandings of the world and our ways of being in it’ (Bryan, 2015: 257). A broad range of scholars has engaged in discussions on the asymmetric power relations between community members and researchers in participatory mapping (e.g. Brown and Kyttä, 2018; Cochrane and Corbett, 2018; Laituri et al., 2023). However, if sensitively planned and implemented, participatory mapping offers a potential for knowledge co-production (Laituri et al., 2023).
Topological maps
A topological map prioritises positioning objects on a map based on their relationships to one another rather than their accurate location in space. The spatial relationships are defined by a field of mathematics called topology. In a two-dimensional space, a limited number of topological relationships can exist between two spaces or objects. Some combinations include one area inside another, one area outside another, two areas intersecting or two adjacent areas (Egenhofer and Franzosa, 1991). When we orally describe the spatial relationships between places, we rely on describing these relationships topologically. For example, the calving grounds are inside the summer pastures, and the mining area covers parts of the winter pastures. Developing maps using these topological relationships emphasises the story being told (Westerveld and Knowles, 2021).
A typical example of a topological map is a subway map, where the story is the order of the subway stops on each subway line and the interconnections between these stops rather than their exact location. The thinking behind topological mapping is that people usually do not know the precise positions of objects such as a subway station, a road or a reindeer grazing area. Instead, people locate themselves and landscape elements according to the elements’ relationships to each other.
Introducing participatory topological mapping
The authors developed the participatory topological mapping approach to capture reindeer herders’ perceptions of space, their complex and localised use and how land use change affects their livelihood. The method is inspired by the topological mapping conducted in the research of Westerveld and Knowles (2021), who used topological maps to present holocaust survivors’ meanings of place as presented in their recorded accounts. They showed that topological maps – without metric spatial relations – have much in common with the spatial relationships embedded in human language and geographical description. The authors of this paper have developed topological mapping into a participatory approach through researcher-herder cooperation. The purpose was to prompt stories and perspectives on land use dynamics and changes, values of wetlands and other ecosystems and threats to ecosystems and herding practices.
Before the case study presented in this paper, two of the researchers (Johnsen and Westerveld) conducted pilots with reindeer herding youth at a leadership training at the second Arctic Biodiversity Congress in Rovaniemi, Finland, in 2018 and at the Arctic Circle in Reykjavik, Iceland, in 2019. The latter training included a conference session where youth representatives drew and explained land use issues related to their reindeer husbandry in front of conference participants. Feedback from the youth and the audience encouraged them to develop the method further. This case study used participatory topological mapping more systematically, involving reindeer herders from two different communities in northern Sweden. Two of the researchers (Johnsen and Persson) established contact with the communities and were invited to facilitate mapping sessions in May and September 2022. In April 2023, there were new gatherings with the communities to evaluate the outcomes of the mapping process. In June (same year), the results and experiences were shared and discussed at a plenary session of the annual conference of the National Association of the Sámi People in Sweden (shortened SSR and in Sámi: Sámiid Riikkasearvi). The presentation at the SSR conference also included a live drawing session with one of the researchers (Persson) and the two community representatives.
Participatory topological mapping enables herders with no background in scientific mapping techniques to quickly produce maps communicating their use of space and how existing and planned infrastructure might impinge on this use. Rather than using pre-made maps to depict land use change, this approach starts with a white sheet of paper and coloured markers. Facilitated by a semi-structured interview, the participants share information while depicting (on the white page) the spatial elements they regard important for telling their story, how the elements relate to each other and how the landscape and the spatial elements affect and are affected by different forms of land use. Participatory topological mapping allows the participants to express their experiences through storytelling, an approach central to Indigenous epistemologies, pedagogies and research (Iseke, 2013).
The method developed includes six steps: (1) Develop an interview guide; (2) Identify and invite participants; (3) Conduct mapping sessions; (4) Synthesise and analyse information; (5) Review the synthesis and (6) Evaluate the method. These steps are explained further in the next section.
Case Study
Contextualising the case study: Vittangi and Malå Sámi reindeer herding communities
Vittangi and Malå are both Sámi forest reindeer herding communities. 1 Like other forest herding communities in Sweden, they stay in lowland forested areas year-round. The forested areas include diverse types of pastures, which the herders utilise at different times of the year. During winter, the reindeer mainly graze on ground lichen typically found in old spruce and pine forests. In spring, before calving, the reindeer herds migrate to wetland areas that become green early, where nutritious plants grow close to the water springs. During the rest of the bare ground season, the herds graze in the wetland areas. Preferred wetlands are those surrounded by old forests, which provide an invaluable combination of nutrition-rich vegetation near shelter during warm summer days. Vittangi and Malå have similar annual grazing cycles but face different threats to their land use practices. The most significant changes to Vittangi are the loss of winter pastures due to forestry and disturbances from tourism. The community is also concerned about how mining and wind park prospects might affect their practices. Malå faces the continued loss of pastures to forestry, mining activities, wind parks and hydropower. The effects of further fragmented pastures due to a new railroad and highway cutting across the winter pastures are an additional concern. The herding communities also face challenges caused by climate change and predators, which adds to the cumulative effects of land use changes and fragmentation.
Both Vittangi and Malå herding communities are divided into smaller winter herding groups. This study engaged the four winter herding groups of Vittangi and the three groups of Malå in mapping and storytelling sessions.
The procedure of the participatory topological mapping within the case study
Identifying and inviting participants
When the study idea arose, SSR (one of the initial project partners) suggested inviting Vittangi and Malå as partners, as they represent the northernmost and southernmost forest reindeer herding communities in Sweden. Both communities accepted the invitation and explained their interest in educating the public about how land use changes threaten their livelihoods. Initially, the project focussed on traditional knowledge of wetlands conservation. However, after consulting the communities, it was agreed to expand the study to look at all ecosystems within the herding landscapes. Also, the idea of including mapmaking came from the dialogue between the researchers and the communities.
In agreement with the herding communities, all winter herding groups were engaged in the study. The aim was to have different generations represented, including more perspectives and facilitating internal knowledge exchange. Before the first visit to the communities, two of the researchers (Johnsen and Persson) invited the herding groups to a virtual meeting to present themselves, explain the purpose of the study, explore how it could be adjusted to address the communities’ needs and concerns and discuss the collaboration. Three members of the Vittangi community, including the chair, attended the meeting. It was not possible to organise a similar meeting with the Malå community. It was a busy period for the herders, so the workshop was planned by phone with the community chair. Workshop dates that suited the herding groups were decided, and invitations were distributed.
Developing an interview guide
Informed by the virtual meetings and discussions with community members, the three researchers drafted an interview guide to help tease out knowledge and information about the geography of reindeer husbandry. More than providing a set of fixed questions, the guide included themes that the workshops should cover. As such, the guide focussed the conversations. It also helped streamline the use of figures and colour coding during the drawing sessions. The guide suggested that the participants develop three drawings illustrating encroachment and land changes over time and how these affected the herding communities. The first drawing presented the communities’ pastoral land use before the large-scale land encroachment occurred. The second drawing visualised their current land use and impacts from competing land uses. The third drawing outlined planned and increasing geospatial threats to reindeer husbandry.
The initial plan was to visit the communities to discuss the collaboration and detail the workshops together. However, due to the unforeseen circumstances of COVID-19 restrictions, our dialogue occurred only virtually before the first workshop. The guide was adjusted during the mapping sessions to compensate for the lack of development involvement and ensure its relevance.
Conducting the mapping sessions
Over three days in May and three days in September 2022, two of the researchers (Johnsen and Persson) conducted individual and joint mapping and storytelling sessions with the winter herding groups of Vittangi and Malå. All participants provided written informed consent. In both cases, the researchers spent half a day visiting parts of the field before the mapping sessions. The purpose of the field trips was to prepare themselves by getting to know the locations and some of the spatial issues of concern to the herders. For both communities, the chairs organised the groups’ attendance; the researchers facilitated the sessions. One of the group sessions had four participants; the others had two participants. The sessions were scheduled for four hours but lasted between two and six hours. There were breaks every hour, refreshments and lunch.
Facilitated by the interview guide, each herding group explained their land use and impacts of land use change through storytelling and by drawing topological maps. They used coloured markers and large sheets of white paper (A1; 80 cm × 59 cm), and each herding group produced three drawings presenting the past, present and future threats (as explained above). Each element added to the drawing (e.g. calving grounds, summer and winter pasture) was numbered, and the researchers kept a record to track what the elements symbolised. The sessions were also documented through photos and audio recordings (Figure 1).
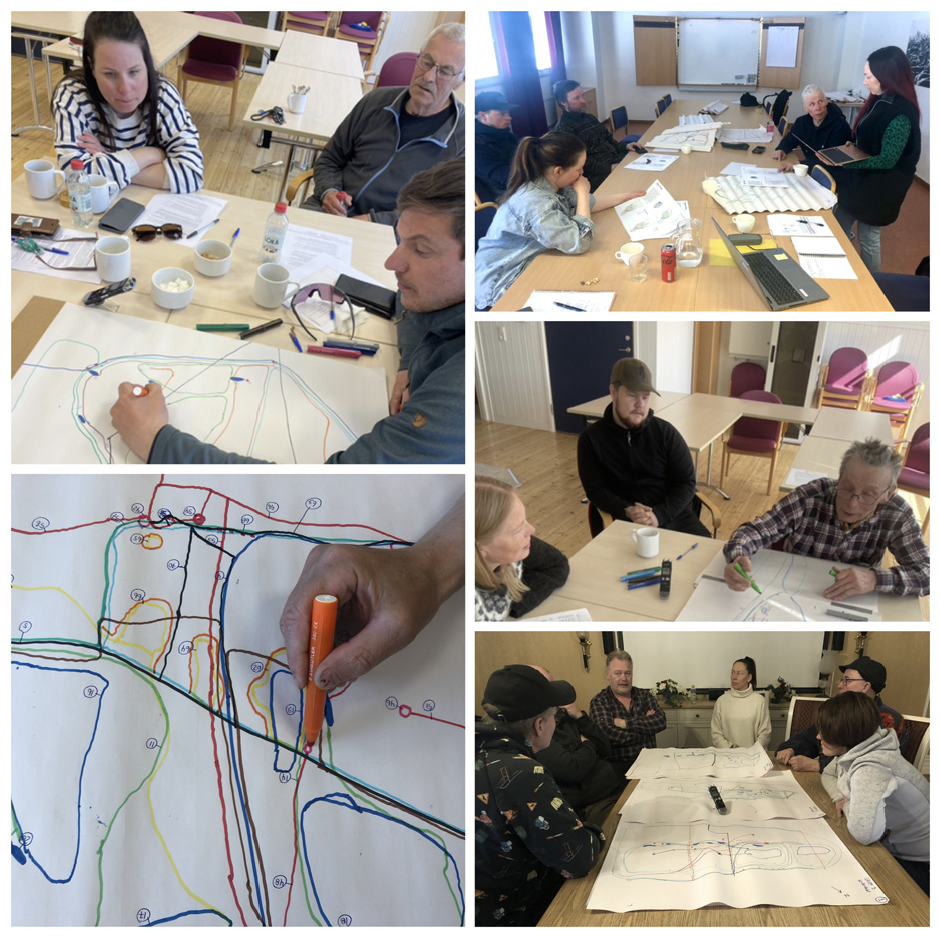
Community members of Vittangi and Malå illustrate and describe their reindeer herding practices using the method developed within the study.
The researchers fine-tuned the interview guide based on their experience working with the first community. A better flow was achieved by starting the mapping session by drawing a polygon that symbolised the outer extent of the community and adding fixed landscape elements, such as lakes and rivers. By beginning each of the three maps similarly, the participants could more easily orient themselves in the landscape portrayed. Adding dynamic elements, such as migration routes, also became more manageable. There were extra sheets of paper in case the participants wanted to redraw a map. The community representatives (the co-authors) participated in the mapping session with their winter groups. They contributed extensively to testing and discussing how the approach could be improved and better communicate land use issues from a herders’ perspective. This provided significant input to the evaluation (step 6 in the procedures).
When all herding groups had been through the mapping exercise, the researchers facilitated a joint workshop for the participants from the communities. During the workshops, the groups presented and explained the maps to each other. The groups could relate to each other’s maps because they shared the meanings of the symbols and colours used (following the interview guide). The presentations triggered discussion among the participants. They identified similarities and differences in the information mapped. The workshops facilitated transparency about the groups’ concerns and made it possible to clarify questions and adjust mistakes. Moreover, the workshops prompted reflective discussions among the participants and allowed adding details and nuances to the groups’ narratives.
Synthesising and analysing the information
The three researchers synthesised and analysed the information gathered during the sessions and identified inconsistencies between the drawings and the information shared during the interviews. Part of the synthesis was reviewing the maps and formulating short narratives based on the stories the herders shared during the sessions. As requested by the participants, the purpose was to prepare outreach material with concise texts and digitalised maps to inform the public about the effects of land use changes on reindeer husbandry (Figure 2). This process was conducted in agreement with the communities; they preferred that the researchers wrote texts and that the herders reviewed and approved the outputs.
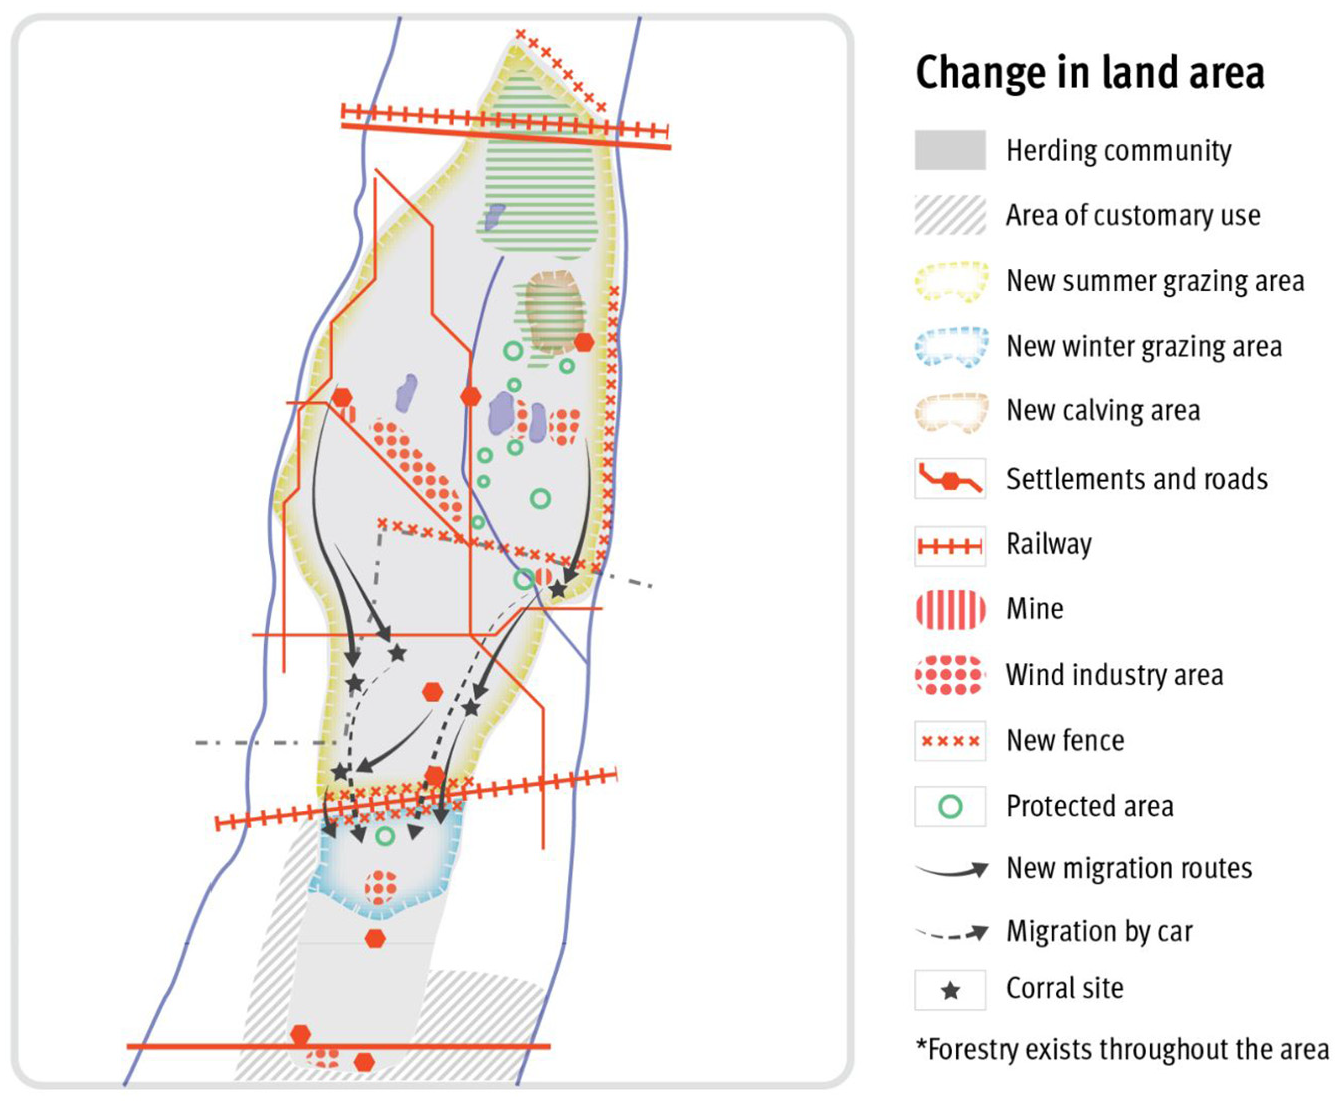
A digitalised version of the hand-drawn map for one of the herding groups in the Malå community showing different types of geographic information.
Reviewing the synthesis
A second round of workshops with the Vittangi and Malå communities was conducted in April 2023. These workshops aimed to review and edit the synthesised material and ensure it reflected the herders’ perspectives and knowledge. The workshops also discussed how an external audience would perceive the maps and narratives and how to present them to avoid misinterpretations. The workshops also identified new concerns and land use impacts that the participants had not included during the previous year’s mapping sessions. Thus, the maps and narratives were reworked to make them coherent and suitable for communicating to decision-makers and people who know little about reindeer husbandry. The revised maps and texts were shared with the communities for final approval in December 2023.
Evaluating the method
After the review, the topological participatory mapping approach was evaluated with the participants. The feedback gave valuable information about the experience of using the method to communicate reindeer husbandry and land use. Further, the feedback from the audiences of the live mapping session at the SSR conference in June 2023 gave input on the experience of how it was to receive information through this tool. The outcome of the evaluation is presented in the discussion below.
The participatory topological mapping approach produced several complementary outputs: the drawings and the accompanying stories. The drawings served as a basis for a more focussed discussion about land use and herding practices, and the stories triggered follow-up questions from the listener. An additional output is the shared learning and experience from the workshop.
Results and discussion
The paper has introduced an approach for co-producing knowledge related to land use change and outlined a process for gathering, discussing and validating information through a case study. The following section emphasises the use of participatory topological mapping as a valuable tool for enhancing dialogue. Furthermore, it discusses the tool’s potential for empowering individuals to express spatial and temporal concerns on their terms. It also acknowledges some limitations and problems encountered while using the tool.
A tool for enhancing dialogue
The participants quickly grasped the concept of topological mapping. The approach was easily explained by illustrating how it could be done. The authors found that the participants’ drawings and narratives complement each other and offer a more effective way to share knowledge and perspectives than one of the approaches alone. The drawings present topological maps of human-reindeer-nature relations. While the maps show the landscape, reindeer herding practices and other land uses, the narratives include aspects that are not easily visualised, such as herders’ relations with and valuations of the land and its resources.
Topological mapping can provide an overview of land use across large areas or focus on details in a smaller location. The complexity of the map depends on the creator’s needs and choices. One of the participants in the case study acknowledged existing mapping tools for quantitative data, which emphasise technical aspects of land use change (such as the number of square meters of forest clearing or land lost to wind turbines). The same participant argued that additional tools are necessary to convey the intricate nature of reindeer husbandry. He explained: ‘Like other Indigenous Peoples around the world, the reindeer herders fight for the lands from a spiritual perspective. It concerns their relationship with the land’ (our translation). The participant said that the mapping session allowed for addressing these types of experiences. Feedback from other participants supported this observation.
Topological maps and other forms of mental mapping do not present accurate longitudes and latitudes as Cartesian maps do. Still, they can visualise and communicate different types of spatial knowledge, including uncertain and ambiguous spaces (Robinson et al., 2016). The mapping sessions also triggered discussions about land use change’s cumulative impacts and domino effects. For example, the participants from Malå explained that they had adjusted their herding practices due to land fragmentation and more intensive land use by other interests. They reduce their reindeer numbers or increase supplementary feed during winter, impacting their income. The reindeer moves onto agricultural lands and gardens in search of good grazing. This causes disputes with landowners and requires labour-intensive herding. Participants from Vittangi talked about the increased use of snowmobiles by tourists and residents, which stresses the reindeer. There were examples of people driving in circles around herds to hinder their movement – additionally, snowmobiling compacts winter pastures and makes it difficult for the reindeer to dig through the snow. There is also a tendency for reindeer to follow snowmobile tracks, making herding challenging.
Towards the end of the case study period, one of the researchers (Persson) and the two community representatives presented the project and conducted a live session using participatory topological mapping at the SSR annual conference (as already mentioned). This allowed an evaluation of the approach as a communication tool between representatives from Vittangi and Malå and those attending the conference session. The audience included representatives from reindeer herding communities, Sámi organisations and other interested parties. After the session, they were invited to provide feedback, and many did. A reindeer herder said he found the mapping and storytelling approach similar to how elders in his community taught him reindeer husbandry. Another conference participant said he felt connected to the herding communities. He said the storytelling made it possible to understand and feel the emotions of the presenters. A lawyer was among the people who gave feedback. She appreciated the pedagogic approach and said she would use it in court cases where reindeer husbandry needed to be explained to the judges (Figure 3).
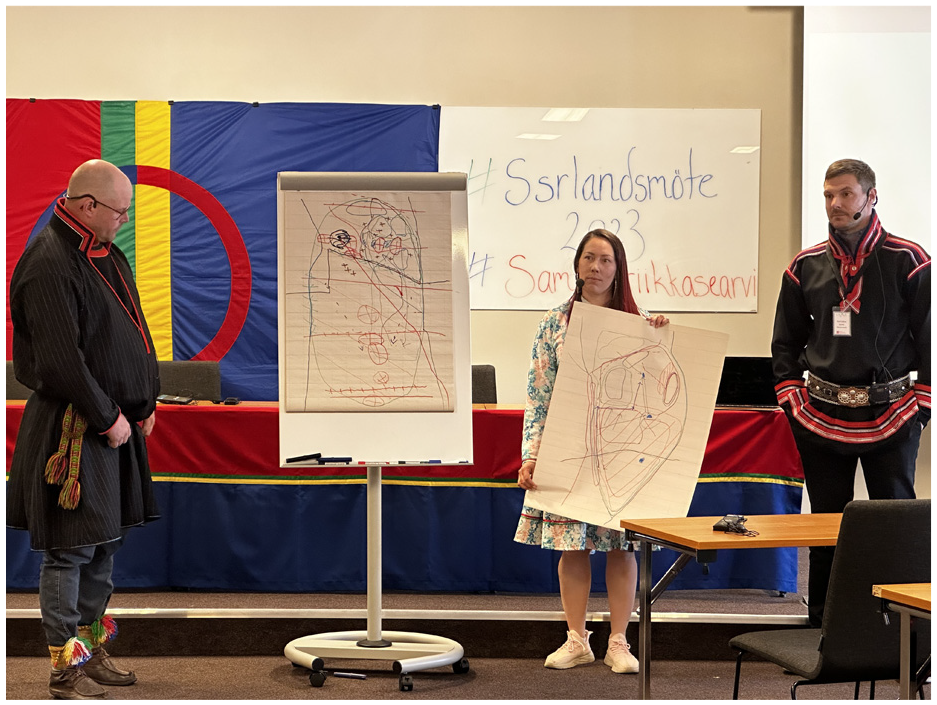
Stenberg, Persson and Juntti explain forest reindeer husbandry with topological mapping at the SSR Conference in June 2023.
Participatory topological mapping provides a tool that supports the situated, embodied and contingent qualities of mapmaking and storytelling (Sletto et al., 2021). Like other participatory mapping tools, it is not suited to address ontological questions of the truth; instead, it addresses epistemological questions: ‘Is the “truth” (whatever it is) being communicated effectively?’ (McCall, 2021: 111). The interactive mode of participatory topological mapping provides a platform for posing follow-up questions, discussing nuances, identifying misunderstandings and emphasising awareness-raising.
A tool with emancipatory potential
The participatory topological mapping approach empowers individuals and communities to contribute insights about environmental and social dynamics. Two of the researchers (Johnsen and Persson) acted as facilitators in this case study, but the tool is designed for independent use. It enables counter-mapping and reveals new perspectives on human-nature interactions.
The authors also found that the participatory topological mapping facilitated reflective discussion. During the case study evaluation, one of the participants from Malå said, referring to the previous mapping sessions: It can be liberating to explain our situation and everything we carry inside, issues which people usually do not want to understand. Now, we have faced two people interested in understanding our perspectives and concerns. It is liberating to express oneself. That is just the thing: When you explain it to someone else, you also explain it to yourself. It is a process of formulating one’s thoughts. You carry these thoughts with you, but they are unformulated. (Our translation)
Another participant compared the mapping sessions to ‘going to the psychologist’. The two community representatives who participated in the live mapping sessions at the SSR conference found the experience positive. Forest reindeer husbandry is less known than mountain reindeer husbandry, and they felt that the participatory topological mapping helped them communicate and give the audience a better understanding of their concerns. They also said that topological mapping gave them confidence and allowed creative expression. At the same time, one of the representatives worried that land use planners might dismiss their drawings as childish. The other representative, however, shared his recent experience using the approach to explain herd migration and seasonal grazing patterns to land use planners. He said the planners knew little about his community’s herding practices and that the approach helped them address misunderstandings and misconceptions.
The authors acknowledge that it is challenging to measure the transfer of power due to participatory mapping (Cochrane and Corbett, 2018). Nonetheless, the study presented in this paper built the participants’ capacity to communicate spatial information and concerns. Through practice, they can further refine their voice and mode of telling land use stories and, as such, enhance their agency (McCall, 2021).
Limitations and concerns related to the participatory topological mapping
While there are many upsides to participatory topological mapping, the authors also find limitations and concerns that users of this approach should be aware of and address appropriately – especially when being used in knowledge co-production and research.
First, the exercise of participatory topological mapping carries its own particular biases. The participants are asked to start by drawing a polygon to depict their community’s area. While territories and boundaries are often contested and ambiguous (Movik et al., 2021), the polygon becomes a definite border and inflexible range of possibilities. Competing land uses outside the polygon may impact reindeer husbandry (e.g. towns, industrial areas and wind turbines) but become out of sight and can be forgotten in the storytelling. Therefore, the interview guide should include questions about activities outside the border. Another limitation of topological mapping relates to the performative potential (Crampton, 2009) of the drawings. For example, visualising geospatial elements occurring everywhere inside the polygon, such as climate change, is challenging and is better portrayed vocally. Yet another concern was balancing the amount of information added to the map with readability. Anyone who wants to use topological mapping to communicate one’s concerns should consider practising drawing and developing their stories before presenting them to others.
Second, there is the challenge of portraying land use dynamics (Sletto et al., 2021). The reindeer’s movements shift between seasonal pastures and grazing patterns and are influenced by temperature, precipitation and stressors, such as predators, insects and human disturbances. Flexibility makes reindeer husbandry resilient to changes in nature and across the landscape. This flexibility, however, becomes invisible when drawing migration routes and land use with markers on a sheet of paper. As the drawings become fixed, it could give the impression that the herders’ land uses are the same every year and for every migration (Johnsen et al., 2023). This challenge was dealt with by asking the participants to draw a time series presenting the past, the present and the planned land use on separate sheets of paper. Laying the three sheets side-by-side made seeing temporal and spatial changes possible.
The drawings represent snapshots of how the situation is regarded at a given time. The maps are limited by the participants’ insights and framed by the conversation and questions asked by the interviewer/listener. These limitations are especially apparent when depicting planned land use and future threats. For example, new prospects for wind power development were announced between the mapping sessions with Vittangi in May 2022 and the reviewing workshop less than a year later. This shows how quickly the drawings may become outdated and the advantage of understanding them as fresh produce. As Laituri et al. (2023) advise, the participatory topological mapping approach emphasises the conversations occurring during the mapmaking process more than the end product itself.
In this study, an objective was to chronicle the reindeer herders’ perspectives on land use change. Alongside synthesising results and preparing a project report, one of the researchers (Westerveld) digitalised the drawings. This was done in Illustrator for legibility purposes but stayed true to the original drawings’ shape and information. The authors acknowledge that the digitalisation of Indigenous Knowledge can be problematic (Laituri et al., 2023; Sletto et al., 2021). They also found that the process of digitalising – and verifying that the interpretations of the drawings and narratives were correct – generated meaningful, in-depth discussions about land use issues. Additionally, participants asked the researchers to produce digitised versions of their maps as they argued that these would be more consequential to planners and decision-makers.
A third concern is anticipating how the external world will interpret the maps and stories shared (Gadamus and Raymond-Yakoubian, 2015). Both communities discussed how others could understand and use the drawings and narratives. Terminology and wordings that could be misinterpreted were identified and changed. For example, whether to include some place names in the maps developed for the report was discussed. The conclusion was to remove all names to avoid potential critique about the maps’ inadequate geographical representations of the landscape. Removing names made the locations more anonymous, enabling the maps and narratives to emphasise the relational aspects of the landscape, land uses and reindeer husbandry more strongly.
Fourth, while focussing on the herders’ perspectives on land use changes, the case study was structured by an interview guide initially developed by the researchers based on their insights, assumptions and knowledge (gaps). The purpose of the interview guide was to prompt thinking and provide a framework for the conversations. Though the conversations were only semi-structured and were steered to fit the participants’ concerns, the authors realise that the discussions and stories might have emphasised other aspects of reindeer husbandry and land use without someone posing questions. Developing the interview guide more collaboratively should be considered.
As Robinson et al. (2016)and Laituri et al. (2023), the authors acknowledge it is difficult to estimate the extent to which the researchers affected the mapping sessions. Moreover, these types of sessions are always affected by the perceptions of the participants and the dynamics between them (Mere-Roncal et al., 2021). Nevertheless, when using participatory topological mapping for knowledge co-production and research, one should be careful how strongly one steers the process – as this method aims to tease out the participants’ perspectives and concerns. At the same time, for effective communication and knowledge exchange, questions provide a useful prompt and can help the listener better understand the story told.
A fifth concern is the emotions triggered by storytelling about land use change. While the participants appreciated the opportunity to share their experiences and concerns, they also said it was emotional to discuss threats to their way of living. Several participants expressed pessimism concerning future outlooks and possibilities for reindeer husbandry to adapt to the cumulative effects of land use changes. Like reindeer husbandry in many places, the Vittangi and Malå communities face economic, physical and psychological stress from encroachment and land fragmentation. The researchers could have facilitated more optimistic conversations focussing on the participants’ positive experiences related to land use. However, the reality is that the herding communities’ experiences of land use change are dramatic. As such, the study addressed their need to increase public awareness about the threats to forest reindeer husbandry. Advocating their needs and rights to land use is an everyday reality for many of them. For this reason, one of the participating reindeer herding communities has established an internal working group that deals with its members’ mental health issues.
Conclusion
This paper introduces participatory topological mapping as an innovative method for knowledge co-production. Without advanced software, the approach combines hand-drawn maps with a standardised topological structure to visualise geographical relationships. Participatory topological mapping, like other participatory mapping methods, addresses concerns of asymmetrical power relations in mapping (Anthias, 2019; Brown and Kyttä, 2018; Chambers, 2006; Cochrane and Corbett, 2018; Laituri et al., 2023; Mere-Roncal et al., 2021). It allows the knowledge-holder to control the map and its narrative, allowing decisions on what is included or excluded and what types of representations count as a map (Bryan, 2015). The method supplements other participatory mapping approaches that focus on Indigenous/local insights related to specific geographical locations. Participatory topological mapping emphasises geographical relations, recognising that relations can tell different stories than locations of land use and land use change.
By adding participation to topological mapping, emphasis is put on dialogue and knowledge exchange between knowledge-holders and stakeholders, reducing barriers to knowledge exchange. Given its alignment with how people naturally recount experiences and memories (Westerveld and Knowles, 2021), participatory topological mapping effectively conveys participant perspectives and experiences related to landscapes, nature values and land use. The method treats mapping as a social process with the potential to ‘alter understandings of the world and our ways of being in it’ (Bryan, 2015: 257). In doing so, the method offers a valuable avenue for knowledge co-production, fostering deeper engagement and mutual understanding among participants.
Recommendations and future directions
While participatory topological mapping is valuable, the authors recommend considering the risks of mapping Indigenous Knowledge. Participants and researchers should be cautious about potential misinterpretation if maps are printed or published. The authors suggest always accompanying maps with knowledge-holders’ stories to guide readers. The participants’ right to decide what information to share and what to silence should be respected (Pearce and J. Hornsby, 2020).
The method can be adapted beyond reindeer husbandry to communicate spatial and temporal concerns with land use planners and decision-makers. However, it’s essential to recognise that these maps represent abstractions based on the knowledge-holder’s understanding of space and relations, and they should be interpreted within their specific context. Moreover, the maps should be considered as fresh produce as land use changes continue to alter the conditions on the ground. Human-to-nature relations are complex and dynamic, and the authors recommend that the maps are drawn live when using topological mapping as a communication tool. This will allow the audience to follow the story from beginning to end, and the storyteller can clarify, explain and add details when needed. This way, the map and story shared are both fresh and contextualised.
Footnotes
Acknowledgements
The authors would like to express their sincere gratitude to the Vittangi and Malå reindeer herding communities for their invaluable contributions to this study. Special thanks are also extended to the National Association of the Sámi People in Sweden (SSR) for their support during the initial stages of this research. Additionally, the authors deeply appreciate the constructive feedback provided by Anne Kelly Knowles, Marcus Carson and two anonymous reviewers, which significantly enhanced the quality of the manuscript. Any remaining errors are the sole responsibility of the authors.
Declaration of conflicting interests
The authors declared no potential conflicts of interest with respect to the research, authorship, and/or publication of this article.
Funding
The authors disclosed receipt of the following financial support for the research, authorship, and/or publication of this article: This work is supported by funding from the Swedish Research Council for Environment, Agricultural Sciences and Spatial Planning – Formas [2019-02324], the Research Council of Norway [312014] and the Pawanka Fund. The study was part of the project ‘Arctic Wetlands Ecosystems’ (2020–2023), a Belmont Forum Collaborative Research Action on Resilience in Rapidly Changing Arctic Systems (CRA Arctic II).