
Abstract
The Delphi technique is a unique survey method that involves an iterative process to gain consensus when consensus is challenging to establish. Survey participants typically rate a variety of statements using a specified rating scale. The survey is repeated for several rounds, and at each round statements that do not reach a predefined level of consensus are advanced to the next round while giving the participants information about the responses of other participants for their comparison. The final statements are then ranked in order of the average rating. The statistical methods to analyze Delphi studies are not well described. This study investigates the use of a 1–7 linear rating scale along with parametric summary statistics for assessment of consensus and ranking of statements. A study set of 9297 individual ratings on the 1–7 scale were obtained from previously performed Delphi studies and used to create 490,000 simulated Delphi ratings with various numbers of participants. While the overall distribution of ratings was strongly left skewed the sampling distribution was near normally distributed for studies with five or more participants. The average difference between the standard deviation and interquartile range was −0.26/7. The overall risk of falsely concluding consensus using the standard deviation as a summary statistic was 7.3% when compared to using the interquartile range. The average difference between mean and median was −0.20/7. The risk of falsely ranking the statements by a value of 0.5 or more was near zero for all sample sizes when the mean was compared to the median. This study suggests that the use of the 1–7 linear rating scale in combination with the parametric summary statistics of standard deviation and mean is a valid method to analyze ratings from Delphi studies.
Introduction
Delphi studies are a unique survey method. Among its many uses, this study format is often used by researchers who are aiming to establish consensus among a group of experts when consensus is challenging to establish. It is an alternative to focus groups or expert panels and can be implemented without travel.
The Delphi methodology has been in use since the 1950s and has been well described elsewhere (Keeney et al., 2011). Briefly, the Delphi is an iterative survey process that is targeted specifically with developing consensus. Delphi method participants are called experts and are chosen by the study project team based on their content expertise. The survey team develops a list of initial statements for the first survey round. These statements may be created by a focus group, literature review, or by an open-ended survey of the experts themselves. These statements are then assembled into a first survey where a group of these experts, typically 8–20, are asked anonymously to rate the statements. Various rating scales have been used, including yes-no, Likert scales, or linear numeric scales. In a recent review of 30 Delphi studies, Junger et al. (2017) noted that there was no consistency in the rating scales which included 5, 6, 7, 9, and 11-point scales.
The first step in analyzing a Delphi study is assessment of consensus. When the first survey round is complete, the research team evaluates each statement to assess if consensus is obtained. Unfortunately, there is no universal standard for consensus. Von der Gracht (2012) states that “consensus is one of the most contentious components of the Delphi method.” In a review of 30 Delphi studies in palliative care, Junger et al. (2017) found that five studies did not even give a definition of consensus; of those that did, consensus was based variably on percentage agreement, median, or a measure of stability between rounds. Spranger et al. (2022) in a methodological review of the Delphi technique were unable to recommend a single method for measuring consensus. In most cases, consensus is obtained by a test-statistic of spread such as percentage of participants choosing one response, interquartile range (IQR), or standard deviation (SD). Ideally, the consensus threshold of the chosen test-statistic is set at the study design phase before the survey administration, although in a recent systematic review of 100 Delphi studies, Diamond et al. (2014) found that only 64% had done so. Those studies that have not reached consensus are returned to the experts for re-appraisal in a new survey. This time, each survey question is accompanied by the results of the first survey round: both the previous response of this expert, and a summary statistic of the group's result. Experts are requested to re-submit their answer, considering the group response. The second survey is again analyzed for consensus, and those statements still not reaching consensus are again returned to the experts. This iterative process repeats until the endpoint: usually when all statements have reached consensus, or a certain number of rounds is performed. In this section of the analysis, the most critical error would be to conclude a statement has reached consensus when in fact it did not (false consensus).
The second part of the analysis involves ranking the statements where consensus has been obtained. This often involves a test-statistic of center such as mean, median, or mode. Statements are ranked in a useful order, and the result is a list of statements that have reached consensus in their order of importance or agreement. In this section of the analysis, the most critical error would be to falsely rank a statement (false ordering).
While the workflow of the Delphi study is well described, the statistical analysis is not, making design of the Delphi study difficult for researchers and interpretation of studies difficult for readers. Notably, many researchers use Likert-type scales, which are notoriously controversial to analyze. Furthermore, many researchers tend to develop their own self-designed rating scales, and the lack of consistency between studies makes comparing Delphi studies impractical. Researchers often use non-parametric methods to analyze survey ratings in Delphi studies. This involves description of the data by median and IQR. In addition, the unique characteristics of Delphi data make generalization from other survey formats questionable. For instance, in Delphi studies, rating values are often highly skewed, as experts are far more likely to agree with one another than to disagree. Also, only statements reaching consensus—which are tightly distributed by definition—have their measure of center calculated.
Linear rating scales are an alternative to Likert scales. These scales have participants provide a numeric response to a question, like the familiar 1–10 pain scale. For Delphi studies these are often anchored on the extreme, such as “Strongly Disagree” to “Strongly Agree.” These scales offer several improvements over Likert scales, as they are easy to write and intuitive for most respondents. The concept of the center is more natural. It is easy for the investigators to set a level of consensus a-priori. Furthermore, writing the final manuscript tends to be far easier as the results are more easily summarized in a single statistic. Finally, linear scales may be more suitable for analysis by parametric methods.
There are many advantages to using parametric methods and describing the data by mean and standard deviation (SD). Parametric methods allow estimates of effect size, creation of confidence intervals, and increased precision. Advanced techniques such as modeling and evaluation of distribution shape are also possible with parametric methods. Parametric statistics such as mean and SD are also intuitively easier to understand for many practitioners.
This study addresses the research question: can linear rating scales combined with parametric statistical methods by used for a simplified analysis for Delphi studies? This study explored the statistical characteristics of the 1–7 linear rating scale as applied to Delphi statements. Using a large-data set and bootstrap simulation techniques, the study objectives were to:
Assess the use of SD as the measure of consensus for 1–7 rating scales in Delphi studies and calculate the risk of false consensus.
Validate the use of the mean as a measure of priority for 1–7 rating scales in Delphi studies and calculate the risk of false ordering.
Methods
The study was approved by the University of Alberta Research Ethics Office (Study ID: Pro00117714).
This study was an analysis of pre-existing data. The study target was 11 Delphi studies that had previously been performed. In all cases, studies were performed electronically using the STAT59 Delphi online software (STAT59 Services Ltd., Edmonton, Canada). Only ratings on the 1–7 linear scale were collected. Ratings used one of two different scales: a linear scale of “not at all important” to “very important” or a linear scale of “Strongly Disagree” to “Strongly Agree.” All ratings were taken with a similar user interface (Figure 1).
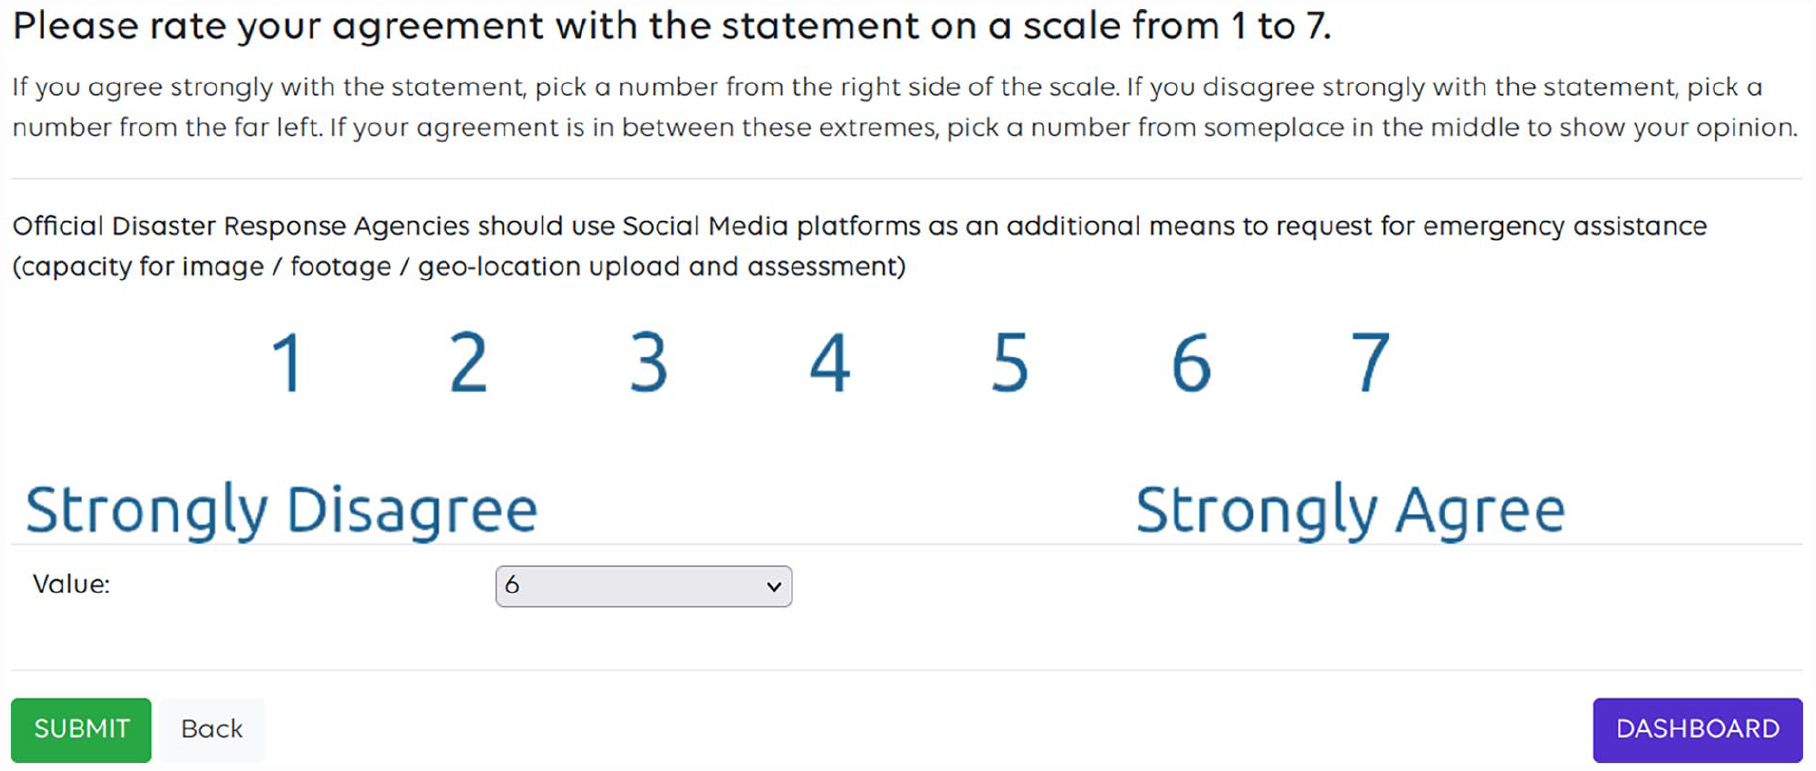
Example 1–7 numeric scale.
In the data collection phase, the author of the original Delphi study contacted potential study candidates by email inviting them to participate in the project. Candidates were given a copy of the study protocol and asked to consent by email to having the data that they had previously submitted analyzed for this study. Participants were not required to provide any new data for this study. The value of all ratings given by the participants on the 1–7 linear scale were obtained from STAT59. The final study dataset is anonymized and contains no identifying information or personal information about the experts.
Sampling distributions were created from the original set of ratings and plotted to see if the sampling distribution approached a normal distribution. Sampling distributions were created for sample sizes of 1, 2, 3, 5, 10, 20, and 40. Sampling distributions were created for each of these sample sizes by drawing 1000 random samples of that size and calculating the mean. These means were then plotted to form the sampling distribution histogram for each size.
In the simulation phase, the study data was used to simulate Delphi ratings of increasing sizes (number of experts from 2 to 50) by bootstrap sampling of the original dataset. Details of the Python code used to perform the bootstrap simulations is available in the Supplemental Appendix. In brief, the code simulates a Delphi rating for a group of experts, where the number of experts increases from 2 to 50. Starting with number of experts (n = 2) the simulation chooses one of the statements at random from the dataset and draws a bootstrap sample of size n from the responses to this statement using sampling with replacement. Ten thousand samples are drawn in this way for each value of n. In total, 490,000 Delphi statements were simulated.
The simulation was written in Python version 3.6.9 (Van Rossum and Drake, 2009). Simulations were performed on a Dell Precision 5510 (Dell Inc, RoundRock Texas) with a four core Xeon E3-1505M processor (Intel Inc, Santa Clara, California). The simulation used the Ubuntu 18.04 operating system (Canonical, Austin, Texas) and Linux kernel version 5.4.0.
To assess the use of SD for the measure of consensus, both SD and IQR were calculated for each simulated Delphi statement. SD and IQR were compared. The difference between the SD and IQR was calculated for each simulated statement. For this study, a false consensus was defined as a situation when a statement would be classified as having reached consensus if the SD was used as the test-statistic, but not having reached consensus if the IQR was used as the test statistic. This depends heavily on the value of the test-statistic that the researchers set as the threshold for consensus in their study. In this study, threshold values of consensus were set at the common values of 0.5, 1.0, 1.5, or 2.0. This set of values places the most reported value of consensus (IQR or SD ⩽1.0) in the center, while also assessing more lenient (1.5 or 2.0) and more stringent (0.50) thresholds. A false consensus was considered to have occurred in any simulated Delphi statement where the SD was less than the threshold, but the IQR was not.
To assess the use of the mean for statement ranking, the mean and median were calculated for each simulated Delphi statement. The difference between the mean and median was calculated for each statement. For this study, false ordering was considered to have occurred if the use of the mean as the final ordering variable for the statements would give a significantly different order compared to the use of the median. This is highly dependent on what the practitioner would consider significant. For instance, many researchers would classify a difference of 0.1 (e.g. a mean of 5.1 and a median of 5.0) to be insignificant. Conversely, most would consider a difference of 1.0 (e.g. a mean of 5.5 and a median of 4.5) to be significant. To be useful in a broad range of situations, levels of significant ranking errors were calculated for a difference of 0.1, 0.25, 0.5, or 1.0 out of 7 in this study. A false ordering was considered to occur when the difference between mean and median was greater than this ranking error value.
Results
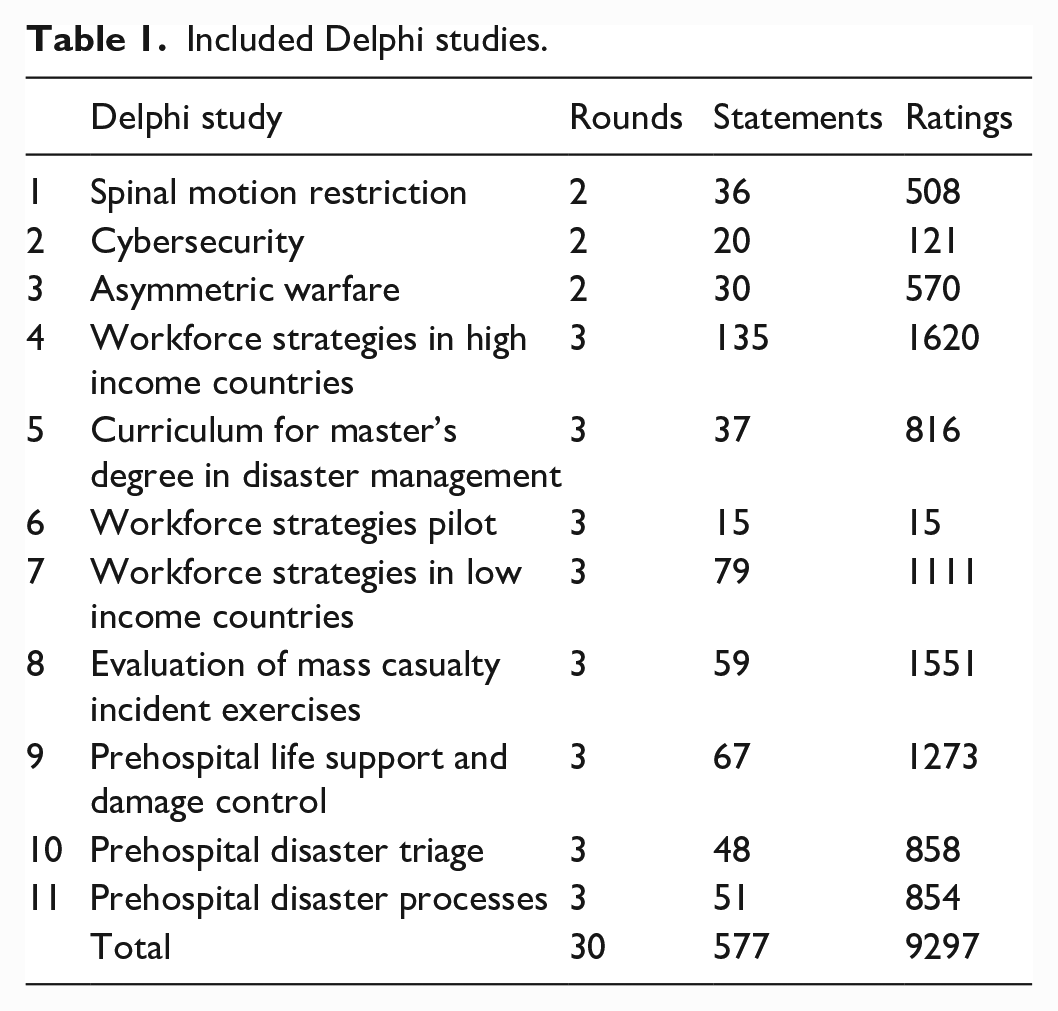
The final study data set included 9297 ratings on the 1–7 scale by 166 Delphi Experts. The ratings were from 577 statements in 30 Delphi rounds of 11 projects (Table 1). Topics included cybersecurity, disaster medicine, healthcare workforce strategies, and curriculum development. Most studies (8/11) had three rounds, while the remainder had two rounds. The largest study included 135 statements and the smallest had 15 statements. The smallest study had 15 total ratings, while the largest had 1620. Two of these Delphi studies have been previously published, and several are currently being analyzed for publication (Hung et al., 2022: Weinstein et al., 2020).
Included Delphi studies.
As expected, the distribution of all 9297 ratings were strongly left skewed, with most ratings of 6 or 7 (Figure 2) on the 1–7 scale. The mean rating was 5.7 with a median of 6. The SD of the ratings was 1.4 with an IQR of 2. Over 3000 ratings were 7/7 on the linear scale, while less than 200 were 1/7.
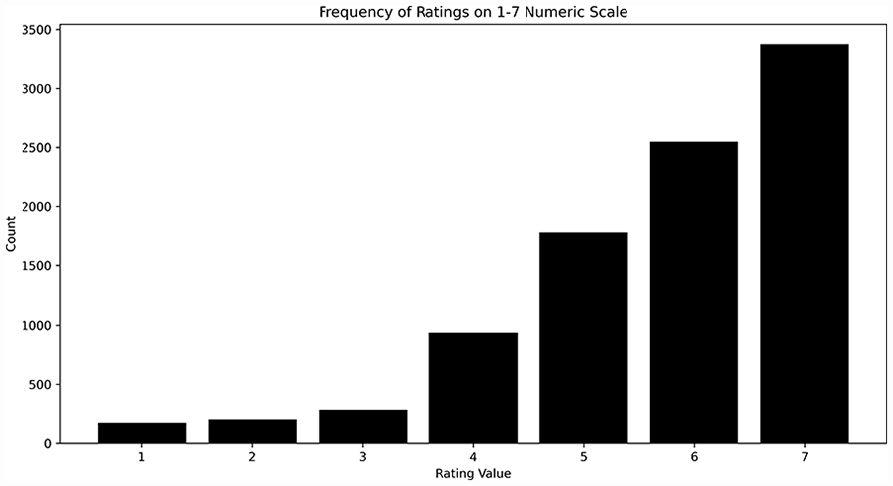
Frequency of ratings on 1–7 numeric scale.
Sampling distributions of various sizes taken from the 9297 ratings are presented in Figure 3. When the sample size was less than five, the sampling distributions show a strong left skew. However, the sampling distributions appear to take on a distinctly normal appearance for sample sizes of five or greater.
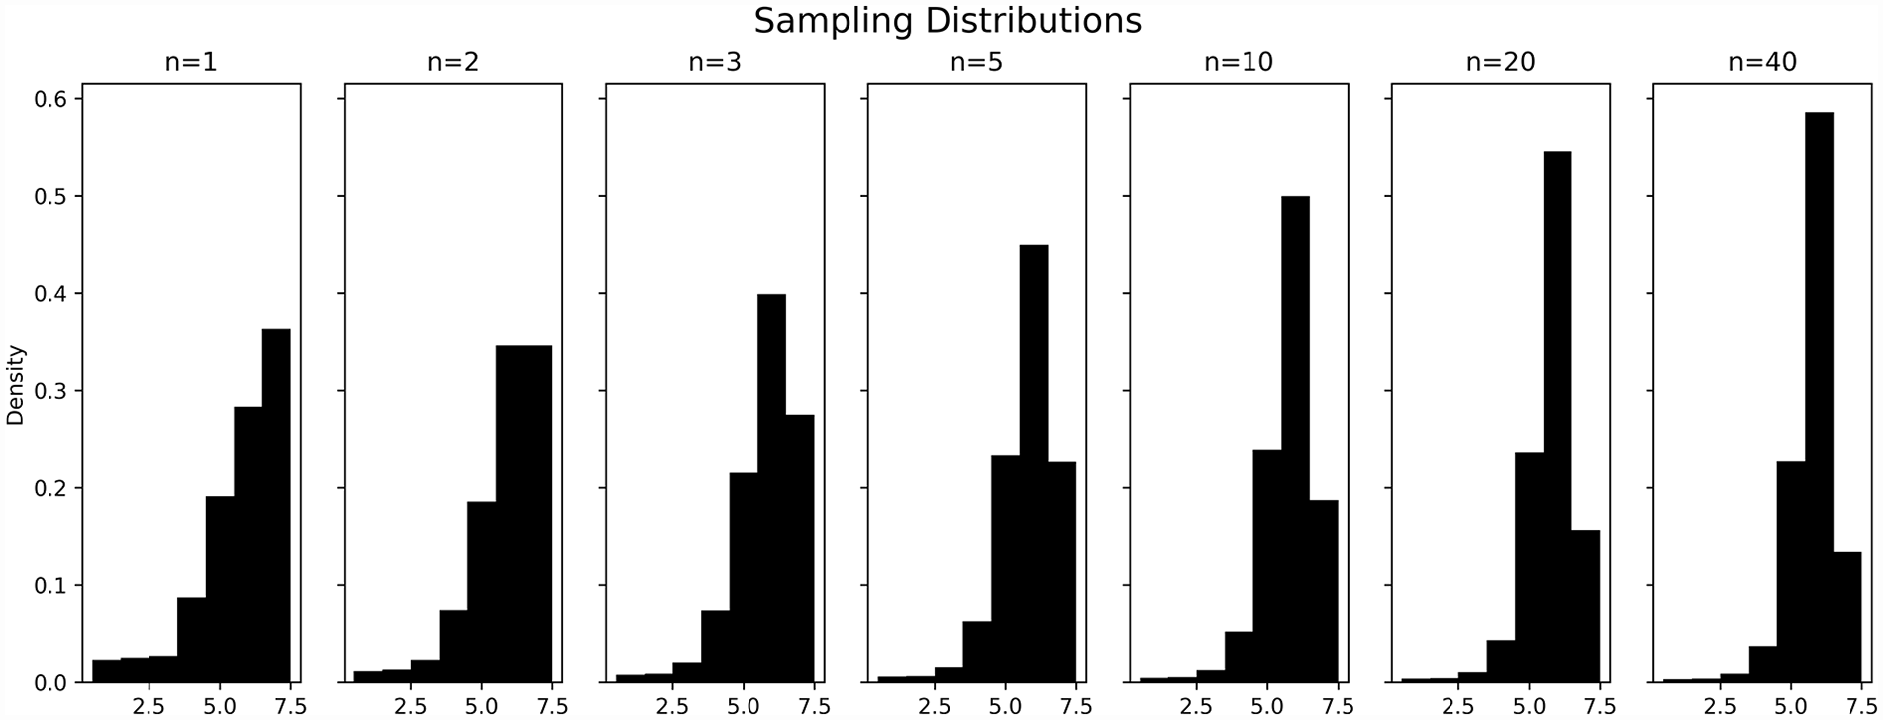
Sampling distributions.
The bootstrap simulation suggests that there is little difference between the mean and IQR. The difference between the calculated IQR and SD (SD–IQR) for the 490,000 simulated Delphi studies is presented in Figure 4. Overall, the mean difference between SD and IQR is small (−0.26), although the 95% confidence interval is wide (approximately 1 to −2). The number of experts appears to have minimal influence on this difference for studies with five or more experts.
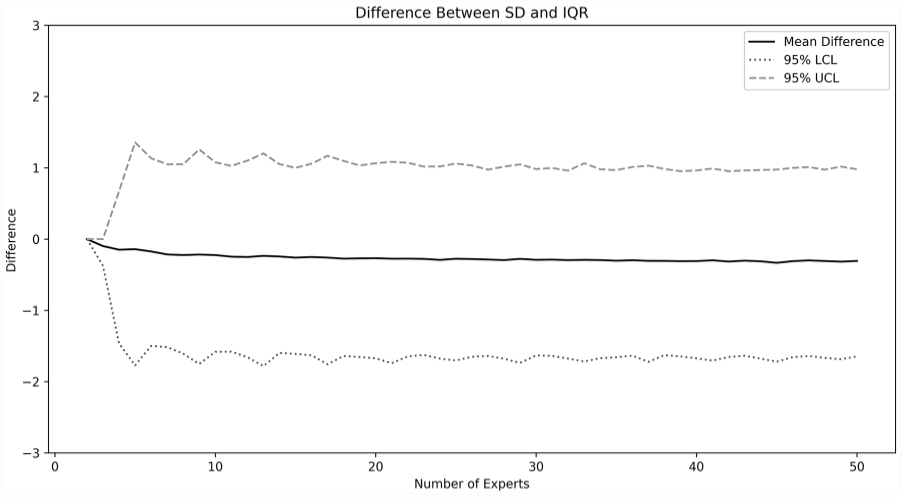
Difference between SD and IQR.
The probability of false consensus is shown in Figure 5 and is highly dependent on the definition of consensus. For example, when consensus is defined—as is commonly done—as an SD of 1.0 or less, the overall probability of falsely concluding consensus across study sizes was 7.4%. However, if a stricter definition of consensus is used, such as an SD of less than 0.5, the risk of falsely concluding consensus is much lower, approaching zero for larger sample sizes. Conversely, if a more lenient definition of consensus is used, such as a SD of less than or equal to 2.0, there may be up to a 20%–30% chance of falsely reaching consensus. For the simulated statements that reached a consensus (SD or IQR ⩽1.0) the mean and median were calculated. The difference (mean–median) is shown in Figure 6. On average, the difference between the mean and median was −0.20. However, the 95% confidence interval was from approximately 0.5 to −1 for most sizes of Delphi study. Again, for study sizes larger than five experts, there appeared to be minimal difference as study size was increased.
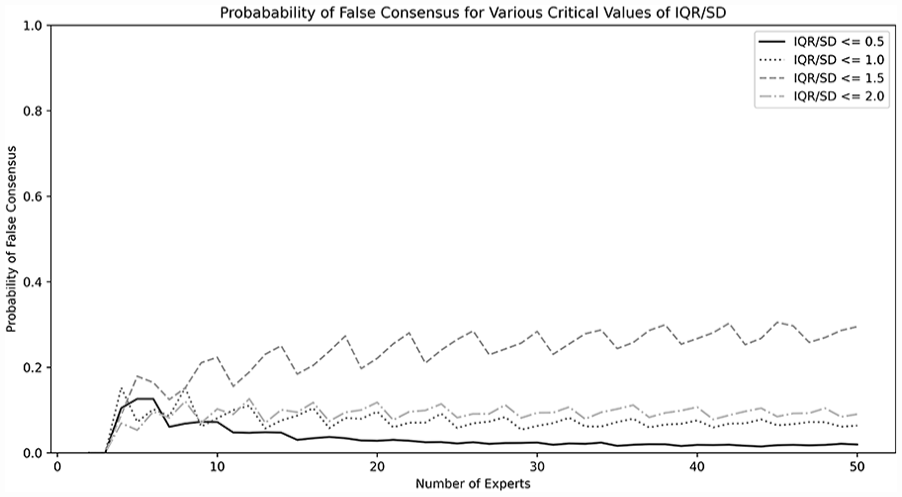
Probability of false consensus for various critical values of IQR/SD.
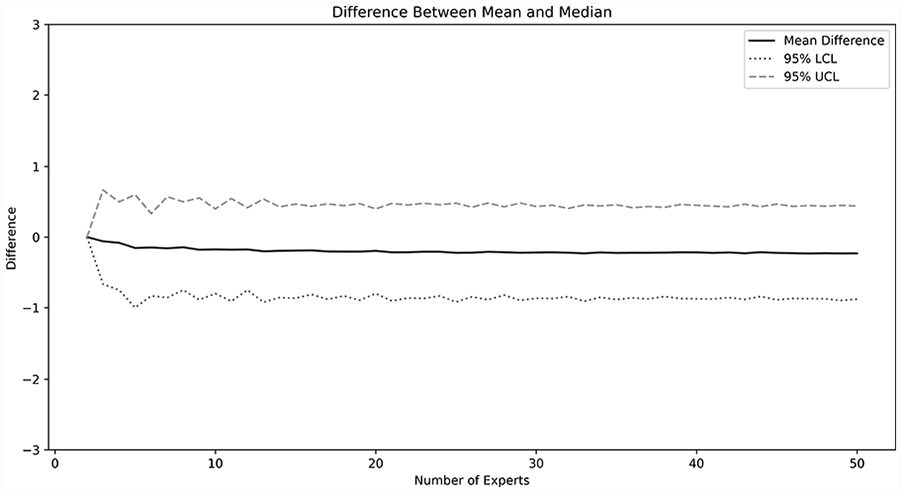
Difference between mean and median.
The probability of making an error in ordering the final statements is shown in Figure 7 and is highly dependent on the definition of significant errors. If one considers only differences of 0.5 or more on the 7-point scale to be a critical error, the likelihood of falsely ranking the studies approaches zero. When any difference of 0.25 or more is considered significant, the average risk of false ordering across all study sizes is 7.3%. Increasing the number of experts beyond 10, appears to have no significant change on the risk of false ordering.
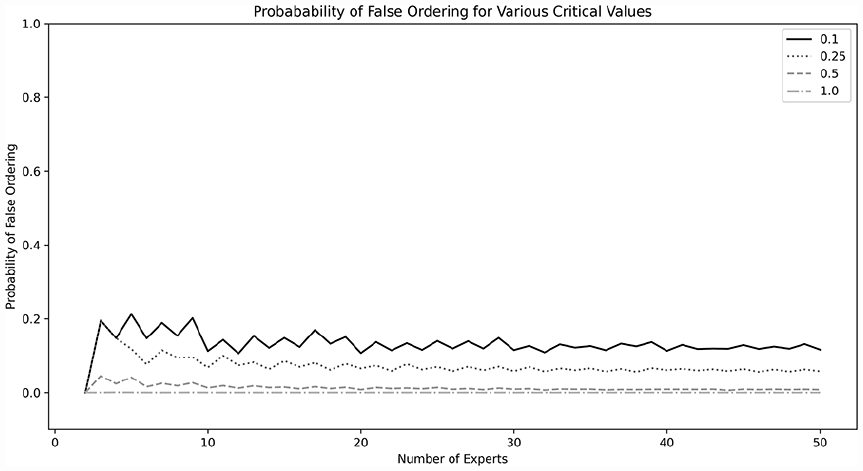
Probability of false ordering for various critical values.
Discussion
This study suggests that the use of the 1–7 linear scale, and analysis by mean and SD should be considered the standard in Delphi studies. The scale has excellent test characteristics. As existing Delphi studies have heterogeneous statistical methods and minimal guidelines exist for researchers, standardization to this scale could lead to far more clarity to the Delphi method.
In this study, it was found that the use of SD to assess consensus in Delphi studies using the 1–7 rating scale gives minimal risk of falsely concluding a statement has reached consensus. The mean difference between SD and IQR was near 0 for all study sizes. The 95% confidence interval for the difference between SD and IQR is wide (from 1 to −2), however the risk of falsely concluding consensus when in fact none exists is low. In our Delphi studies, all research groups set their definition of consensus as SD less than or equal to 1.0. In this case, the risk of false consensus is less than 10% for sample sizes above 10. Interestingly, the rate of false consensus does not appear to change as the sample size increases beyond 10. This suggests that although there may be logistic or practical reasons to increase the number of experts—such as incorporating many diverse opinions—this increase does not seem to yield better statistical performance in assessing consensus.
This study also suggests that using the mean to assess central tendency in Delphi studies using the 1–7 rating scale gives minimal risk of falsely ranking the final statements. When considering only those statements that have reached consensus, the difference between the mean and median was near zero for all sample sizes. Although the confidence interval was wide (0.5 to −1), the practical risk of falsely ordering the final statements is low. Giving a numeric value to this risk is highly dependent upon what difference between mean and median would be considered important from a practical perspective. For instance, if the analysts consider that only a difference of 0.5 or more on the 1–7 scale would be considered important, then the risk of falsely ordering the statements is near zero for all sample sizes. Conversely, if analysts consider a difference of 0.1 on the 1–7 scale as being important, the risk of falsely ordering the statements is near 15%–20% depending on the sample size. To reduce the risk of false ranking, we recommend the include at least 10 experts in the Delphi study, so that the chances of significant error from occurring can be reduced, especially for studies where the definition of significant errors are small (as difference of 0.25 or less).
To our knowledge, no other studies have presented mathematical evidence of how to best measure consensus in Delphi studies. Hasson et al. (2000) cite in their review of the Delphi methodology that there is no universal guideline for consensus and note that the level of consensus often depends on the study aim, number of participants, and available resources. Junger et al. (2017) in their guidelines suggest that the measure of consensus should be defined a-priori, but do not give a recommendation on how it should be defined. Nonetheless, several other authors have published their recommendations. Hallowell and Gambatese (2008) suggest that an absolute deviation of less than 1/10 of the range of possible values should be considered as the standard for consensus. Gallego et al. (2008) suggest consensus can be defined as most responses being within the interquartile range. Gattrell et al. (2022), conversely, define consensus as 80% of panelists scoring “strongly agree” or “agree” on a Likert-type scale.
There are several reasons why 1–7 point scales should be suitable for analysis by the parametric parameters such as SD and mean.
Firstly, although there are obvious theoretical reasons to use non-parametric methods for survey rating scales, many studies have failed to find a true difference in practical use. For instance, de Winter and Dodou (2010) used 10,000 simulations of 98 different distributions to show that there was no compelling difference in Type 1 error when using the Mann-Whitney U test or t-test to analyze 5-point Likert-type scales. Studies dating back to the 1930s have consistently shown that although sample sizes may violate the assumption of normality, parametric statistics are robust to these violations and continue to provide valid results (Norman, 2010). For instance, Pearson (1931) showed that ANOVA was robust even to highly skewed and non-normal distributions even for sample sizes as small as four.
Secondly, this study investigates the performance of the 1–7 linear scale, which, unlike Likert-type scales, is anchored only on the extremes. Theoretically, this type of scale should encourage raters to use the scale’s full range from 1 to 7, and, intuitively, consider that the distance between each of the numbers as equal. This should allow use of common parametric statistical tests. This has been confirmed by other authors. For example, Harpe (2015) states that “Individual rating items with numerical response formats at least five categories in length may generally be treated as continuous data,” although he cautions that analysts should ensure that a range of at least 4 of the 7 values is used by the respondents. Hsu and Feldt (1969) showed excellent control of type-1 error when using the F-test for 1–5 scales, under all conditions, even with sample size as small as 11.
Thirdly, the central limit theorem suggests that for sample sizes of 30 or more, even non-normal populations are expected to have a normal sampling distribution (DeVore, 2008: 215–218). It is a common misconception among many practitioners that parametric statistical tests require the underlying population to be normally distributed. This is not correct: in fact, parametric tests require the sampling distribution—not the underlying population—to be normally distributed. The sampling distribution is highly dependent on sample size. As shown in Figure 3, for sample sizes greater than or equal to 5, the sampling distribution appears approximately normal in shape.
Finally, the two-step process inherent in the Delphi analysis where only statements reaching consensus are analyzed for their central tendency ensures that the parametric test-statistic mean is applied only to statements where the distribution is tight. For instance, highly bimodal distributions, such as a distribution with 50% of participants indicating 1 and 50% indicating 7 would not meet consensus by any reasonable value of SD chosen as the threshold for consensus. Thus, this statement would not have its mean analyzed.
Most importantly, it is prudent to remember that Delphi studies are exploratory studies that serve as a springboard for more rigorous methodologies. They do not usually require the same level of mathematical rigor necessary in clinical trials, for example. Rather than look at rigorous mathematical proofs, this study looks at the practical differences likely to be encountered between the various calculated measures of spread and center.
The authors strongly prefer the use of the 1–7 linear rating scale over other ratings scales for several reasons. Firstly, the scales are straightforward to write for the research team and very intuitive to read for the experts. Secondly, by using the SD as a summary statistic for consensus, it is straightforward to set a consensus level a-priori, and easy to assess consensus for each statement. The use of the mean as a summary statistic for ranking is also very natural. Finally, presentation and writing of results is simplified immensely using the summary statistics. In contrast, commonly used Likert-type scales are far more cumbersome when setting consensus, ranking the final statements, and presenting the results.
There are many potential advantages to the use of parametric scales. Parametric scales have a major advantage in being able to provide estimation of an effect size—the difference between two groups (Vickers, 2005). In contrast, non-parametric tests can detect the difference between two groups but cannot usually provide an estimate of the magnitude of this difference. Because parametric methods do not require conversion to rank order for analysis, they maintain more precision of measurement than corresponding non-parametric methods. Parametric methods also allow creation of confidence intervals. Advanced statistical techniques such as modeling, and comparison of distribution shapes are also facilitated by the use of parametric statistics.
The concept of mean and SD are intuitively easier to interpret for many practitioners. In a review of consensus measurements in Delphi studies, Von der Gracht (2012) noted that authors had used a variety of tests such as the Chi-square test, McNemar change test, Wilcoxen matched-pair test, Wilcoxon signed-rank test, infraclass correlation coefficient, kappa statistic, Spearman’s rank-order correlation coefficient, Kendall’s W coefficient, t-statistics, and F-tests. However, these tests are often far more difficult for non-statisticians to interpret.
In fact, use of non-parametric studies in cases where the sample size is large can even be harmful. Fagerland (2012) cautions that using non-parametric methods on larger sample sizes can lead to false conclusions, and he counsels that parametric methods should be used for larger sample sizes even when the population is heavily skewed.
There are several limitations to this study. Firstly, all the study topics were in a similar field - disaster medicine. Although this limits the scope of the study, there is little reason to believe that response distribution for disaster medicine Delphi studies would be biased when compared to other topics. Secondly, this study investigated the statistical characteristics of the 1–7 scale in Delphi studies only and should not be applied to use of the 1–7 scale in other settings without further study. Finally, although the present study shows sampling distributions for Delphi survey questions tend to approach normality for sample sizes greater than five—suggesting that parametric methods such as t-tests, analysis of variance (ANOVA), and linear regression should be appropriate—the study did not specifically address the potential errors of these statistical methods.
Conclusions
This study involved analysis of 490,000 simulated Delphi questions rated on the 1–7 scale drawn from bootstrap sampling of 9297 actual survey responses. Although the responses are heavily skewed to the left, the sampling distribution tends to normality for samples sizes greater than or equal to five. For Delphi studies using a 1–7 linear scale, the use of the standard deviation for assessment of consensus and the mean for ranking is acceptable. Use of these parametric tests presents minimal risk of false consensus or of false ranking when compared to the non-parametric statistics of interquartile range and mean. This suggests that the linear 1–7 scale analyzed using the mean and standard deviation should become the preferred statistical method for Delphi studies.
Supplemental Material
sj-docx-1-mio-10.1177_20597991231179393 – Supplemental material for Analysis of Delphi study 7-point linear scale data by parametric methods: Use of the mean and standard deviation
Supplemental material, sj-docx-1-mio-10.1177_20597991231179393 for Analysis of Delphi study 7-point linear scale data by parametric methods: Use of the mean and standard deviation by Jeffrey Michael Franc, Kevin Kei Ching Hung, Alessandro Pirisi and Eric S Weinstein in Methodological Innovations
Footnotes
Declaration of conflicting interests
The author(s) declared the following potential conflicts of interest with respect to the research, authorship, and/or publication of this article: JMF is the CEO and Founder of STAT59. All other authors declare that they have no conflicts of interest.
Funding
The author(s) received no financial support for the research, authorship, and/or publication of this article.
Supplemental material
Supplemental material for this article is available online.
Author biographies
References
Supplementary Material
Please find the following supplemental material available below.
For Open Access articles published under a Creative Commons License, all supplemental material carries the same license as the article it is associated with.
For non-Open Access articles published, all supplemental material carries a non-exclusive license, and permission requests for re-use of supplemental material or any part of supplemental material shall be sent directly to the copyright owner as specified in the copyright notice associated with the article.