
Abstract
The study of the social world involves multiple, multidimensional, and endlessly dynamic competing systems evolving over time. This inherent complexity, however, does not mean that the social world is chaotic, random, or unstructured. Rather, structural forms do emerge and co-exist in social settings. It is the emergence, maintenance, and decay of these structures that allows researchers to detect temporary stability and provides them with the means to make predictions about continuity and change in social dynamics. Arguably then, the main challenge in the study of the social world consist of developing robust and consistent strategies or tools capable of tracing, mapping, or retrieving these structural forms in order to ultimately model this social complexity. Accordingly, the overarching purpose of this study consists of addressing this analytic and methodological challenge by proposing a groundbreaking analytic framework, and its corresponding software application, designed to extract temporal and dynamic structures in the social world relying on complex realism, complex systems, dynamic temporal network analyses, and data science and visualization techniques. Together, these frameworks constitute the foundations of Mapping, Organizing, and Visualizing Interdependent Events (MOVIE), an analytic framework [and software application] designed to ease the understanding of, individually-produced or interactively-generated, events and knowledge evolution, by tracing and recreating the processes that may have affected participants’ experiences, outcomes, and standpoints. To demonstrate MOVIE’s performance and rigor in capturing and recreating the dynamic complexity of micro-level interactions, the analyses relied on publicly available data sources on foreign policy and conflict resolution. All data elements and tools are provided with this study to make these analyses fully transparent and reproducible. MOVIE can trace/recreate the temporal elements embedded in existing qualitative databases (e.g. those generated with NVivo/MAXQDA/Atlas.ti), even if they were created without considering their dynamic time-evolving features, whose meaning-building relevance may help inform policy planning and action.
Keywords
Introduction
Scientific research involves the methodic identification and development of questions that require the systematic collection, analysis, and assessment of (primary or secondary) data to fully, or at least partially, address the questions posed and/or to develop new ones based on the understandings and insights resulting from this scientific endeavor (Çaparlar and Dönmez, 2016; Erol, 2017). Although this definition may apply to study both natural and social issues, there are important differences in terms of the inherent complexity associated with building common understandings and knowledge. According to Williams and Dyer (2017), with regard to research in the natural sciences, physical laws, and known properties of the natural world may help reduce (or at least more or less precisely control for) the number of physical or environmental contingencies that may impact research findings and conclusions. On the other hand, when studying the social world, there are multiple, multidimensional, and endlessly dynamic competing systems evolving over time, and with less opportunities to exert external control, that make social issues, and their corresponding research methodologies, complex (Byrne and Uprichard, 2012; Potter, 1996; Williams and Dyer, 2017).
This inherent complexity of the social world (Byrne and Uprichard, 2012), however, does not mean that such a world is chaotic, random, or unstructured (Williams and Dyer, 2017). Rather, structural forms do emerge and co-exist in social settings. It is the emergence, maintenance, and decay of these structures that allows researchers to detect temporary stability and provides them with the means to make predictions about continuity and change in social dynamics (Alexander et al., 2019; Williams and Dyer, 2017). Arguably then, the main challenge in the study of the social world consist of developing robust and consistent strategies or tools capable of mapping or retrieving these structural forms in order to ultimately model this social complexity. Accordingly, the overarching purpose of this study consists of addressing this analytic and methodological challenge by proposing an analytic framework, and its corresponding software application, designed to extract temporal and dynamic structures in the social world relying both on complex realism and complex systems and dynamic temporal network analyses. Together, these frameworks (complex realism and complex systems) along with a novel methodological approach (dynamic and temporal network modeling), constitute the foundations of Mapping, Organizing, and Visualizing Interdependent Events (MOVIE), a rigorous analytic framework and cost-free software application designed to model complex structures emerging in the simultaneous and dynamic evolution of knowledge generation and communication exchanges in social settings.
To demonstrate MOVIE’s performance and rigor in capturing and recreating the dynamic complexity of micro-level interactions, the analyses presented in this study relied on publicly available data sources on foreign policy and conflict resolution. All data elements and tools are provided with this study to make these analyses fully transparent and reproducible. MOVIE applications are not restricted to small group interactions, instead they can be extended to meso- or macro-levels also following synchronous (or group-based) and asynchronous (or individual-based) processes, whose tracing may help inform policy planning and action.
Social research settings and MOVIE’s (a)synchronous mechanics
The social case study settings discussed in this study were strategically selected to showcase the analytic power of MOVIE in capturing the structures contained in synchronous (i.e. events evolving in the same place where researchers can observe processes and communication exchanges in real time) and in asynchronous (i.e. events not occurring in the same places and times or events where direct communication among participants is not realized 1 ) social contexts—these synchronous and asynchronous settings are further discussed below. Additionally, qualitative social science research as the main case study for MOVIE was selected for two interrelated reasons. First, this type of research is poised with the goal of understanding processes and reasons from a myriad of multiple and multilevel perspectives evolving over time almost simultaneously. As depicted in the introductory section, this complexity is typical of complex realism (Byrne and Uprichard, 2012; Williams and Dyer, 2017), and these types of complex systems is what MOVIE was designed to model. Second, qualitative social science research has typically not relied on sophisticated, innovative, and cutting-edge data science and visualization tools, certainly not at a comparable level to quantitative social science research. From this perspective, although MOVIE principles may also be applied to quantitative research settings, its application to qualitative research not only would demonstrate its analytic power in modeling the inherent complexity of capturing structural forms emerging in processes over time, but also, and perhaps even more importantly, qualitative researchers may likely benefit the most by applying MOVIE given the enormous complexity and multiplicity of moving parts characteristic of this type of research. Relatedly, as briefly noted below, currently available software for qualitative research is not yet capable of mapping the dynamic evolution, synchronously or asynchronously, of processes and reasons. By addressing this gap, MOVIE is likely to have a meaningful impact in the modeling of dynamic, complex structures embedded in (qualitative) social research settings.
Qualitative social science research
Anyone who has conducted even small qualitative studies (e.g. involving a dozen or more participants) knows that they generate an astonishing amount of data. Regardless of the specific methods of data gathering employed (e.g. diaries, interviews, debates, focus groups), when research memos have been generated, data collection has concluded, and data preparation (e.g. transcription) has been completed, the process of fracturing the data (Strauss, 1987) into labeled categories or codes to ease their comparison and sense-making (Miles and Huberman, 1994) typically renders hundreds or even thousands of pieces of valuable, meaningful, and ultimately temporally contextualized information (Coffey and Atkinson, 1996; Neale, 2019) that must be analyzed.
These labeled or coded pieces of information may account for text passages (quotes), images, photographs, or audio and video recordings that capture key concepts provided by research participants. As demonstrated in this study, we can use MOVIE to discover patterns and relationships based on the temporal evolution of these labeled categories highlighting, for example, participants shared or even disputed understandings of the issue under study (Smith, 1978) as well as to unveil or capture processes or reasons as they were emerging during data collection (Alexander et al., 2019).
The main contribution of MOVIE is that this analytic framework focuses on capturing the temporal elements contained in social research settings (Neale, 2019), which are, of course, also contained in the resulting labeled or coded pieces of information. MOVIE leverages the analytic power of these temporal elements to strengthen our understandings of the specific contexts during which participants provided the insights that eventually informed the research findings and conclusions in social research settings—as opposed to the current prevalent approach that to a great extent, or even completely, ignores these temporal elements and therefore discards their analytic power in modeling the dynamic complexity of social interactions.
MOVIE’s (a)synchronous mechanics
To contextualize the discussion of the conceptual lenses and methodological approaches described below, this subsection elaborates on the mechanics behind MOVIE synchronous and asynchronous settings. MOVIE captures the dynamicity of the complex social world by modeling the natural emergence of valuable information (key concepts, categories, or codes) produced by participants, regardless of the specific methods of data collection employed. Specifically, MOVIE can be applied to labels, codes, or categories obtained from individual interviews, focus groups, debates, diaries, videos, conversation analyses, and participant observations, as well as from archival or historical sources or documents, including blogs, social media posts, or other forms of content analysis involving rigorous qualitative (or quantitative via topic modeling, for example 2 ) coding/categorization. MOVIE builds from these chronologically categorized pieces of information to recreate the contexts and the flow of events over time and processes (Neale, 2019) that lead to the emergence of shared understandings and even potential disagreements embedded in the creation and recreation of discourses and knowledge (Alexander et al., 2019). This analytical flexibility allows MOVIE to handle synchronous and asynchronous dynamic, temporal events.
Synchronous temporal events
In synchronous events, MOVIE can be used to capture and recreate group dynamic interactions and communication exchanges taking place in real time, during juxtaposed and continuous time slots, and in the same space (even if this space is virtual, like in a video call or zoom meeting). Synchronous settings involve information and message exchanges (i.e. events) among research participants in real time, such as in focus groups, videocalls, or videoconferences, and more generally in any type of observations involving more than one research participant where interactions are observed and therefore there is a possibility of directly influencing the group’s dynamics (Alexander et al., 2019). That is, these synchronous events involve any form of working groups or group interactions. In these synchronous instances, participants’ actual exchanges of potentially interdependent and interrelated ideas and messages can be observed and recreated in time-lapse.
Asynchronous temporal events
The asynchronous application of MOVIE enables the simultaneous depiction of events that (a) did not happen in the same space nor time or (b) happen in the same place but there was no actual direct communication exchange among participants, therefore minimizing or eliminating the potential for directly influencing the contributions of one another. An example of the latter scenario may be the presentation of experts’ standpoints regarding a similar input or trigger. Specifically, our asynchronous analysis in this study corresponds to two experts’ positions (as of 2020) on what the United States policy should be in Afghanistan. During their presentation, they read their essays prepared beforehand with no rebuttals or interruptions allowed at that time.
In sum, in asynchronous forms of data collection, there are no interactions among participants. Instead, the contributions are made individually, one at the time, via interviews, documents, essays, or archival research. In these instances, the temporal component is focused on capturing the chronological emergence of information as retrieved from or produced by each participants’ storytelling or episodic memories individually, regarding particular events (Murray, 2018), and/or the evolution of their written discourses, essays, or blogs, for example. Despite not being able to observe communication exchanges in the asynchronous setting, MOVIE is capable of tracing the simultaneous co-evolution of the contributions made by the research participants, even when they were located in different places and/or at different times or simply did not interact with one another. MOVIE was designed to organize these individual narratives and visualize them as a group, enabling the analyst to observe how all these individually produced ideas, understandings and narratives collectively and asynchronously evolved simultaneously.
The simultaneous depiction of how the information provided by research participants evolved as a group or network throughout the data collection process, enables the detection of hot zones (Alexander et al., 2019) that signal the natural emergence of clusters of information, perspectives, and beliefs among participants. In other words, in this asynchronous analysis, to the extent that researchers (or moderators) allow participants to express their stories and episodic memories with enough detail (and freedom by not being too restrictive with the questions asked), categories of information or codes will organically evolve, depicting similarities but also differences in the evolution of codes or categories. 3
This resulting depiction of hot zones is not unique to asynchronous MOVIE analyses. Instead, in both synchronous and asynchronous settings, the resulting interactive and dynamic visualizations will highlight structures resulting from sub-group formations and decays over time as well as the recreation of the dynamic evolution of knowledge generation in social research settings. Finally, by highlighting the synchronous and asynchronous evolution of information, MOVIE not only provides more transparency to the research analysis but also makes this process more interactive. Interactivity is achieved by enabling readers to create and recreate their own understanding of the evolution of these events and the validity implications of such an understanding of this evolution (Alexander et al., 2019).
Premise, purpose, and significance
Premise
The main premise of this framework is that the dynamic, temporal attributes of social research data are present in all resulting qualitatively labeled or coded databases regardless of the prospective (continuous and ongoing) or retrospective (historical) data collection strategy(ies) employed (Alexander et al., 2019; Neale, 2019). Despite the prevalence and meaning-building relevance of these temporal elements, they have vastly been ignored or remained peripheral in most qualitative analyses and visualizations. An important reason why these temporal pieces of data have been underutilized is the current lack of analytic tools that enable researchers to straightforwardly map, organize, and visualize the emergence and decay of these dynamic temporal elements. Indeed, even the most recent advancements in tools for visualizing qualitative data, as depicted by the CAQDAS Networking Project, 4 typically stop at presenting a snapshot in time of shared meanings, instead of mapping the evolution of information, connections, and knowledge construction taking place in social research settings.
From a methodological perspective, currently, the analyses of temporal elements in social research is a daunting endeavor given the multiplicity of pieces of information moving simultaneously in the complexity of human interaction and knowledge production and exchange (Byrne and Uprichard, 2012; Potter, 1996; Williams and Dyer, 2017). Relatedly, even when analytic tools may be available to achieve the goal of mapping the emergence and decay of structure and information, computer programming requirements pose an almost impossible hurdle to surpass for the mainstream use of these analytic tools for the vast majority of social science researchers, particularly those interested in mixed methods and qualitative research.
Purpose
Based on the discussion presented so far, the twofold purpose of this methodologically innovative paper is to provide an analytic framework—MOVIE—that dynamically captures in time-lapse the meaning-building processes followed by research participants in social research settings in both prospective and/or retrospective contexts. Additionally, this paper seeks to democratize access to sophisticated data science, visualization, and text retrieval tools by removing all computer programming requirements to implement this groundbreaking analytic framework at no financial cost. Indeed, the distribution of the software that implements MOVIE is being made completely open-access and cost-free. In a nutshell, informed by complex realism and complex systems theory, operationalized via temporal dynamic network modeling, MOVIE (Mapping, Organizing, and Visualizing Interdependent Events) enables analysts to trace and study how elements and events of synchronous 5 and asynchronous 6 research evolved with a clear emphasis on visualizing the temporal emergence, stabilization, and decline of information as provided by research participants in the social settings studied.
Significance
Because MOVIE was intentionally built to work with the output resulting from currently available software tools for qualitative analysis (e.g. ATLAS.ti, NVivo, or MAXQDA), most qualitative labeled, coded, or categorized datasets can be analyzed with MOVIE with minimal or no extra data cleaning or preparation. The most significant aspect of MOVIE as an analytic framework is that, as detailed next, MOVIE can be applied to the ATLAS.ti, NVivo, or MAXQDA 7 outputs even if researchers built their datasets or created their codes or labels without considering their inherent temporal components. This added flexibility is relevant because not only does MOVIE can be applied to future data collections or projects, but it can also be applied to already analyzed qualitatively coded databases. If MOVIE is used to reanalyze previous databases, possibly of already published studies, researchers may be surprised to see that new insights will surely be gained with the capturing and visualization of the temporal elements embedded in these databases. Indeed, it is quite likely that the resulting outputs, which fully depict the evolution of connections and information in time-lapse, may allow authors of published studies to write new papers with those same data.
Another reason of MOVIE’s significance is its added transparency to the analytic process. This added transparency is relevant because qualitative methodologists have argued for greater disclosure of how qualitative researchers conduct their analyses and reach their conclusions (Attride-Stirling, 2001; González Canché, 2022b). Given that MOVIE focuses on the temporal evolution of information, the resulting analyses and visualizations depicting temporal components, may enable everyone interacting with the resulting outputs to observe firsthand the flow of events (Smith, 1978) as they emerged over time in their actual contexts (Alexander et al., 2019). Moreover, since the outputs resulting from the proposed framework are interactive and offer detailed information about the contributions of each participant (including the content of the message or text quote, as depicted in the findings sections), research participants can observe their individual “performance” or contributions as well as their contextualized contributions with respect to the entire group and offer feedback or new insights from this observation exercise. In both instances, as an added validity check, researchers may ask participants to react to this “performance” to see if they are satisfied or agree with the depictions generated by MOVIE (Alexander et al., 2019). Finally, readers themselves can form their own assessment of the thought processes and conclusions reached by the researchers through the observation of the interactive and dynamic outputs. Note, however, that since researchers themselves have been involved in data collection, cleaning, and classification, their input and expertise remains the most important asset in the analytic process but with the outputs generated by MOVIE, this process is much more transparent.
Conceptual lenses: Complex realism and complex systems
The main conceptual tenets of MOVIE are Complex Realism and Complex Systems. The following discussion introduces the main concepts of complex realism and subsequently we will discuss complex systems and the operationalization of both lenses through temporal and dynamic network modeling.
Complex realism
As depicted in the introduction, the study of the social world is a challenging endeavor given the multiple, multidimensional, and endlessly dynamic competing systems evolving over time (Byrne and Uprichard, 2012; Potter, 1996; Williams and Dyer, 2017). MOVIE aligns with the notion of general complexity as presented by Byrne and Uprichard (2012), which by involving nonlinearity in networks (or groups) of nested systems, offers reliable and valid models that represent true social complex systems, rather than simulations of these systems—as in the case of restricted complexity (Byrne and Uprichard, 2012). MOVIE then seeks to capture and produce sociologically useful and meaningful descriptions of social world events in what George and Bennett (2005, cited in Byrne and Uprichard, 2012) referred to as “process tracing.” In the original work of George and Bennett, process tracing, as a “method attempts to identify the intervening causal process—the causal chain and causal mechanism—between an independent variable (or variables) and the outcome of the dependent variable” (p. 206). In MOVIE, process tracing is operationalized with the visual depiction of knowledge generation and communication exchanges as observed in our social research settings. Certainly, the data input for MOVIE can be purposefully collected to achieve the goal of process tracing as depicted by George and Bennett, but MOVIE’s intention in this paper is not to depict causal chains among dependent and independent variables, but rather to offer a transparent, reliable, rigorous, and fully reproducible depiction of how the knowledge generation process evolved in our social research settings. From this view, by aiming to carefully reconstruct the history of the knowledge evolution, MOVIE aligns more closely with the depiction of complex realism depicted by Byrne and Uprichard (2012).
In MOVIE, the concept of “system traces” proposed by Byrne and Uprichard (2012) takes two main interrelated but different forms. In the asynchronous systems, there are multiple single cases brought together as part of the same study (e.g. multiple individual interviewees, multiple essays). Each of these cases may be operationalized as a complex system (resulting in as many systems as research participants are) and the analytic power of MOVIE consists of depicting all the independently created traces of each of these systems together in a simultaneous description of the “traces of the systems’ trajectories through time” (Byrne and Uprichard, 2012: 6). In the case of synchronous settings, each group observed consists of a complex system configured by more than one knowledge producer whose traces, attributes, relationships, and co-influence may also be captured and reconstructed through time, to obtain a systematic and organized depiction of the evolution of relationships, dependence and influence of knowledge production and conflict and resolutions over time (Alexander et al., 2019; Byrne and Uprichard, 2012). In both synchronous and asynchronous cases, the emphasis remains on accurately capturing these traces in the system(s), and the resulting outputs display all relationships and knowledge configurations that took place in each system(s)—this configuration resembles a dynamic, temporal multidimensional contingency table (or rather multiple tables), similar to the time-aggregated truth table produced by qualitative comparative analysis (QCA). The multiplicity of truth tables produced by MOVIE aligns with the depiction of the system(s) as having emergent properties through time. Accordingly, each trace captured at time
In MOVIE, social categories (or classifications) precede all comparisons of patterns of continuity and patterns of change. As Byrne and Uprichard (2012) stated, our classifications are an essential part of the analytic process, for these systematic comparisons would not be possible without some form of measurement or classification. From this perspective then, to the extent that our classification approach is accurate in capturing social complexity, our resulting analyses and outputs obtained from MOVIE will also accurately capture this complexity. But if our classification approach is weak or unsystematic, then our resulting analyses will fall short in providing useful evidence of the social setting studied.
Complex systems
The complex, multifaceted, and temporal-based evidence of participants’ realities may be mapped (by identifying its elements through classification methods), organized (sequentially, chronologically, or otherwise), and visualized as this evidence evolved (or was chronologically generated). From this view, MOVIE consistently and systematically reproduces the classified evidence recovered from our synchronous or asynchronous research settings. MOVIE then, is an analytic framework and tool designed to ease the understanding of individually produced or interactively generated events by tracing and uncovering the processes that may have affected participants’ experiences, outcomes, and standpoints. Aligned with a complex realist perspective, MOVIE is founded on the notion that behaviors, meanings, and processes emerging during social processes, and their temporally contextualized connections, can be captured as they emerge and can be visualized and reconstructed following time-lapse and network principles. It is this organic evolution of meanings, behaviors, and connections evolving over time that make the use of complex systems, as operationalized through temporal and dynamic network theory and methods (González Canché, 2019; Wolf et al., 2021), a natural complement of complex realism that allows tracing in time-lapse these complex and dynamic exchanges of information and processes of knowledge production and sense-making.
Complex systems and network theory and methods
The elements and properties of complex systems may be better understood by first describing the notion of a system (Byrne and Callaghan, 2014; Mitchell, 2006; Zeng et al., 2017). In its simplest form, a system consists of a set of elements and relations. As these elements and relations grow in number, complexity, and variety, local interactions will organically emerge and yield new levels of organization. The relationships in these elements are nonlinear, indicating that a change in the number of elements and/or connections does not necessarily indicate a change in the output or outcome. For example, if during a working group observation, we notice that some members had to leave before the meeting has ended (see González Canché, 2019), the observed dynamics may not necessarily be affected by these departures—if the party who left was rather quiet and non-participative. Rather, the roles played by the members who left (and those who stayed) are what contribute to changes in output or dynamics. In other words, nonlinearity indicates that the output is not proportional to input changes (Sanchez et al., 2019).
Another important attribute of complex systems is feedback (Zeng et al., 2017), wherein outputs generated as the process develops can be routed back as inputs to trigger more outputs. This can be observed in information exchanges where meanings can be co-generated or, in some cases, driven mainly by one participant (or subgroup) who is influential enough to convince the entire group to adopt a particular viewpoint. However, the evolution of this process of change (i.e. convincing other participants) is complex. For instance, in one of our applied examples, we will observe the interactions taking place among 12 jurors (from the film “12 Angry Men”), wherein at the beginning of their journey, only one of these jurors was not convinced that the accused was guilty and eventually all of them changed their vote from guilty to not guilty. Accordingly, complex systems also involve the properties of spontaneous order and the emergence of new levels of organization. These properties refer to the natural emergence of subgroups or subtopics absent from central control (Zeng et al., 2017). That is, even if the groups or organisms observed are subjected to some form of external control (i.e. group moderators or individuals holding some form of hierarchical status), subgroup formation based on the numerosity of relationships and potential changes in the number of elements (addition of new elements or departure of some participants) will happen, eventually leading to order and organizational fracturing and reconfiguration.
As depicted above, these complex trajectories of patterns of continuity and patterns of change (Byrne and Uprichard, 2012) do not need to happen synchronously. For example, take the case of information production or generation in individual interviews. Because virtually all interviews follow a similar structure, eventually reaching a climax, in terms of information production, and then decay, based on the potential extenuation of episodic memories, complex systems thinking may be applied so that multiple interviews of the same project can be juxtaposed asynchronously to observe how these processes as a group or network evolved, depicting, in doing so, patterns of continuity and patterns of change. This approach can highlight the emergence of spontaneous order or hot zones (Alexander et al., 2019) and subgroups or levels of organization. MOVIE as an analytic strategy can also highlight how certain participants took longer to extenuate their episodic memories—and whether the production of more information actually led to a better understandings of the phenomenon under study—certainly, more information does not necessarily mean more meaningful contributions if these longer pieces of information are redundant or repetitive.
Complex systems thinking, then, is useful for analyzing different types of relationships and communities interacting synchronously or asynchronously. Its use allows for the visualization of the structure of the system (group dynamics), or systems (multiple individual contributions) being studied. Because these systems are configured by elements and connections (Maroulis et al., 2010), complex systems can naturally be operationalized as dynamic and temporal complex adaptive networks. Indeed, although the examples so far have centered around social settings, more common applications of complex systems include the study of cellular processes, the immune system, and traffic and transportation systems (Maroulis et al., 2010; Mitchell, 2006; Zeng et al., 2017). In each of these applications, the emphasis is on how the parts configuring these systems are interconnected and can be represented as temporal dynamic networks. Relatedly, given that network principles and methods operationalize MOVIE—as well as complex realism and complex systems—, the following section describes the main features of temporal and dynamic network modeling according to their application in this proposed framework.
Methods: Temporal dynamic network thinking and modeling
Network thinking and network modeling are particularly useful to “deal with complex systems in the real world” (Mitchell, 2006: 1199). Temporal network thinking and modeling help researchers make sense of multiple, multidimensional, and dynamic competing classifications (Byrne and Uprichard, 2012; Potter, 1996; Williams and Dyer, 2017) evolving synchronously or asynchronously in time and space (González Canché, 2019). Operationally, dynamic network thinking emphasizes relations among specific events at a specific time (Butts et al., 2020), including connections among individuals and their actions or among broader social categories or classifications (Byrne and Uprichard, 2012) as defined, or measured, by researchers (Maroulis et al., 2010).
Formally, networks are a collection of potentially interactive units (Kolaczyk and Csárdi, 2014; Mitchell, 2006; Wasserman and Faust, 1994). These units are typically referred to as nodes or vertices (e.g. actors, participants, or entities with which participants may interact with or to which they may be ascribed), and the connections resulting from their interactions are referred to as edges or links (Wasserman and Faust, 1994). When the units configuring a given network are of the same type and hierarchy (e.g. students interacting with other students) they form a one-mode network. When the units configuring the network are different (e.g. professors ascribed to their employing universities or ascribed to a particular set of beliefs) they form two-mode networks.
MOVIE relies on both one-mode and two-mode networks. When the analyses focus on the information provided by participants (i.e. codes or labels), the main form of relationships captured is among participants and the information (i.e. codes) they provide. This form of analysis makes it possible to depict participants across time who cluster around certain topics or viewpoints and those who do not (Alexander et al., 2019). These relationships can be expressed as
Data format and transformations
The time dimension captured by MOVIE makes the storage of information in traditional matrix formats (or rectangular databases), where participants are in the rows and variables (attributes, social categories, or classifications) are in the columns, impractical. This is because, as described in the conceptual lenses section, each time component may be expressed as a truth table, leading to as many truth tables as time traces are captured in the system(s). To address this complexity, MOVIE instead initially stores all time traces of information in two main columns: sender and receiver connections, wherein each of these connections were observed at time
These two columns (sender and receiver) are referred to as a collection of links or edges, also known as edgelists (Csárdi and Nepusz, 2006; Wasserman and Faust, 1994). However, recall that traces of these events over time
where, from an edgelist in the forms
Conceptual representation of data formats and flow of the entire analytic process.
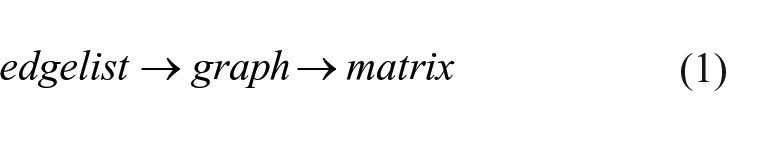
In addition to its methodological properties, another value added of (effectively temporal) edgelists is that this data format is the default output of all widely available qualitative coding software (e.g. ATLAS.ti, NVivo, MAXQDA, or RQDA). Accordingly, when applied to qualitative data sources, no extra cleaning is required to use MOVIE. Nevertheless, note that as part of this study, we are providing a Microsoft Word macro that mirrors the coding process followed by the ATLAS.ti, NVivo, MAXQDA, and RQDA software applications. To exemplify this process, assume we have two participants, each expressing their opinions about what the policy of the United States in Afghanistan should be—more on this case selection below. Access to the entire coded/labeled transcript of this analysis along with the data source is provided in the application section below; however, for now, let us simply focus on the first three
These relationships are shown in Figure 1. The Microsoft Word macro was designed to use Word as a coding device. This macro transforms all comments (added by selecting a text, Review menu, New Comment  ) in a Word document (observation or interview transcript, for example) into a table that is automatically exported to Microsoft Excel.
8
The execution of this macro and the example of this table is shown also in Figure 1 and contains the following columns:
) in a Word document (observation or interview transcript, for example) into a table that is automatically exported to Microsoft Excel.
8
The execution of this macro and the example of this table is shown also in Figure 1 and contains the following columns:
Page & Line: the page number and line number where the quote (selected text in the transcript) associated with a comment (i.e. code) can be found (to ease access to the original information).
Quote: Content of the code or label.
Author_or_coder_name: information of the coder (retrieved from Microsoft’s username).
Coding_date: date when the code or label was created.
Sender: The provider of information, which we have referred to as
Receiver: The label or code, referred to as
Accordingly, the edgelist or list of connections in this table that would allow us to trace the evolution of information is contained in the columns Sender and Receiver.
Procedurally, each comment starts with the name of the actor (Laurel and Michael, in these case) followed by a colon (or “:”). The colon serves as a text delimitator to separate the columns Sender and Receiver, which by default are rendered as one column by our macro (to separate the content of this column, select the entire column, then select Data, Text to Columns, selecting “:” (without quotes) as the delimitator—see Figure 1). Note that the indicator of time
Example of MOVIE dynamic HTML output.
The transformations automatically conducted by MOVIE are reflected in the matrices (or truth tables), which render one contingency table of actor by code/label per time observed. Note that as the number of actors increases, the number of rows also increases and, if each actor has a unique contribution at time
Time-aggregated asynchronous debate output.
Dynamic temporal asynchronous debate output.
Highlighting structure
In its visual representation of data, MOVIE follows graph theory principles (Biggs et al., 1986) and indices of relevance in the system, also known as centrality (Freeman, 1978). Centrality is one of the most important concepts in network analysis because it enables understanding of the overall network structure through each actor’s individual relevance/influence in the network (Freeman, 1978). Centrality measures (also sometimes referred to as influence), identify movement and structure in the network through actors’ positions and paths or connections (Borgatti, 2006). MOVIE computes three centrality measures to highlight structure in the system by identifying sets of key units in the network who play different roles as highlighted by these centrality measures: degree, betweenness, and eigenvector. The following discussion is a summary of each of these measures.
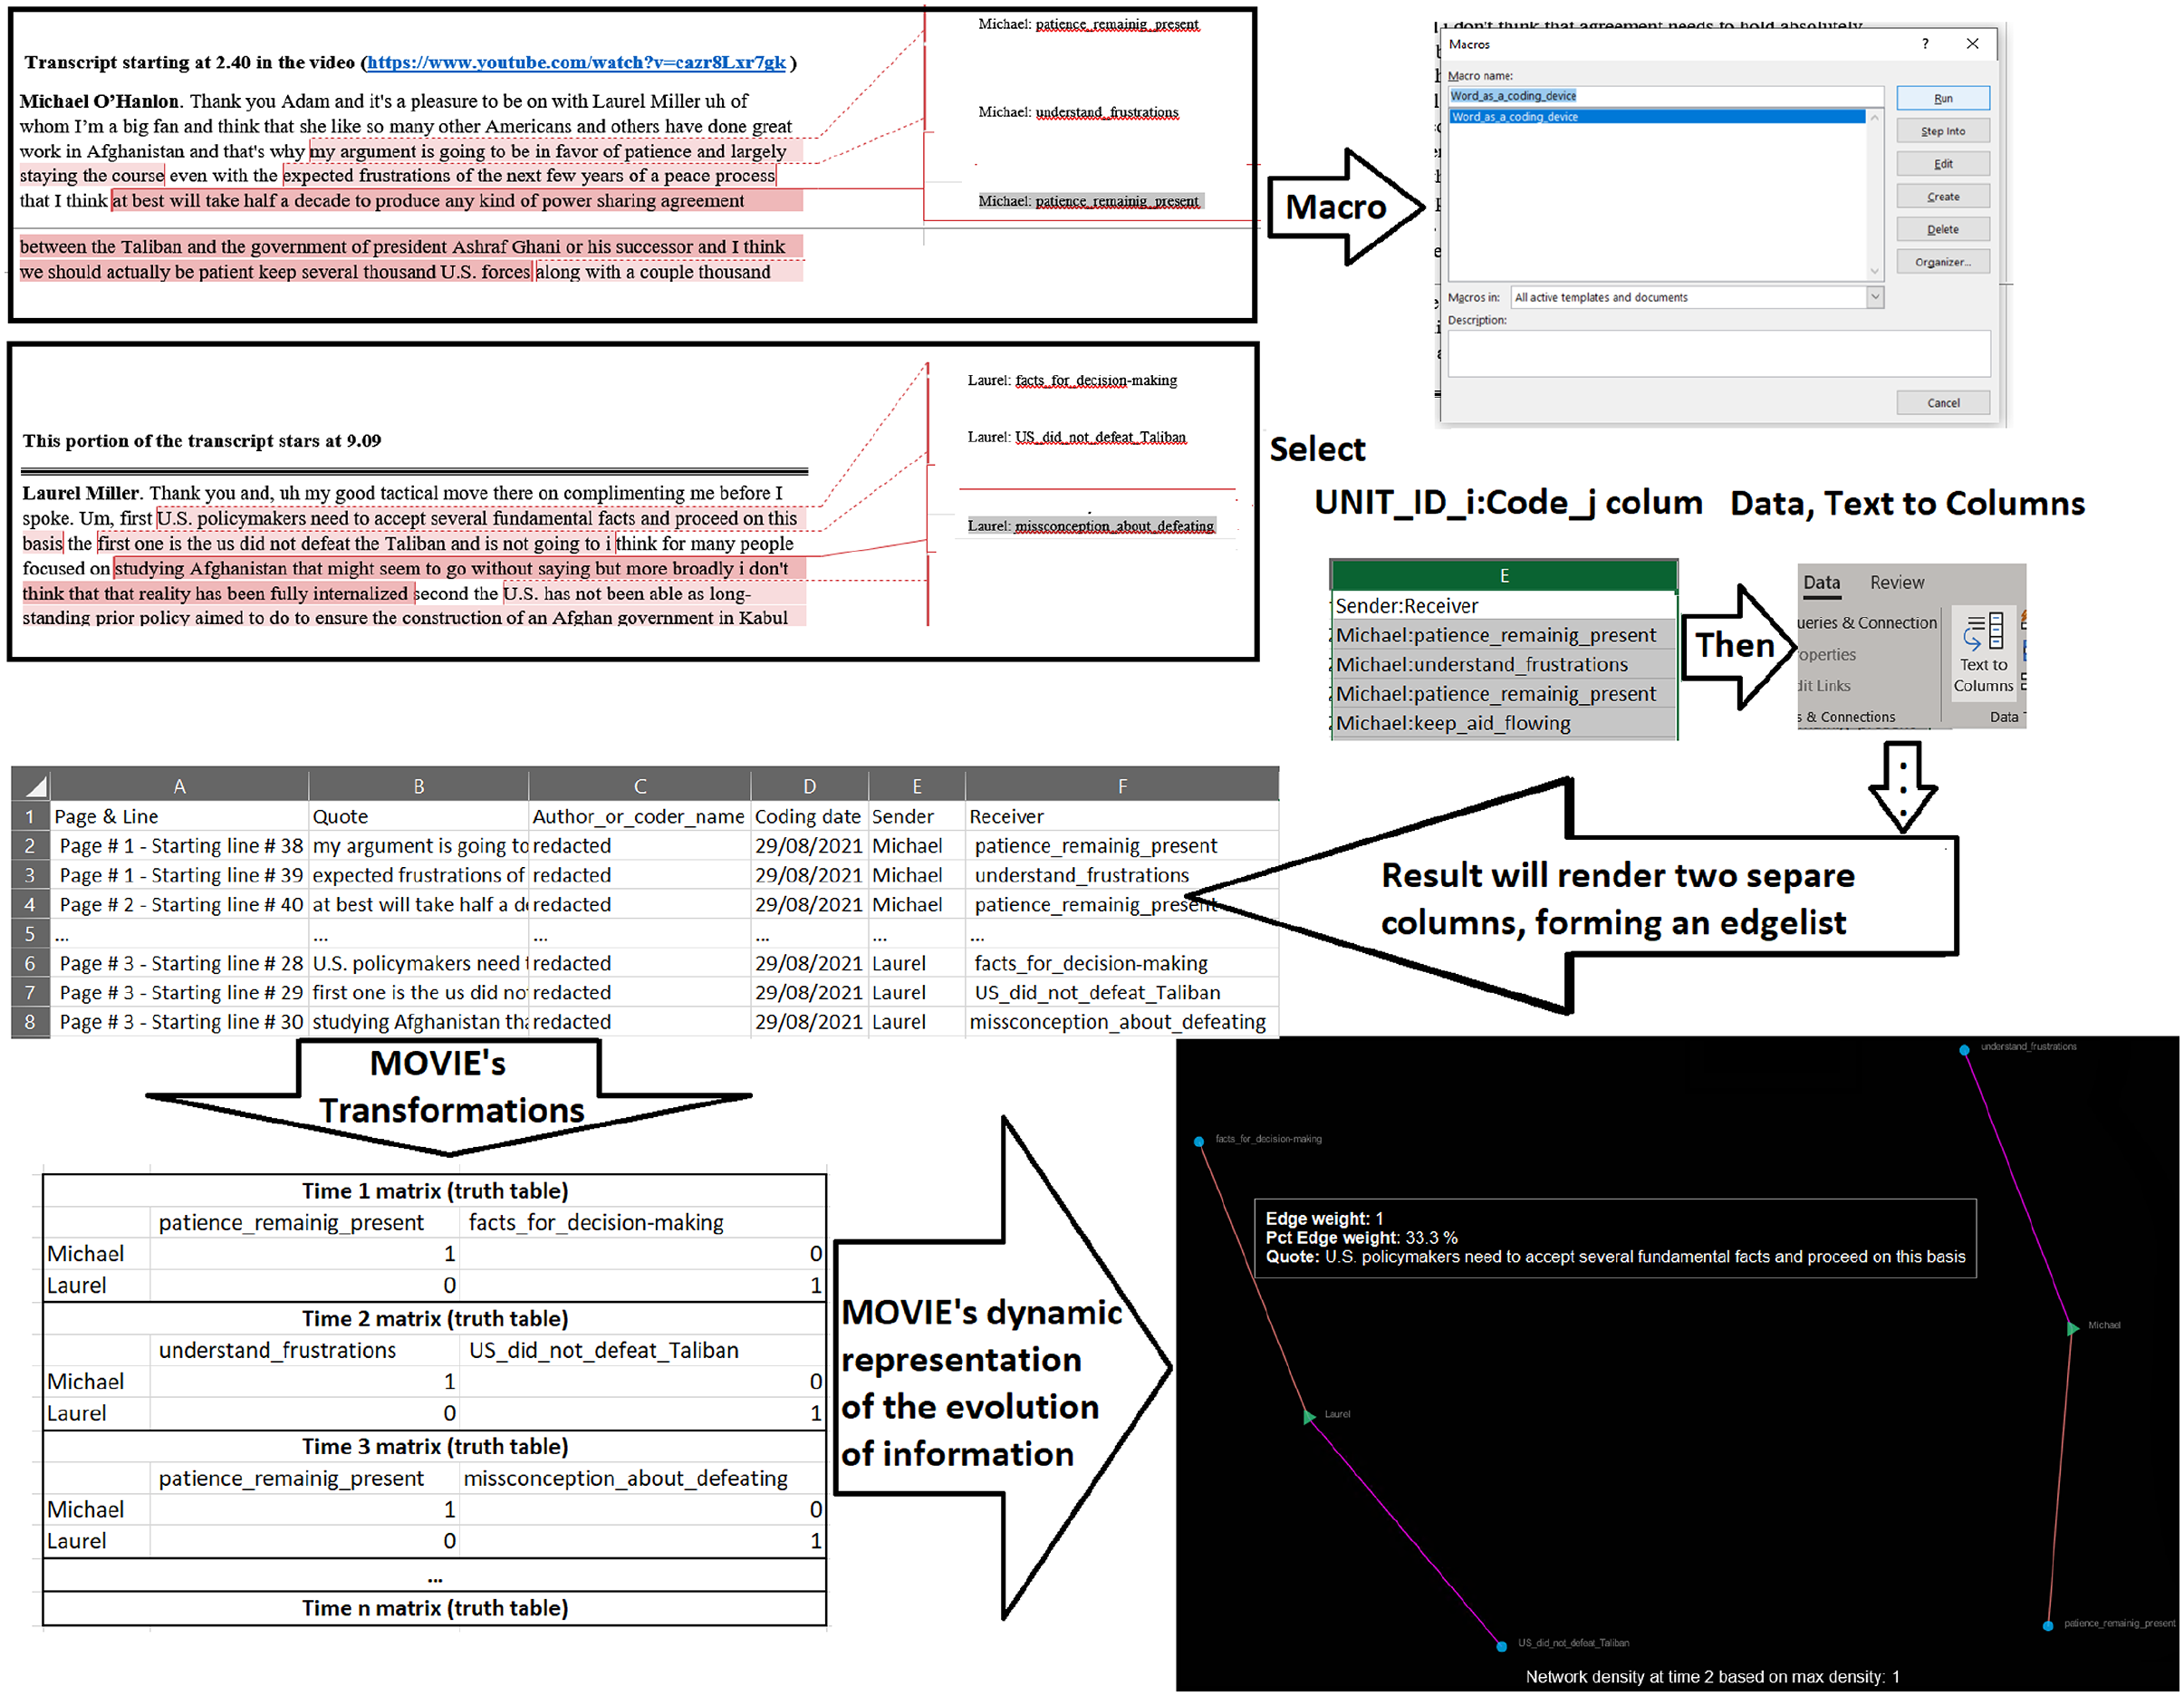
Degree centrality reflects the number of connections that a given actor has in the network (Borgatti, 2006). In this project, degree centrality is computed by counting the number of times that an actor provided information that was eventually classified as a code or by the number of messages exchanged with another actor in the group discussion. In our small example, we purposefully limited this number to the first three contributions. Accordingly, both Michael and Laurel have a degree centrality of three. The interactive HTML outputs (presented below) allows users to click on actors and codes to show these centrality measures. With respect to degree centrality, the information labeled “No. of contributions,” displayed when selecting an actor, indicates the total number of codes (contributions) provided by that actor. For example, in Figure 2, in the dialog box near actor Laurel, “No. of contributions: 3” indicates that during this subset of her reactions to the prompt “role of the US in Afghanistan policy” (formally described below), Laurel provided three pieces of information that were eventually qualitatively labeled or coded. Similarly, clicking on each code generates a dialog box showing the number of times all participants provided information classified under that code. Take “facts_for_decision_making” for example, in this case the “No. of contributions: 1” indicates that this code was only mentioned once among all participants (even though there are only two in this brief example). To be as comprehensive as possible, note that the connecting line of an actor to a code (or edge) also conveys information derived from these degree centrality measures in MOVIE. In following with this example, note that actor Laurel and code “facts_for_decision_making” have an “Edge weight” value of 1.
10
This indicates that, of the three codes provided by Laurel, 1 corresponded to the code “facts_for_decision_making,” representing 33.3% of her total number of contributions (or
The next centrality measure included in these frameworks is eigenvector centrality. This measure accounts for the overall influence of a given code or participant. As depicted in Figure 2, this measure also appears in a dialog box (as “Influence index”) when an actor or code is selected. Eigenvector highlights individuals or codes that are central as a function of being connected with individuals and or codes that were active in the network (Borgatti, 2006; Freeman, 1978). Hence, an actor is central in eigenvector if such an actor provided codes or established connections with other actors who were also active or central in the network (influence begets influence). Mathematically, the eigenvector centrality of a unit i is proportional to the sum of centralities of the units j to whom unit i is connected (Borgatti, 2006; Freeman, 1978). Eigenvector is standardized to range from 0 to 1, with 1 indicating the maximum level of influence. The level of influence of each actor and/or code may serve to further contextualize their contribution to our understandings and strengthen our qualitative evidence. However, these numbers must not replace the nuances of researchers’ understandings gained before and during data collection and analyses. As depicted in Figure 2, Michael has the highest eigenvalue centrality among human actors. In the case of codes or labels, the code “patience_remaining_present” has the highest possible value of 1, which reflects that this code was the most relevant among all other codes. Note that eigenvector goes beyond counts, like in the case of degree centrality. That is, although both Laurel and Michael were constrained to only showing their three first codes (hence both have a degree of three), Laurel had an eigenvector of 0 because the codes she mentioned were not shared by the other member of the group—or only Michael in this case. Nonetheless, note that in the case of Michael, his influence index value of 1 is explained by him having shared one code (“patience_remaining_present”) twice during this short example. In this case both Michael’s centrality and the centrality of this code shared twice, were the most influential actors from an eigenvector centrality perspective, because both Michael provided a code that was shared more than once and because the code was connected to the actor who provided the code shared the most; hence, this particular dynamic may be classified as self-selection or privilege reproduction. Finally, to further highlight the notion of “influence begets influence” note that although the code “understand_frustrations” was only mentioned once (as in the case of all the three codes provided by Laurel), the influence index of this code was 0.5, whereas all the codes provided by Laurel had a value of 0. This 0.5 value is explained by this code having been provided by the actor with the highest eigenvector centrality in this system. This example serves to highlight three important aspects: (a) these measures of influence are more powerful when contextualized and understood, (b) their interpretation may not simply be reduced to numeric values, and (c) perhaps more importantly, this self-selection issue is most concerning with limited data (three codes and two actors in this case), as the system grows, the resulting complexity will result in influence measures that are not affected by outliers or atypical instances. This latter point is illustrated in our examples section wherein when considering all codes provided by both Laurel and Michael, both of them were equally influential.
Finally, MOVIE also calculates betweenness centrality. This measure captures the extent to which a given actor or unit falls in between other units (Wasserman and Faust, 1994), thus serving as a bridge between actors or units to ease the flow of communication (Borgatti, 2006; Freeman, 1978). Accordingly, betweenness centrality highlights both the participants who served as bridges of information and the codes that connect individuals in a network. The dynamic HTML outputs use betweenness centrality to add size to each actor or code. From this view, bigger actors or codes indicate that such actors or codes are serving as bridges of information. MOVIE has standardized this measure to change as time progresses. Based on this dynamic change, researchers can observe which actors and codes were the most influential from this centrality perspective in a given point in time. Figure 2 shows that both Laurel and Michael have a higher size (and shape) than the codes or labels (more on this below), because they are falling in between their respective codes. Betweenness centrality size changes will be more evident in systems that have more participants and codes.
Adding time-evolving connection and actor attributes
The connecting lines in MOVIE (which may connect actors to codes or actors to actors) allow researchers to add the actual content of the information traced at time
In addition to the “Edge weight,” “Pct Edge weight,” and text content or “quote” described above, the color of the connection shows whether the code just emerged or was present in the previous time. Green lines (or orange lines in high contrast settings, like in Figure 2) correspond to codes that just emerged at time
In addition to network-based attributes calculated by MOVIE and the line attributes just depicted, MOVIE accommodates time-evolving attributes at the node (i.e. actor or code) levels. These attributes, while optional, may be added to highlight the roles and influence levels represented in these relationships. At the node level, users can add participants’ time-invariant and dynamic attributes. Time-invariant attributes include those characteristics that did not change during the data collection process such as age (if the project lasted less than a year), ethnicity, gender, or any particular role played in the group that did not change during the study. Dynamic attributes capture changes, and these changes may include differences in standings on a given issue or even the tone they use when sending a message or providing information that was subsequently categorized in a code. In the conflict resolution example, we added a “Tone” attribute to depict if the message was sent with an aggressive, not aggressive, or frustrated tone (tone can be also considered as a theme or code family). We also added stand to capture whether at a given particular time, the stand of the participant (juror) was guilty or not guilty. Finally, we added a role column indicating whether the participant was a juror or the foreman—this latter attribute did not change in this case. For the policy analysis, we added “Stand” indicating whether the position of the expert was to keep US forces in Afghanistan, prepare to leave, or a combination of both. Tone was added to capture whether the message sent with a cautious, realistic, distrustful, or firm underlying intention (these classifications need agreement and discussion in research teams). Finally, the role did not change in this data collection and included: Senior Fellow and Director of the International Crisis Institute. 11
All attributes that change over time will evolve in the MOVIE dynamic outputs. The summary (aggregated) network depiction will contain the first attribute per actor captured in the database—see interactive outputs section below. When researchers select columns with these “sender” attributes, the resulting network visualization will represent them via color or shape variation in the HTML rendering. MOVIE currently allows up to 11 colors. This colors may be conceptualized as categorical attributes. That is, if researchers are interested in mapping ethnicity and this indicator has up to 11 categories, MOVIE was programmed to automatically map these colors to its corresponding category. Note that if no color attribute is selected, MOVIE automatically sets different colors for actors and codes. All codes are blue by default (in the high contrast setting depicted in Figure 2, or orange in a non-high contrast setting) and green or pink (in high contrast and non-high contrast settings, respectively) for actors. 12 The “Role” information displayed when selecting a code will always be “code” because all changing attributes are added for actors or senders of information only. That is, if a role attribute was added as a different column, similarly to the example depicted with seniority and sector, one of these roles information will be displayed clicking on an actor but will remain as “code” when selecting a code. In our example in Figure 2 we did not add any color or shape attributes, but we will demonstrate the addition of these attributes in the complete analysis. For now, it may suffice to mention that when no shape attributes are added, codes will be circles and actors (senders) will be triangles. 13
Application examples
To demonstrate the capabilities of MOVIE and the Microsoft Word macro that allows using Word as a coding device, this section presents three examples of analyses. The main data source for these analyses are two publicly available YouTube videos that were fully transcribed and coded. The selection of these sources was made to provide as much clarity and transparency to the analytic processes as possible. All readers then, have all the tools and elements required (transcripts included) to replicate these analyses or create their own, using their own coding or labeling schemes.
The first example focuses on analyzing American foreign policy, wherein two international policy experts responded to the prompt “what should U.S. policy toward Afghanistan be?” This debate took place in August 2020 and was sponsored by the Charles Koch institute and the Brookings Institution’s Foreign Policy Program. The video analyzed is available online here https://youtu.be/cazr8Lxr7gk?t=160. The entire transcript with codes of this video can be accessed here https://cutt.ly/2WlF2W8. The replication database included in MOVIE can be accessed here https://cutt.ly/KRJmpaF. The analyses presented correspond to the text that starts at minute 2.40 and ends at minute 16.20. This first analysis takes the form
The second case study is a scene of the movie “12 Angry Men” which depicts a complex and dynamic generation of information and exchange of ideas and rebuttals among a group of 12 jurors. The scene analyzed can be accessed here https://www.youtube.com/watch?v=HK7CfffM1OQ. The transcript with codes for the synchronous
MOVIE HTML dynamic, interactive outputs
MOVIE renders two main HTML outputs. The first is the time-aggregated analyses of all  controls in this HTML rendering https://democratizing-data-science.github.io/MOVIE/Debate_temporal_dynamic_analyses.html, for example, further described below) will advance the animation forward or backward one transition point at a time. The buttons to the right and left of the pause button show the evolution of interactions from zero to N. The backward or rewind button, located to the left of the pause button, initiates the devolution of these interactions until time zero. The pause button stops the animation at any point in between zero to N, and researchers can zoom in on any participant or hot zone and display message content or participants’ attributes to contextualize these interactions.
Asynchronous
analyses (foreign policy)
Time-aggregated output
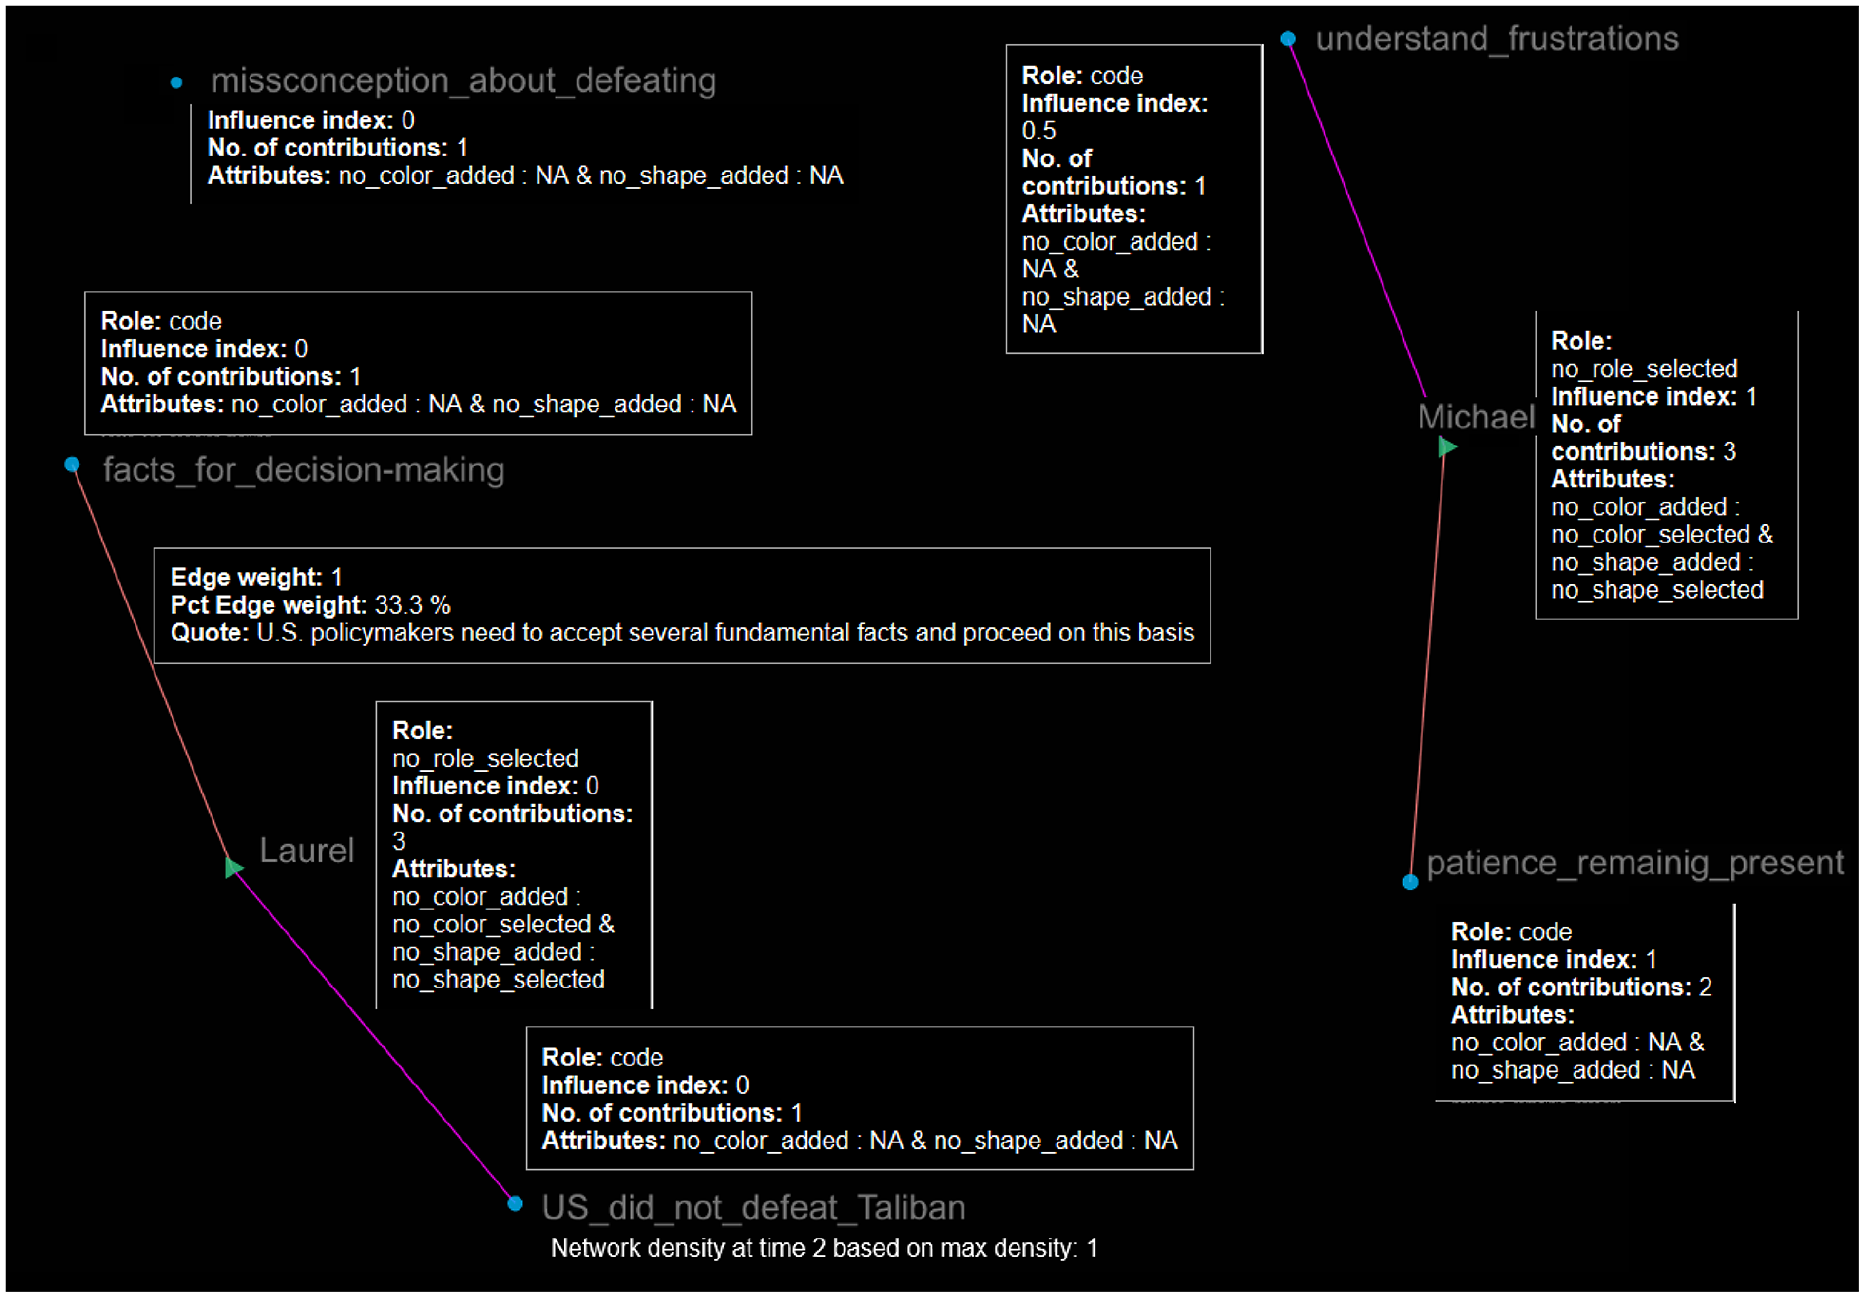
This output is shown in Figure 3. The HTML version can be accessed at https://democratizing-data-science.github.io/MOVIE/Debate_time-aggregated_analyses.html. At first glance, note that the time-aggregated depiction of the system serves as a high-level summary, with color schemes indicating divergent roles, tones, and stands (i.e. Laurel’s stand and tone were to prepare to leave and critical, and Michael’s were to remain present, with a firm tone). The codes/labels in the middle of the graph clearly indicate that among all contributions made by the two experts, only four of them were shared. Figure 3 depicts the zoomed in version of these asynchronously shared pieces of information. First, note that in the time-censored version of this video analysis shown in Figures 1 and 2, Michael had an influence index of 1, and Laurel had a value of zero in this centrality measure. In this complete version, both experts obtained the maximum value of influence. This is likely because both had the same number of contributions. Note that this number of contributions was not set beforehand, both experts happened to offer information in their presentations that were classified in 21 codes/labels. Regarding these shared pieces of information, note that only one of these codes had an influence index of 1, and was shared five times in total by these experts in their respective essays. This code is “Afghanistan_will_fall_withouth_US.” Laurel provided information that was coded using this label three times (accounting for 14.3% of her contributions, or
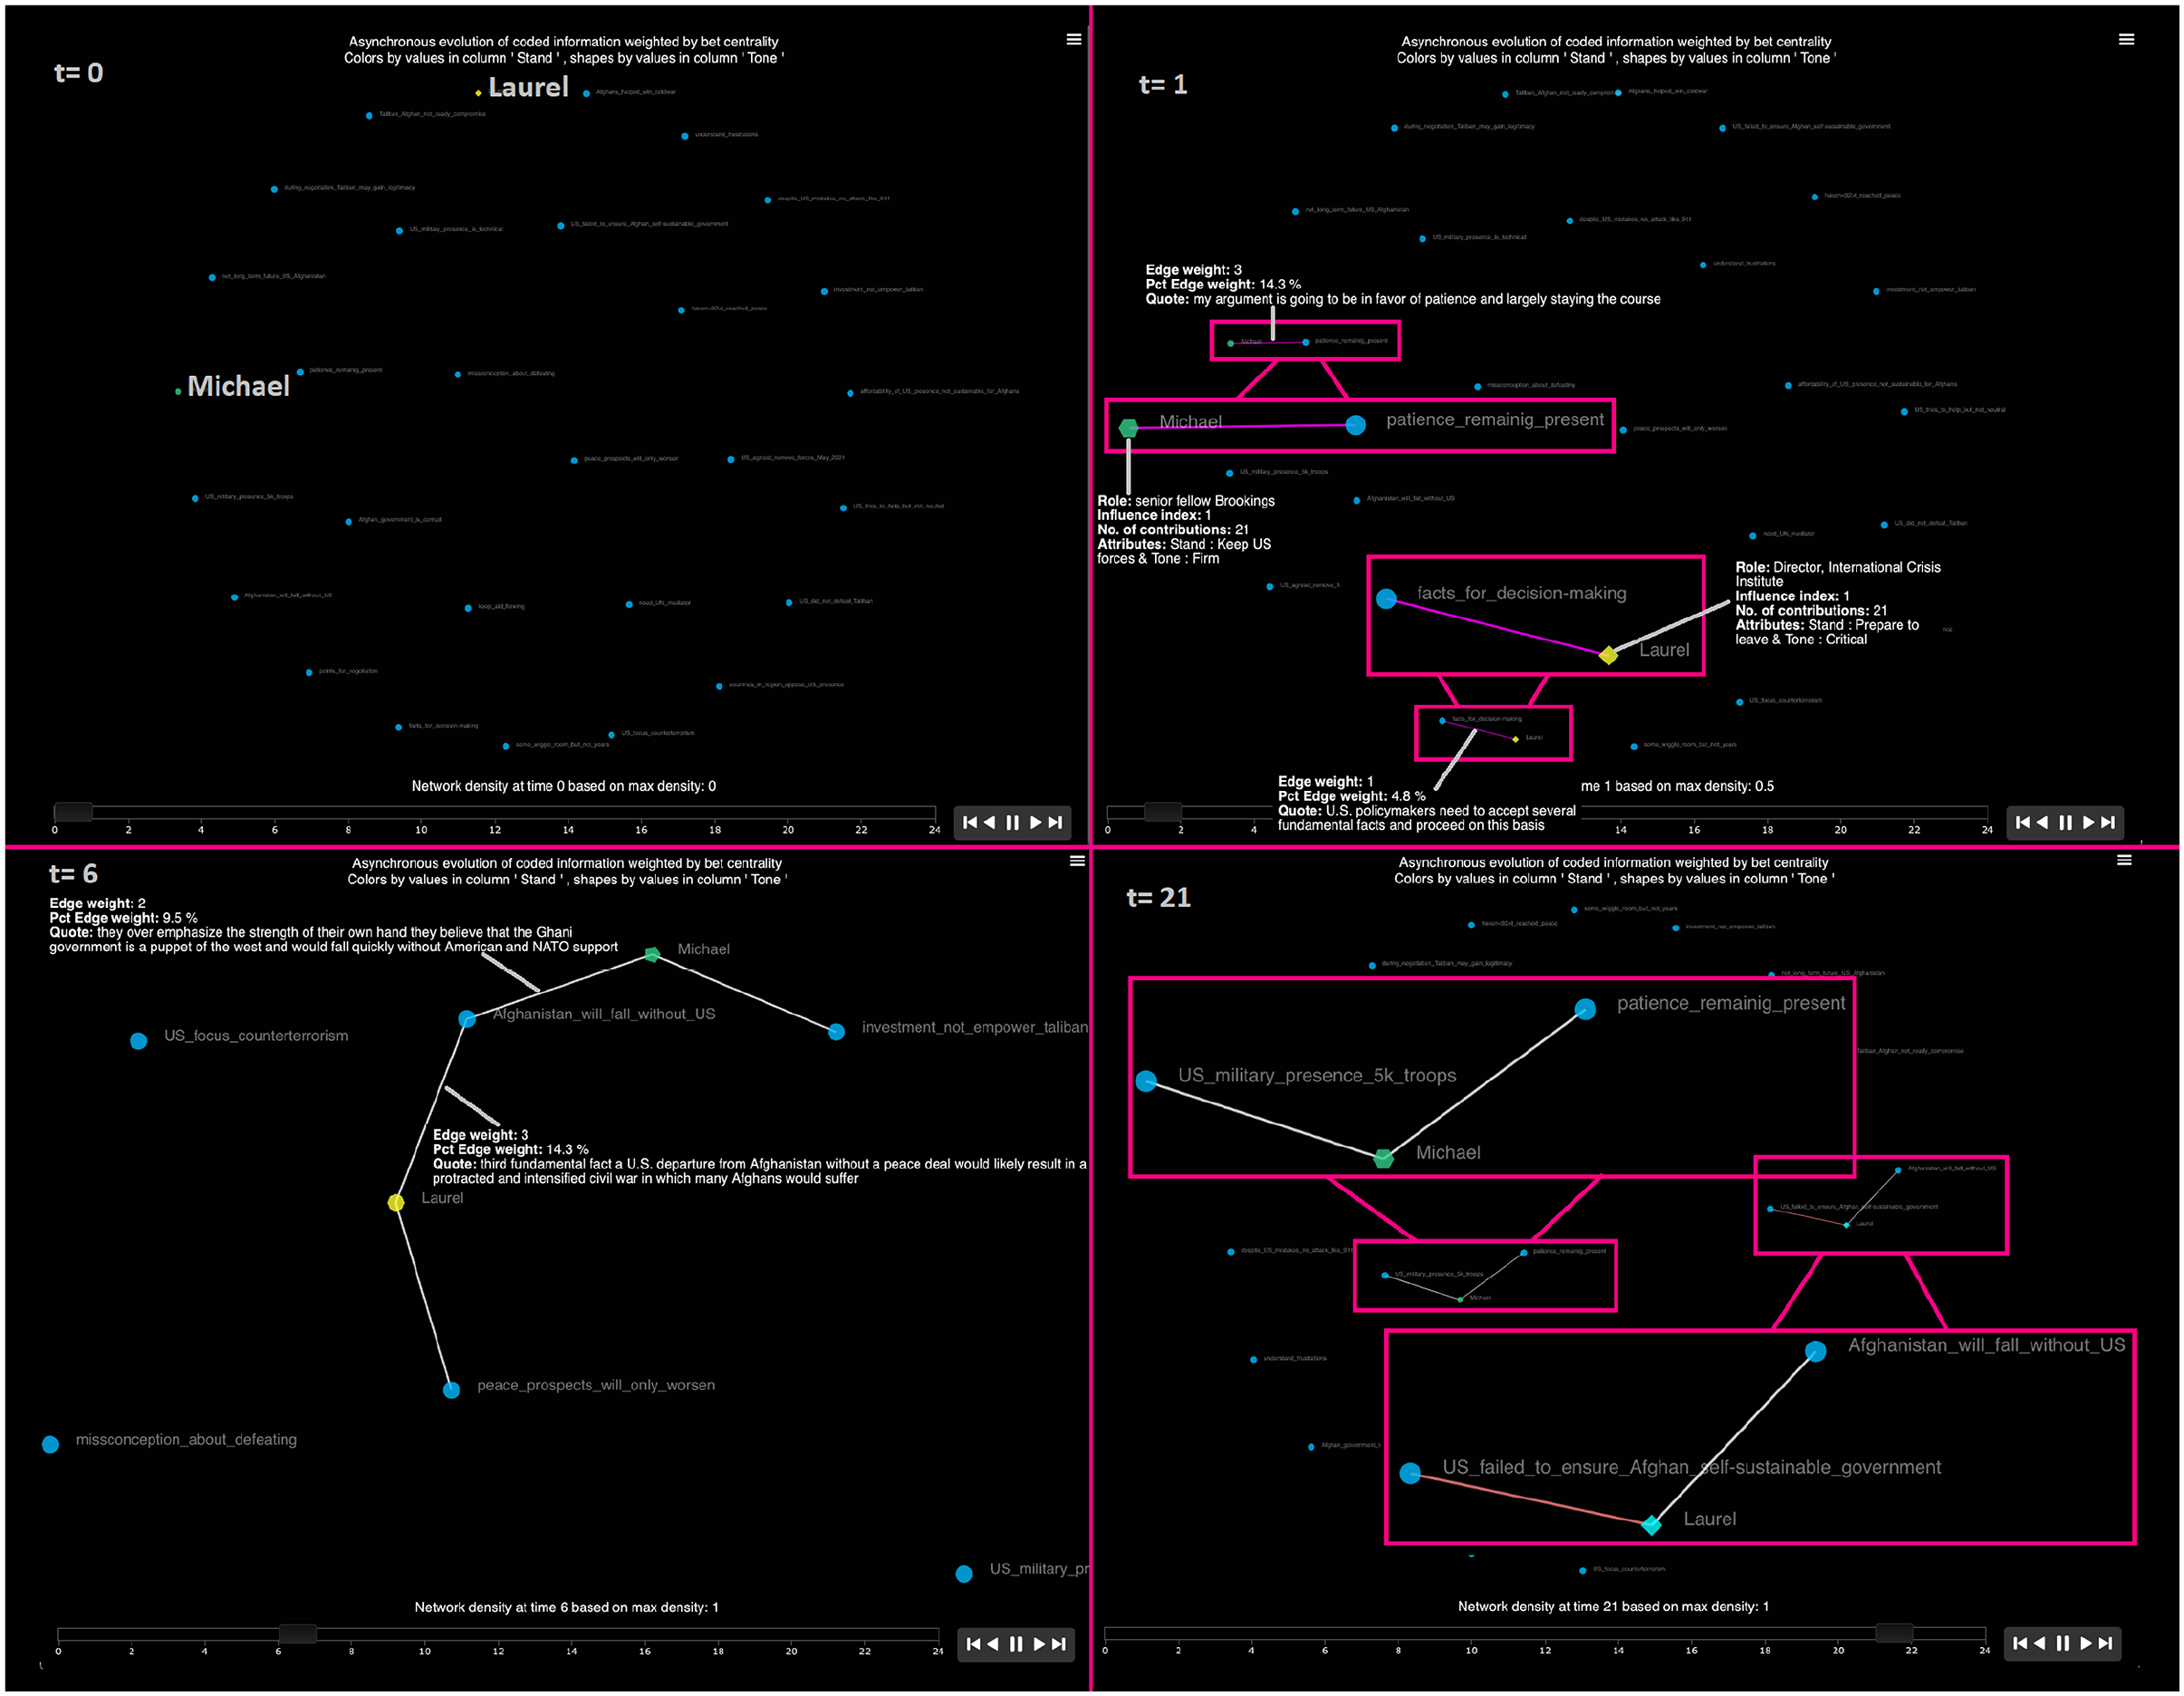
Temporal dynamic output
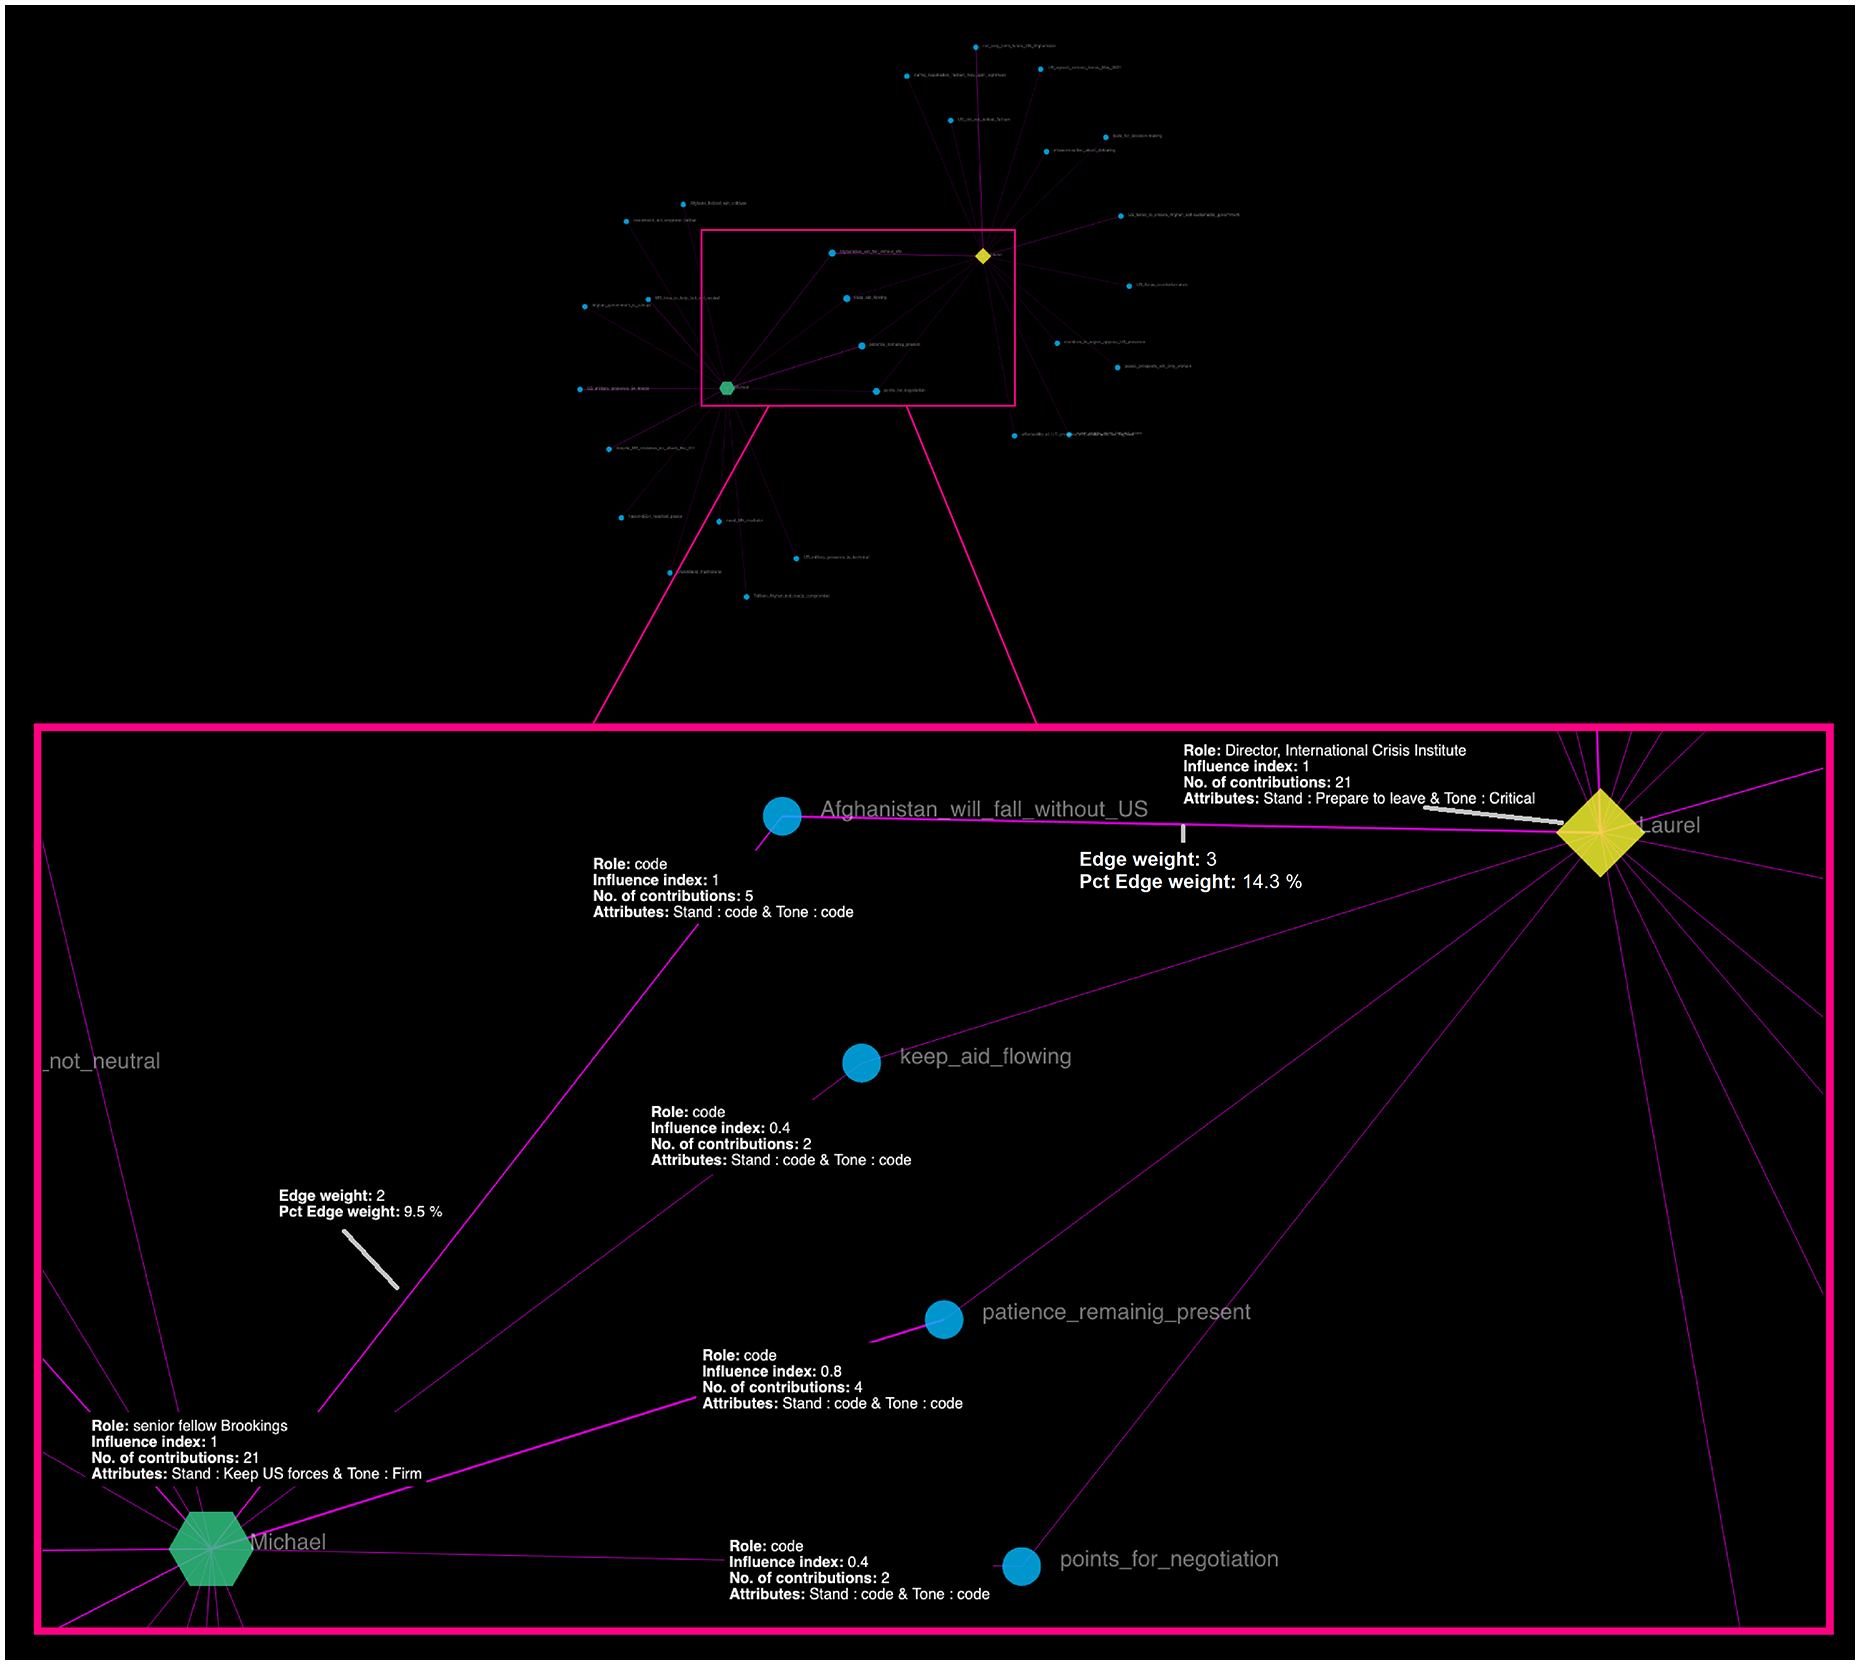
This output is shown in Figure 4. MOVIE offers storytelling and transparency properties that are difficult to capture with snapshots. This is why we invite the reader to interact first-hand with the HTML version of the dynamic MOVIE output here https://democratizing-data-science.github.io/MOVIE/Debate_temporal_dynamic_analyses.html. Once more, recall that these contributions happened asynchronously. At time zero, MOVIE presents all codes that may potentially be connected with participants (which adheres to the notion of complex systems and potentially interactive units discussed above). When users press the farthest right bottom ( ), the visualization will advance one point in time and this network will now show the connections realized at time 1 (see Figure 4). In this case, the first contribution made by Laurel and Michael were “factcs_for_decision_making” and “patience_remaining_present,” respectively. As stated before, when clicking on the line, or each of the codes, there will be dialog boxes that provide more context to each of these elements. For example, in the case of the first coded contribution made by Laurel, we can access the content of this code as well as how relevant this code was during her entire discourse. In this case, she just contributed text coded under this label once with the quote stating that “U.S. policymakers need to accept several fundamental facts and proceed on this basis.” In the case of Michael, his first contribution was repeated twice more during his discourse and the first quote stated, “my argument is going to be in favor of patience and largely staying the course.”
Although the depiction of clusters of information or hot zones (Alexander et al., 2019) is more visually appealing with more participants, we can still demonstrate this property with our case study. Fast-forwarding these connections until time 6 (see Figure 4), we have the first instance when the contributions of Laurel and Michael converged and formed a connected network via their shared concerns about the vulnerability of the Afghan state. They both asynchronously mentioned that “Afghanistan_will_fall_without_US.” The analytic power of MOVIE is depicted by allowing an easy retrieval of the meaning of this code for each of these experts, along with a measure of how important this social category was for their discourses. In the case of Laurel, for example, she fundamentally described the situation that actually happened when the United States left Afghanistan a year after her participation in this debate (August, 2021). She said, “. . . a U.S. departure from Afghanistan without a peace deal would likely result in a protracted and intensified civil war in which many Afghans would suffer.” In the case of Michael, he was referring to how the Taliban saw the Afghan government and in addition to the role played by the US referred to the important of the North Atlantic Treaty Organization (NATO). As described in the time-aggregated version in Figure 3, the summarizing properties of that system’s depiction already allowed us to see that at the end of their presentations, both experts considered that “Afghanistan_will_fall_without_US.” The contribution of this dynamic version shown in Figure 4, is that it further allows us to observe when the first instance of this concern was asynchronously shared, therefore enhancing our time-based and content-based contextualizations of these dynamic contributions. Although, a complete analysis would require more detailed descriptions of the evolution of these events, for now, let us just depict the closing state of this system at time 21. In this final instance, Laurel mentioned again that the Afghan state will likely fall without the United States, and also remarked that the United States failed to ensure that Afghanistan became a self-sustainable state. This means that while during most of her speech, Laurel mentioned the need to prepare to leave, she closed with a stand to need to remain present. In the case of Michael, while he did not provide as direct conclusions as Laurel, he also mentioned the need to maintain military presence and being patient, despite knowing that the United States presence in that country remains controversial. In conclusion, despite these experts’ stands and recommendations, by now we all know the result to this political and policy decision that took place in August 2021.
Synchronous
analyses (conflict resolution)
Time aggregated output
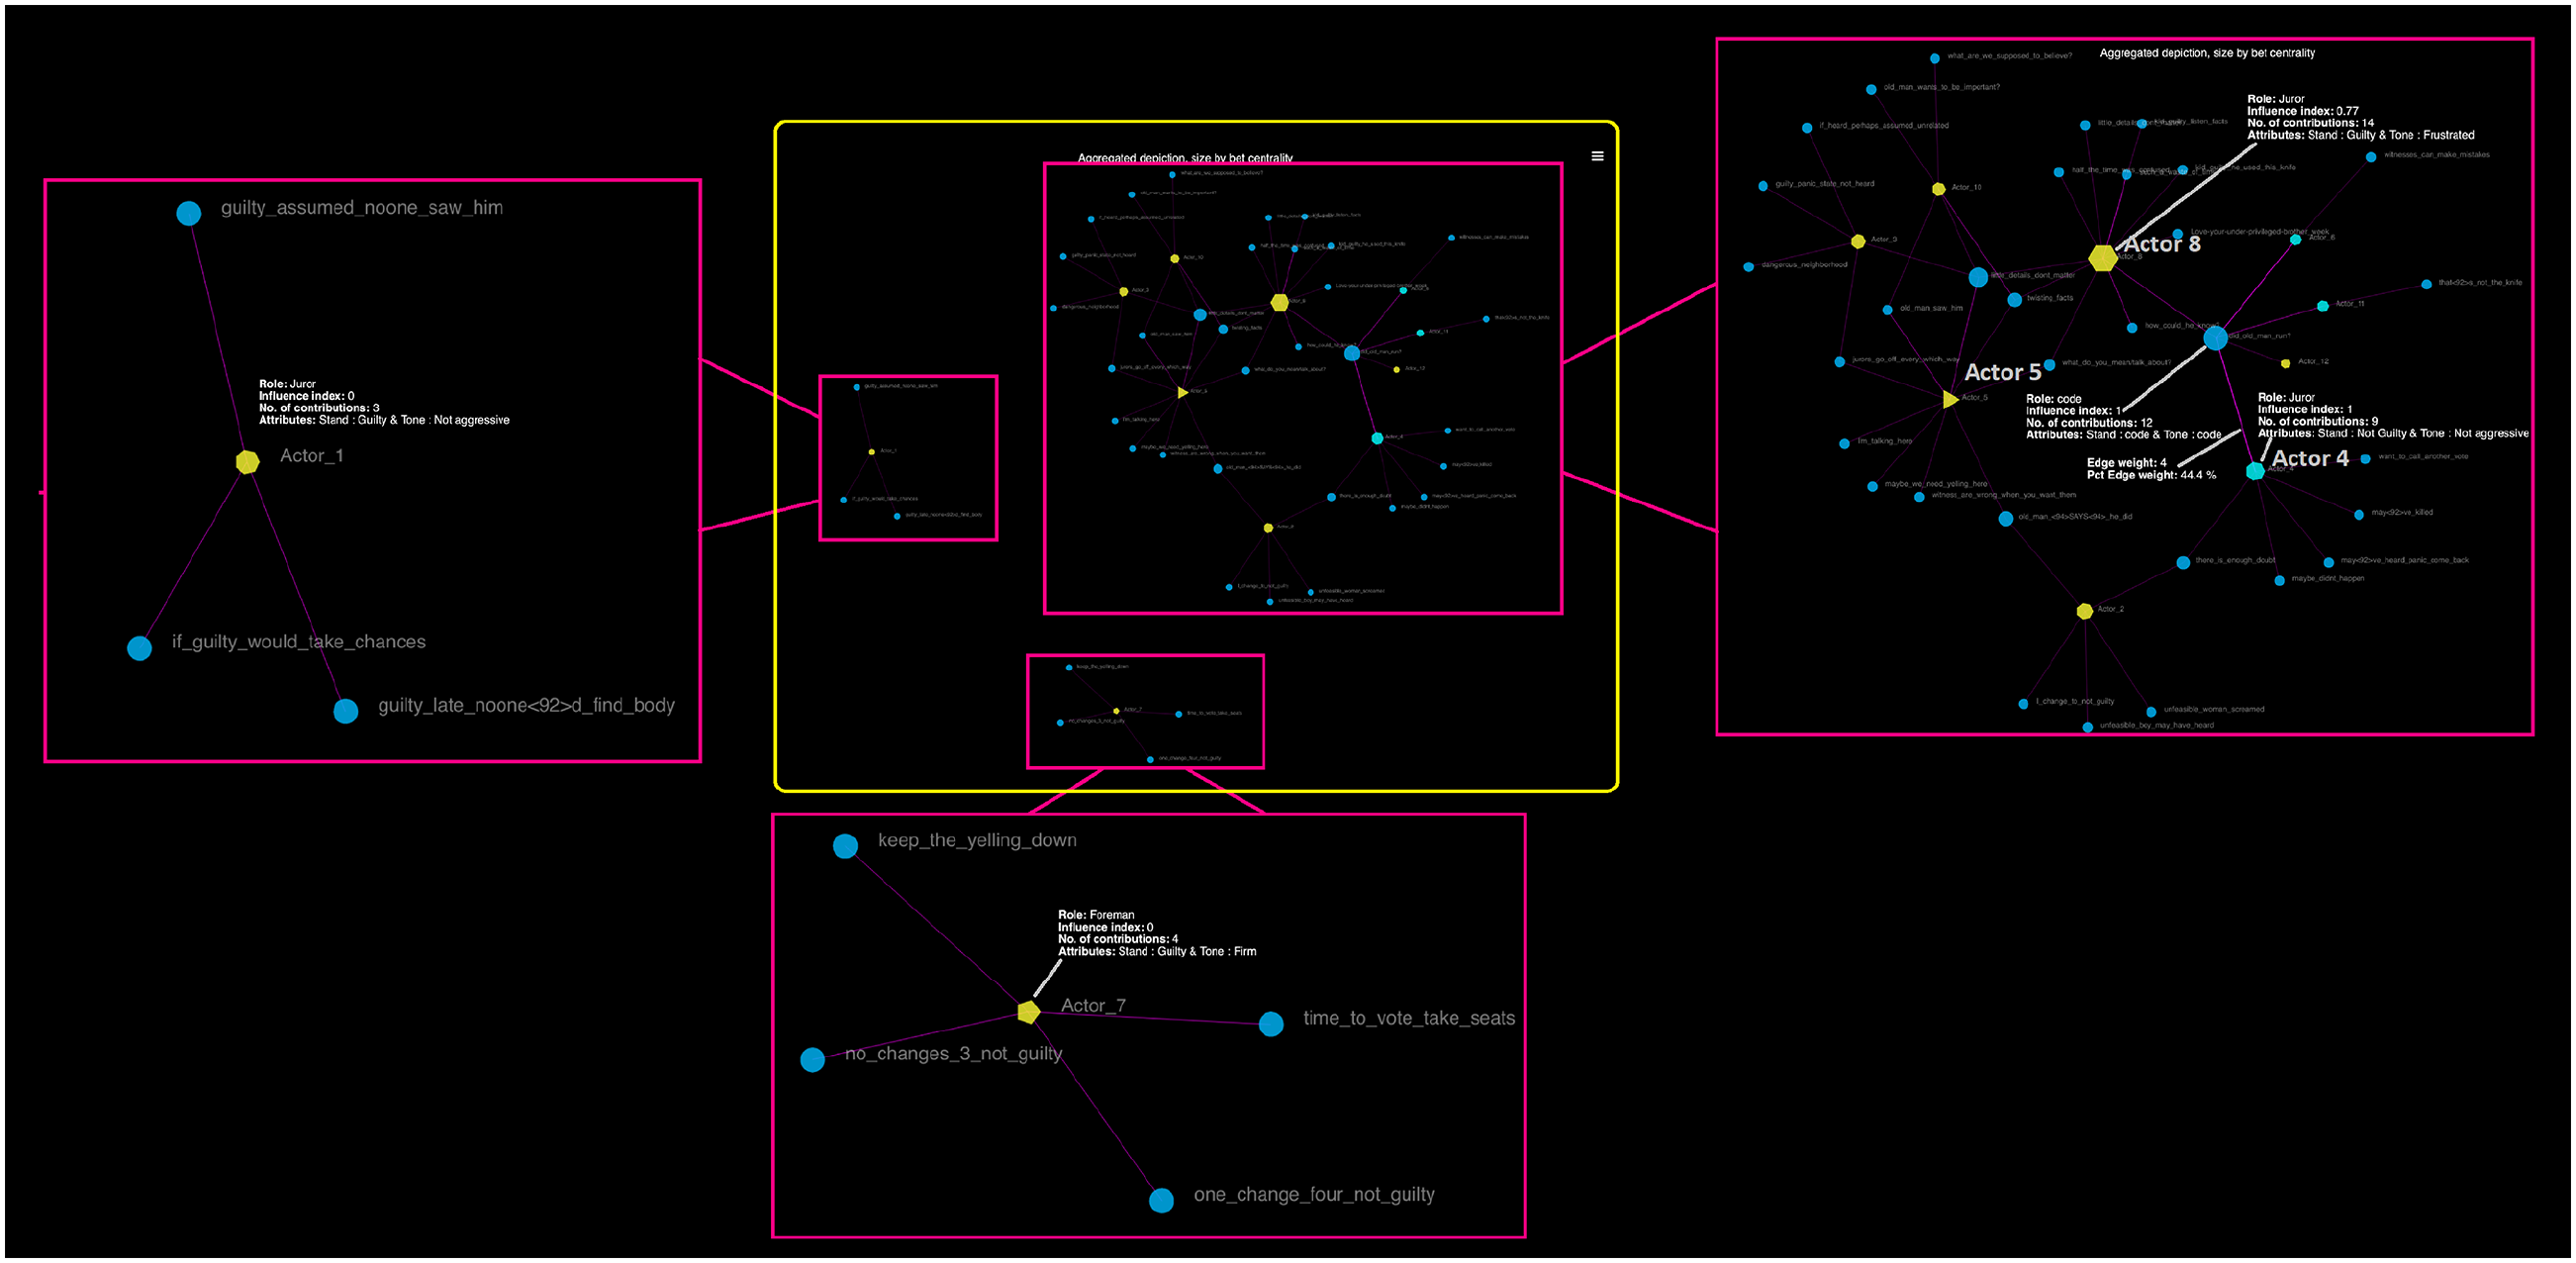
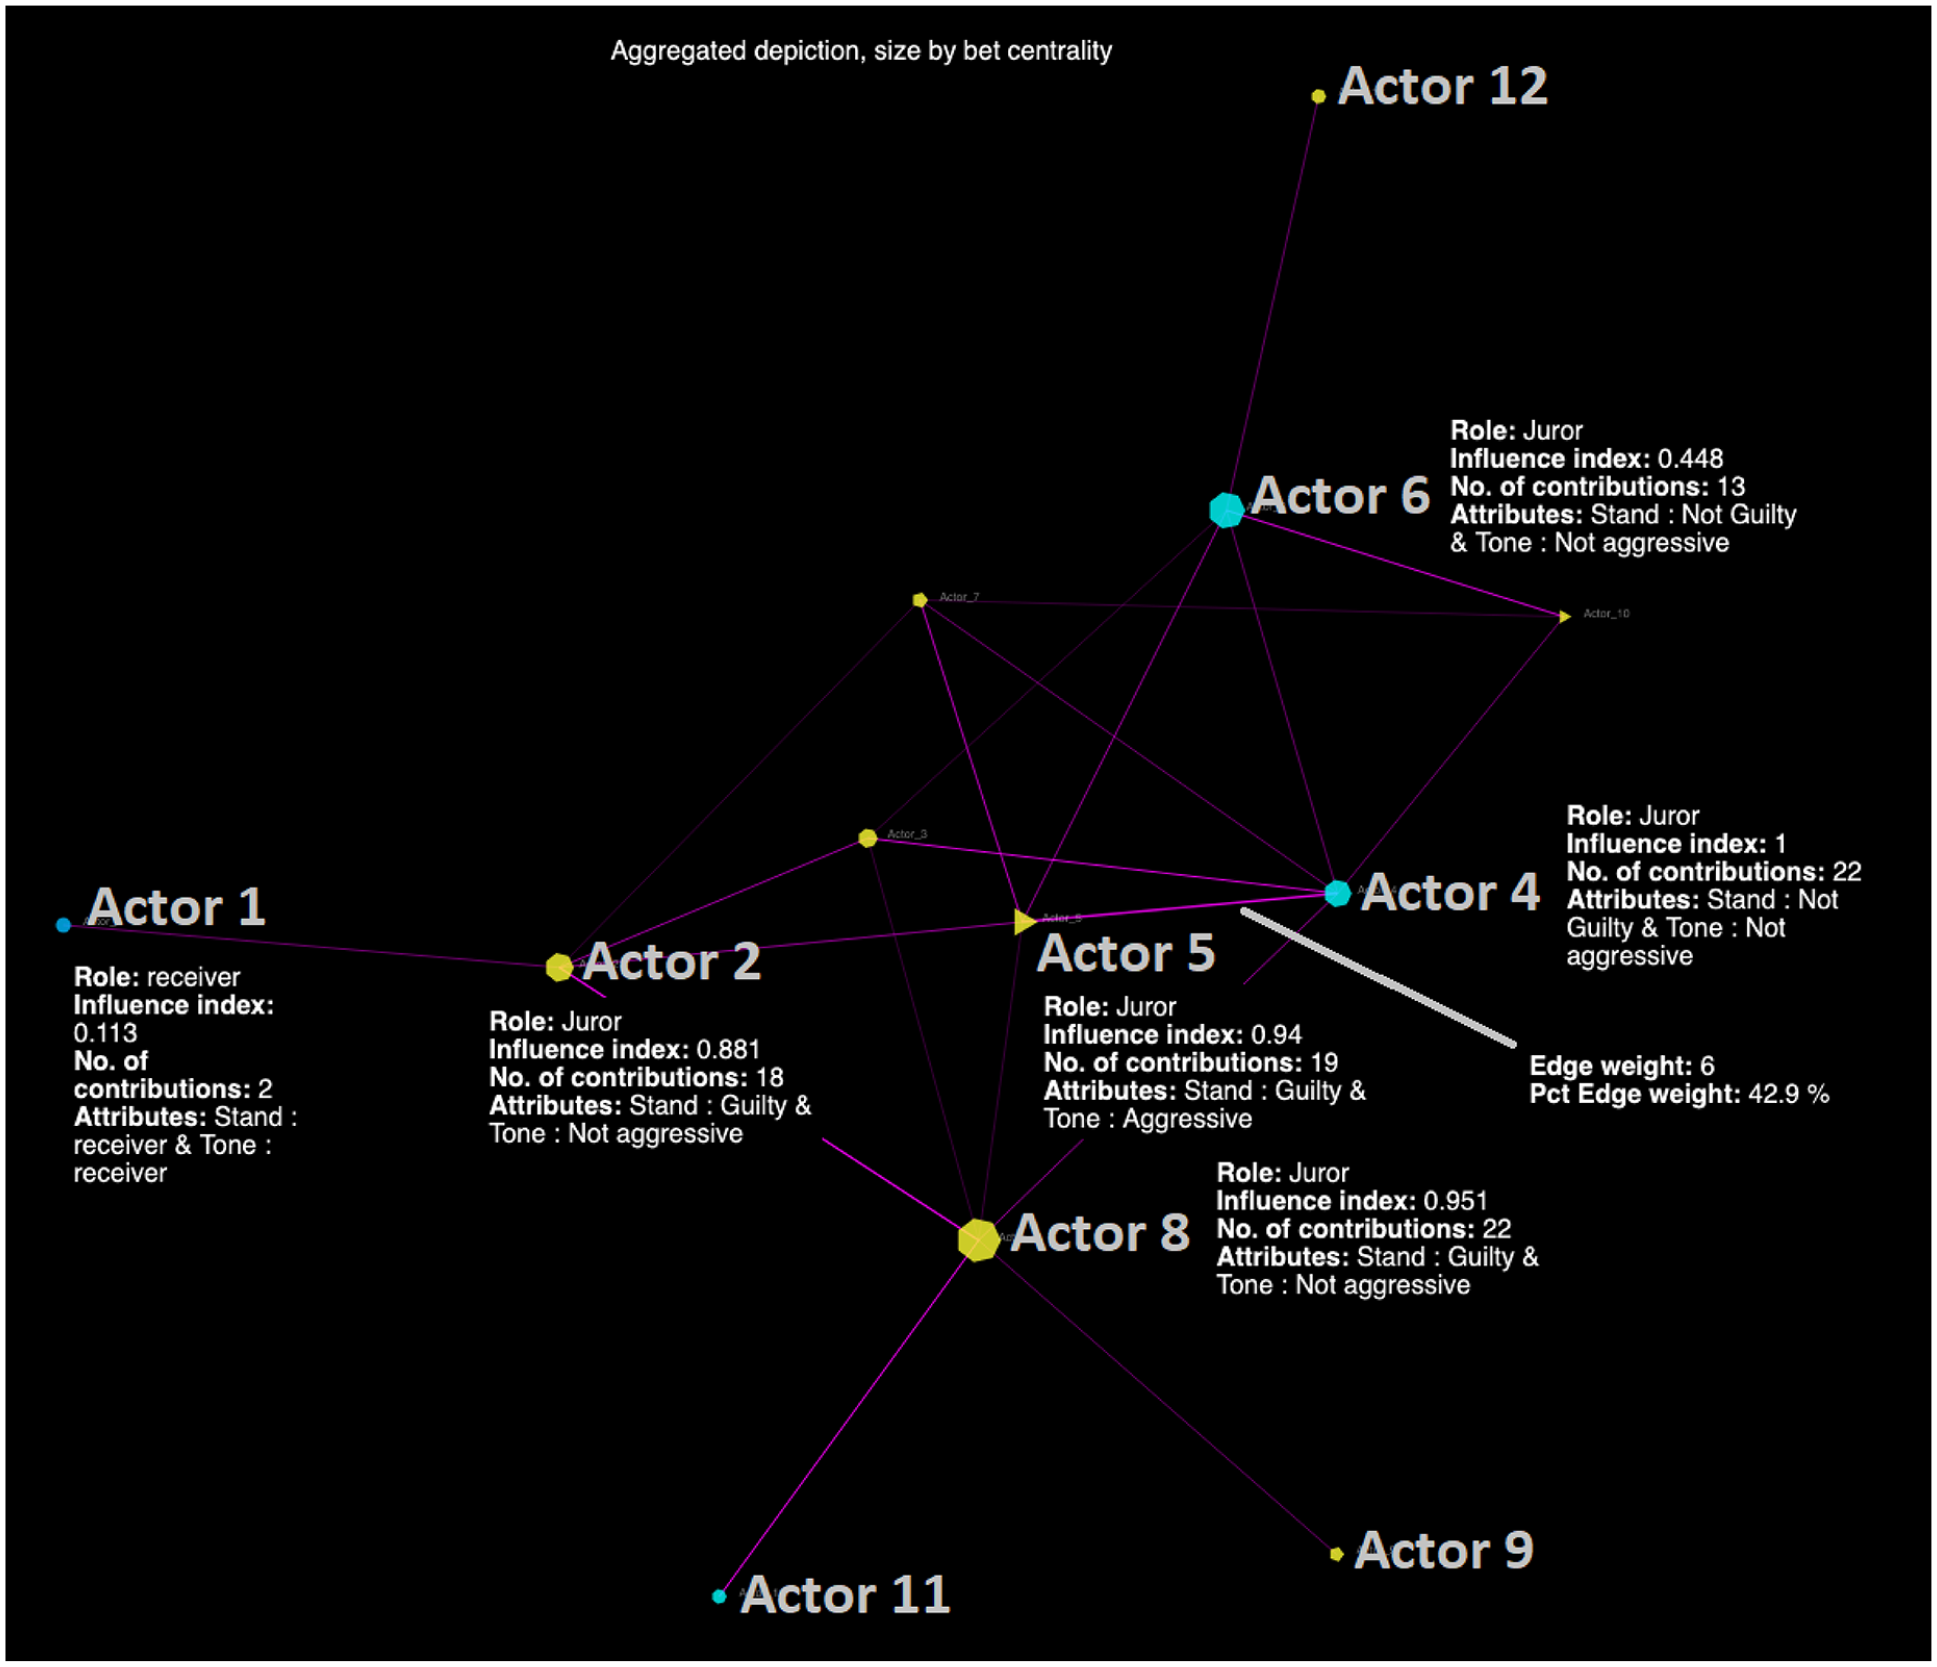
This output is shown in Figure 5. The HTML version can be accessed at https://democratizing-data-science.github.io/MOVIE/time-aggregated_12-angry-actor-code.html. The resulting time-aggregated depiction indicates that this system (inside the yellow square) is configured by three sub-systems, wherein two participants were disconnected from the major system (network containing 10 of the remaining jurors) as a function of having provided at least one contribution that was shared by other jurors. This indicates that none of the contributions shared by Actors 1 and 7 were shared in the network, hence the peripheral or disconnected status of these two actors. In terms of betweenness centrality, note that Actors 8 and 5 were the most central human actors, meaning that they served as bridges connecting the flow of information or discussion in this social setting. Nonetheless, neither of these two actors had the highest eigenvector centrality value. The actor with this highest value was Actor 4, which is explained by his direct connection with the single most influential code (with a value of 1 in the influence index) and with the highest connecting power (betweenness centrality as indicated by its size) of this movie scene: “did_old_man_run?” This latter code was mentioned 12 times in this system and Actor 4 himself mentioned this code four times out of his nine contributions (or 44% of his contributions).
Time-aggregated synchronous debate output (actor to code).
A particularly powerful code that during the analysis kept drawing our attention was provided by Actor 8. At some point he stood up in anger and desperation mentioning “what is this ‘love-your underprivileged-brother-week?’” As avid readers of qualitative research, we have always wonder about how researchers use a quote or code to title their studies. In the absence of MOVIE as an analytic tool, we would have likely selected this code to describe the social circumstances of this scene given its sociological strength. However, if the goal is to help the reader observe the most crucial aspect of the issue under study, the title of this study, at least pertaining to the video analyzed should be related to “did_old_man_run?” The debate and pivotal trend of thought that this code captures was the single most important factor that made the angriest and perhaps “informally” the most influential juror, realize that he, and everyone else, should not trust the testimony of the “old man.”
Once more note that, although the time-aggregated visualization that MOVIE rendered is useful in providing a summary of the state of the system, this level of understanding and analysis loses more nuanced details that may help strengthen our grasp of processes and reasons.
Temporal dynamic output
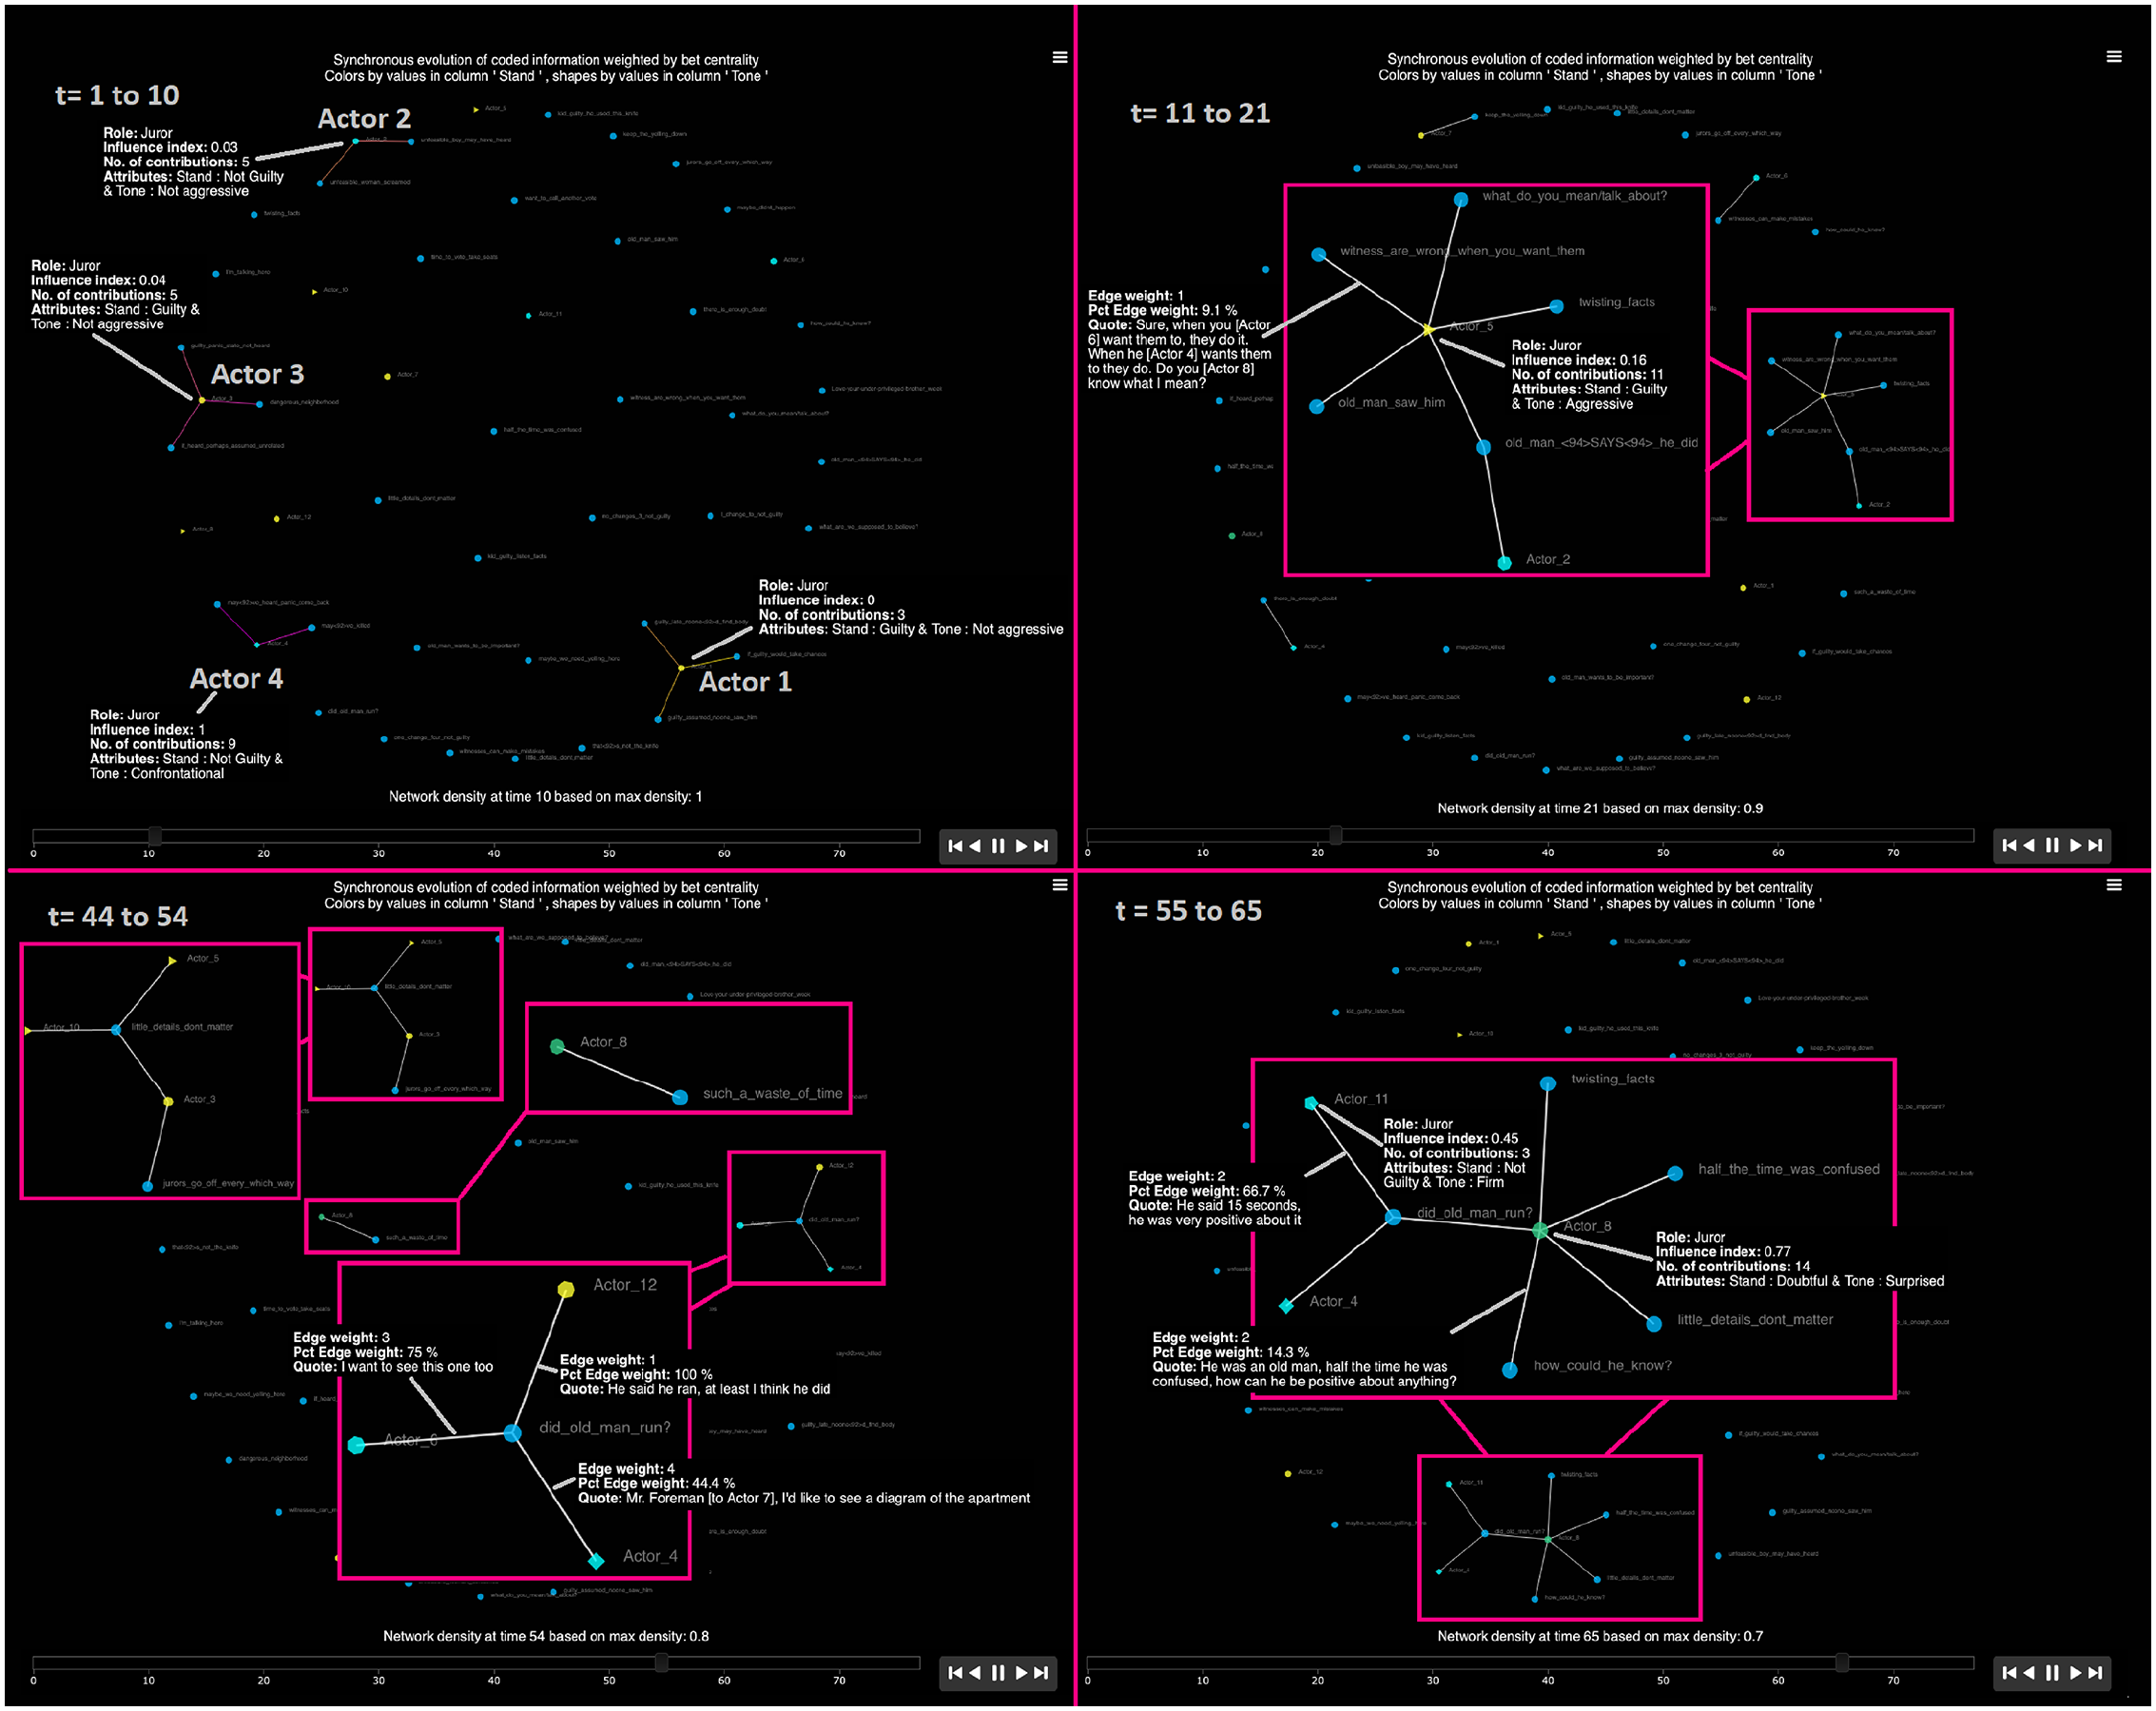
Figure 6 presents the temporal dynamic analysis of the evolution of these contributions. Different from the asynchronous analyses, wherein all first contributions are plotted simultaneously, in the synchronous analysis, the contributions are presented one at the time following their actual temporal evolution, as observed in the group interactions. Given that the system analyzed is not configured by many actors, instead of plotting only the two most recent contributions, as in the case of the asynchronous example, in this depiction we selected to plot instead the 10 most recent contributions. This is achieved by shifting the slider provided in the MOVIE’s user interface by clicking in the number desired or grabbing the handle and moving it to from 2 (default value) to 10 (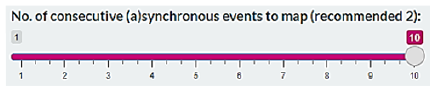 ). Once more, we invite readers to interact with this HTML output here https://democratizing-data-science.github.io/MOVIE/time-evolution_12-angry-actor-code.html.
Dynamic temporal synchronous debate output (actor to code).
Due to space limitations, the analysis of Figure 6 focuses on depicting the most active players in 40 of the 65 recorded contributions as shown in the transcript (see https://cutt.ly/ZWlGlBy). During the first 10 events, there were four contributing jurors, Actors 1, 2, 3, and 4. As indicated in the aggregated analyses, for Actor 1 these were his only contributions and no other juror provided information coded under these labels. Actor 4, on the other hand, became the most influential player in this social setting. The subsequent 10 interactions (times 11–21) were “dominated” by Actor 5, and it was during this time period that the moderator of the Jurors (Actor 7) had to ask Actor 5 to “keep the yelling down.”
It was during the 44–54 time points, where the question that eventually changed the course of action at the system level emerged, “did the old man run?” Once more, when interacting with the HTML file we can retrieve the actual content of this code. For Actor 6 the first content of this code was the realization that it was not quite feasible for the old person to actually run. Eventually, Actor 6 had three contributions coded under this label, representing 75% of his total inputs. For Actor 12, his only contribution was coded under this category and consisted of sharing that “He (the old man) said he ran, at least I think he did.” Both contributions prompted Actor 4 to request to see more information about the apartment layout to assess the feasibility of having ran (in 15 seconds).
In the closing part of this depiction (time 55–65), we can see that Actor 8, an enthusiastic proponent of finding the accused guilty of murder, dominated the discussion. His interventions were focused on convincing the other jurors that “little details do not matter” and inadvertently ended up realizing that the main witness was “confused half the time.”
Synchronous
analyses (conflict resolution)
Time aggregated output
The time aggregated depiction of actor-to-actor interactions is shown in Figure 7. Recall that this analysis is relevant when researchers are interested in learning the evolution of communication exchanges in the system. Once more, the HTML version is available here https://democratizing-data-science.github.io/MOVIE/time-aggregated_12-angry-actor-actor.html. The shape of actors is based on their tone attribute described above. The color indicates their stand, and the size is based on their betweenness centrality. As in both previous examples (see Figures 3 and 5), these attributes are based on the first instances observed in the system. Specifically, Figure 7 shows that Actor 8 had a not aggressive tone in his first intervention, but the dynamic analysis presented next will reflect that all but one of his remaining interventions had an aggressive tone. This summary also shows that Actor 1 is the only actor who did not send any message (his contributions shown in Figure 5 were not directed at anyone in particular as shown in the videoclip https://youtu.be/HK7CfffM1OQ?t=2), but merely served as the receiver of two messages, from Actor 2 in this case. This explains Actor’s 1 stand, role, and tone as receiver in this analysis.
Time-aggregated synchronous debate output (actor to actor).
Note that, although these connections come from the same transcript of the movie scene analyzed above, the emphasis in the detection of interactions and communication exchange is placed on who was the target or sender of a message in the system. This new emphasis means that the coded pieces of information presented here may not necessarily match those discussed in the
Temporal dynamic output
Before presenting the temporal dynamic output of the evolution of these communication exchanges in Figure 9, let us discuss an important analytic decision with clear visualization implications.
This decision may be observed when studying the transcript and coding schemes provided in this Word file https://cutt.ly/2WlGbNt. Note that the video analyzed allows to clearly observe that when a juror directed a message, this message in some instances was directed specifically to one juror and in other instances to more than one juror—one at the beginning of the dialog and to another at some point during the same uninterrupted dialog. To illustrate this point see Example A in Figure 8. The analytic decision here was that instead of taking the entire dialog as a single message sent to Actor 2 by Actor 3, this message was decomposed into the three main components that we, as coders and analysts may consider relevant to be analyzed. The visualization implication is that for this dialog there were three messages sent from Actor 3 to Actor 2 instead of one aggregated message. As usual, each link will contain the specific message subset. Given that the quote would be displayed in the resulting output, coders who prefer to take this entire dialog as a single whole message being sent would not lose too much information, for readers may still see that the dialog contained more than one point or message—more on this below.
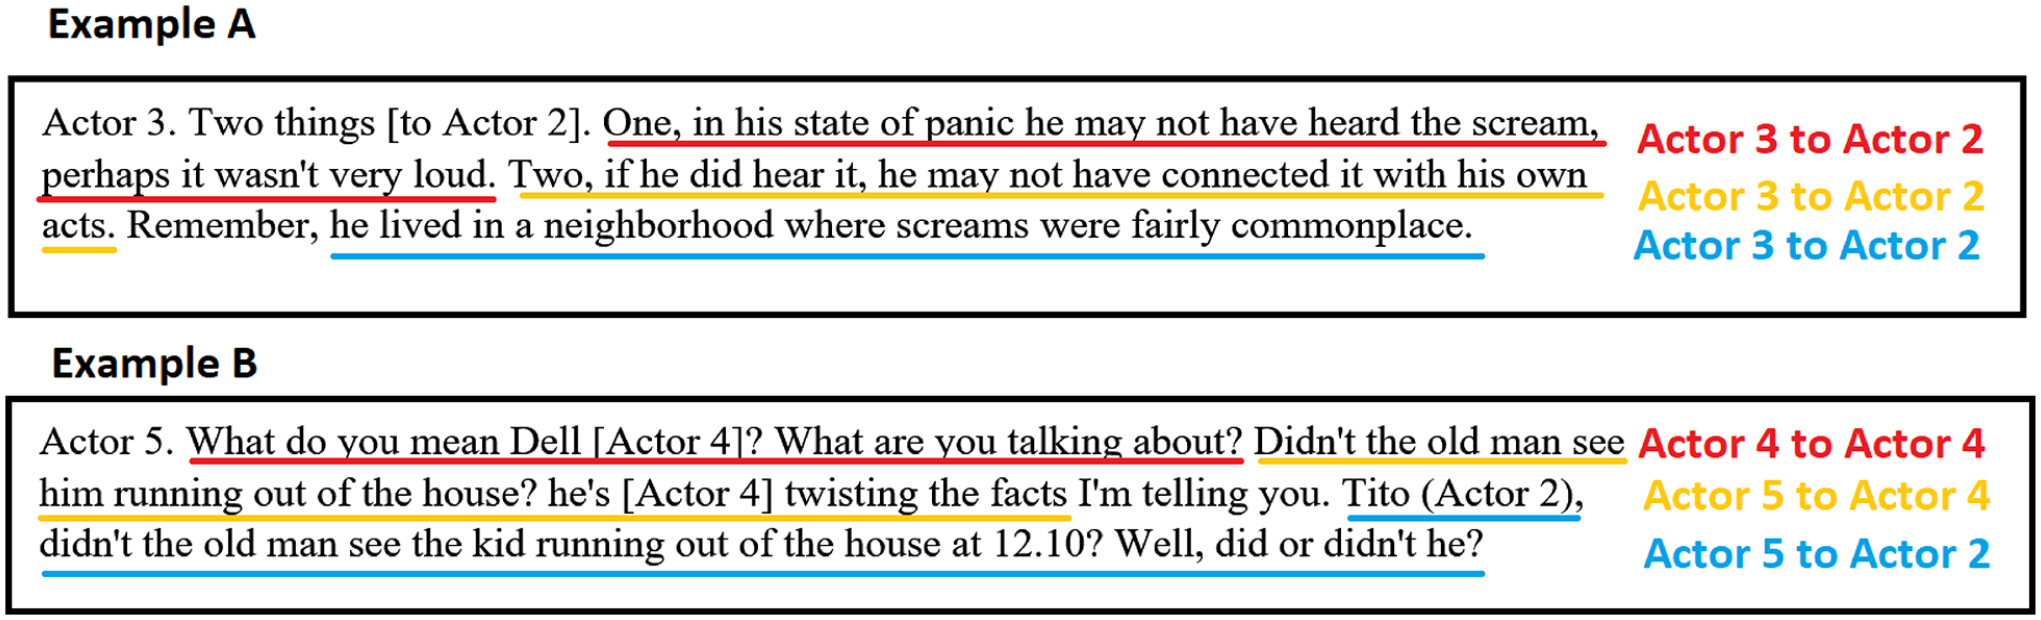
Depiction of level of aggregation when labeling, coding, or social categorizing.
Example B in Figure 8 is similar in that the dialog opens with Actor 5 rebutting assertions made by Actor 4. The first two messages in this dialog are directed to Actor 4 (which once more could have been aggregated as one), whereas the last message was directed to Actor 2. Accordingly, in this dialog this disaggregation was necessary to convey the change of recipient in this communication exchange. In sum, this Example B in Figure 8, could have been coded in two links, instead of three. There is no rule of thumb regarding this decision, but our preference is to have more disaggregated analyses to enhance transparency and clarity in the content of communication exchanges. The more disaggregated the message exchanges are, the more opportunities for our centrality measures will be to trace patterns in these complex systems. That is, although clearly Actor 3 delivered three important pieces of information to Actor 2 in Example A, we would have not captured these complexities with an aggregated depiction of this communication exchange and the resulting level of influence captured by centrality measures would have been different.
The dynamic temporal output of these communication exchanges are represented in Figure 9. The HTML version can be accessed here https://democratizing-data-science.github.io/MOVIE/temporal-dynamic_12-angry-actor-actor.html. Similar to our previous analysis presented in Figure 6, we present the 10 most recent communication exchanges per snapshot. Our first depiction accounts for times 1–10 and reflects that during this time period, Actors 2 and 3 where the highest connectors or bridges of information. During the time periods 11–21, clearly Actor 5 became the most important broker of information exchanges. This is the time period when he was asked to stop yelling since he got very agitated, and his tone is aggressive (see triangle shape and information box). The next snapshot accounts for time points 46–56. In this case, Actor 6 became the most important bridge communicating and facilitating the flow of information, this is the point in the exchange of ideas where the single most important question emerged (“did_old_man_run?”). Note that MOVIE allows the retrieval of multiple communication exchanges represented in a single link. That is, Actor 12 told Actor 6 “He said he ran, at least I think he did” to which Actor 6 replied, “Well, I don’t remember what he said, but I don’t see how he could have run to the door.” To retrieve the message sent by an actor when there is actual exchanges, just click on the link the closest to the actor of interest as possible. That is, for the Actor 6 message, the click should be closer to this actor than to Actor 12.
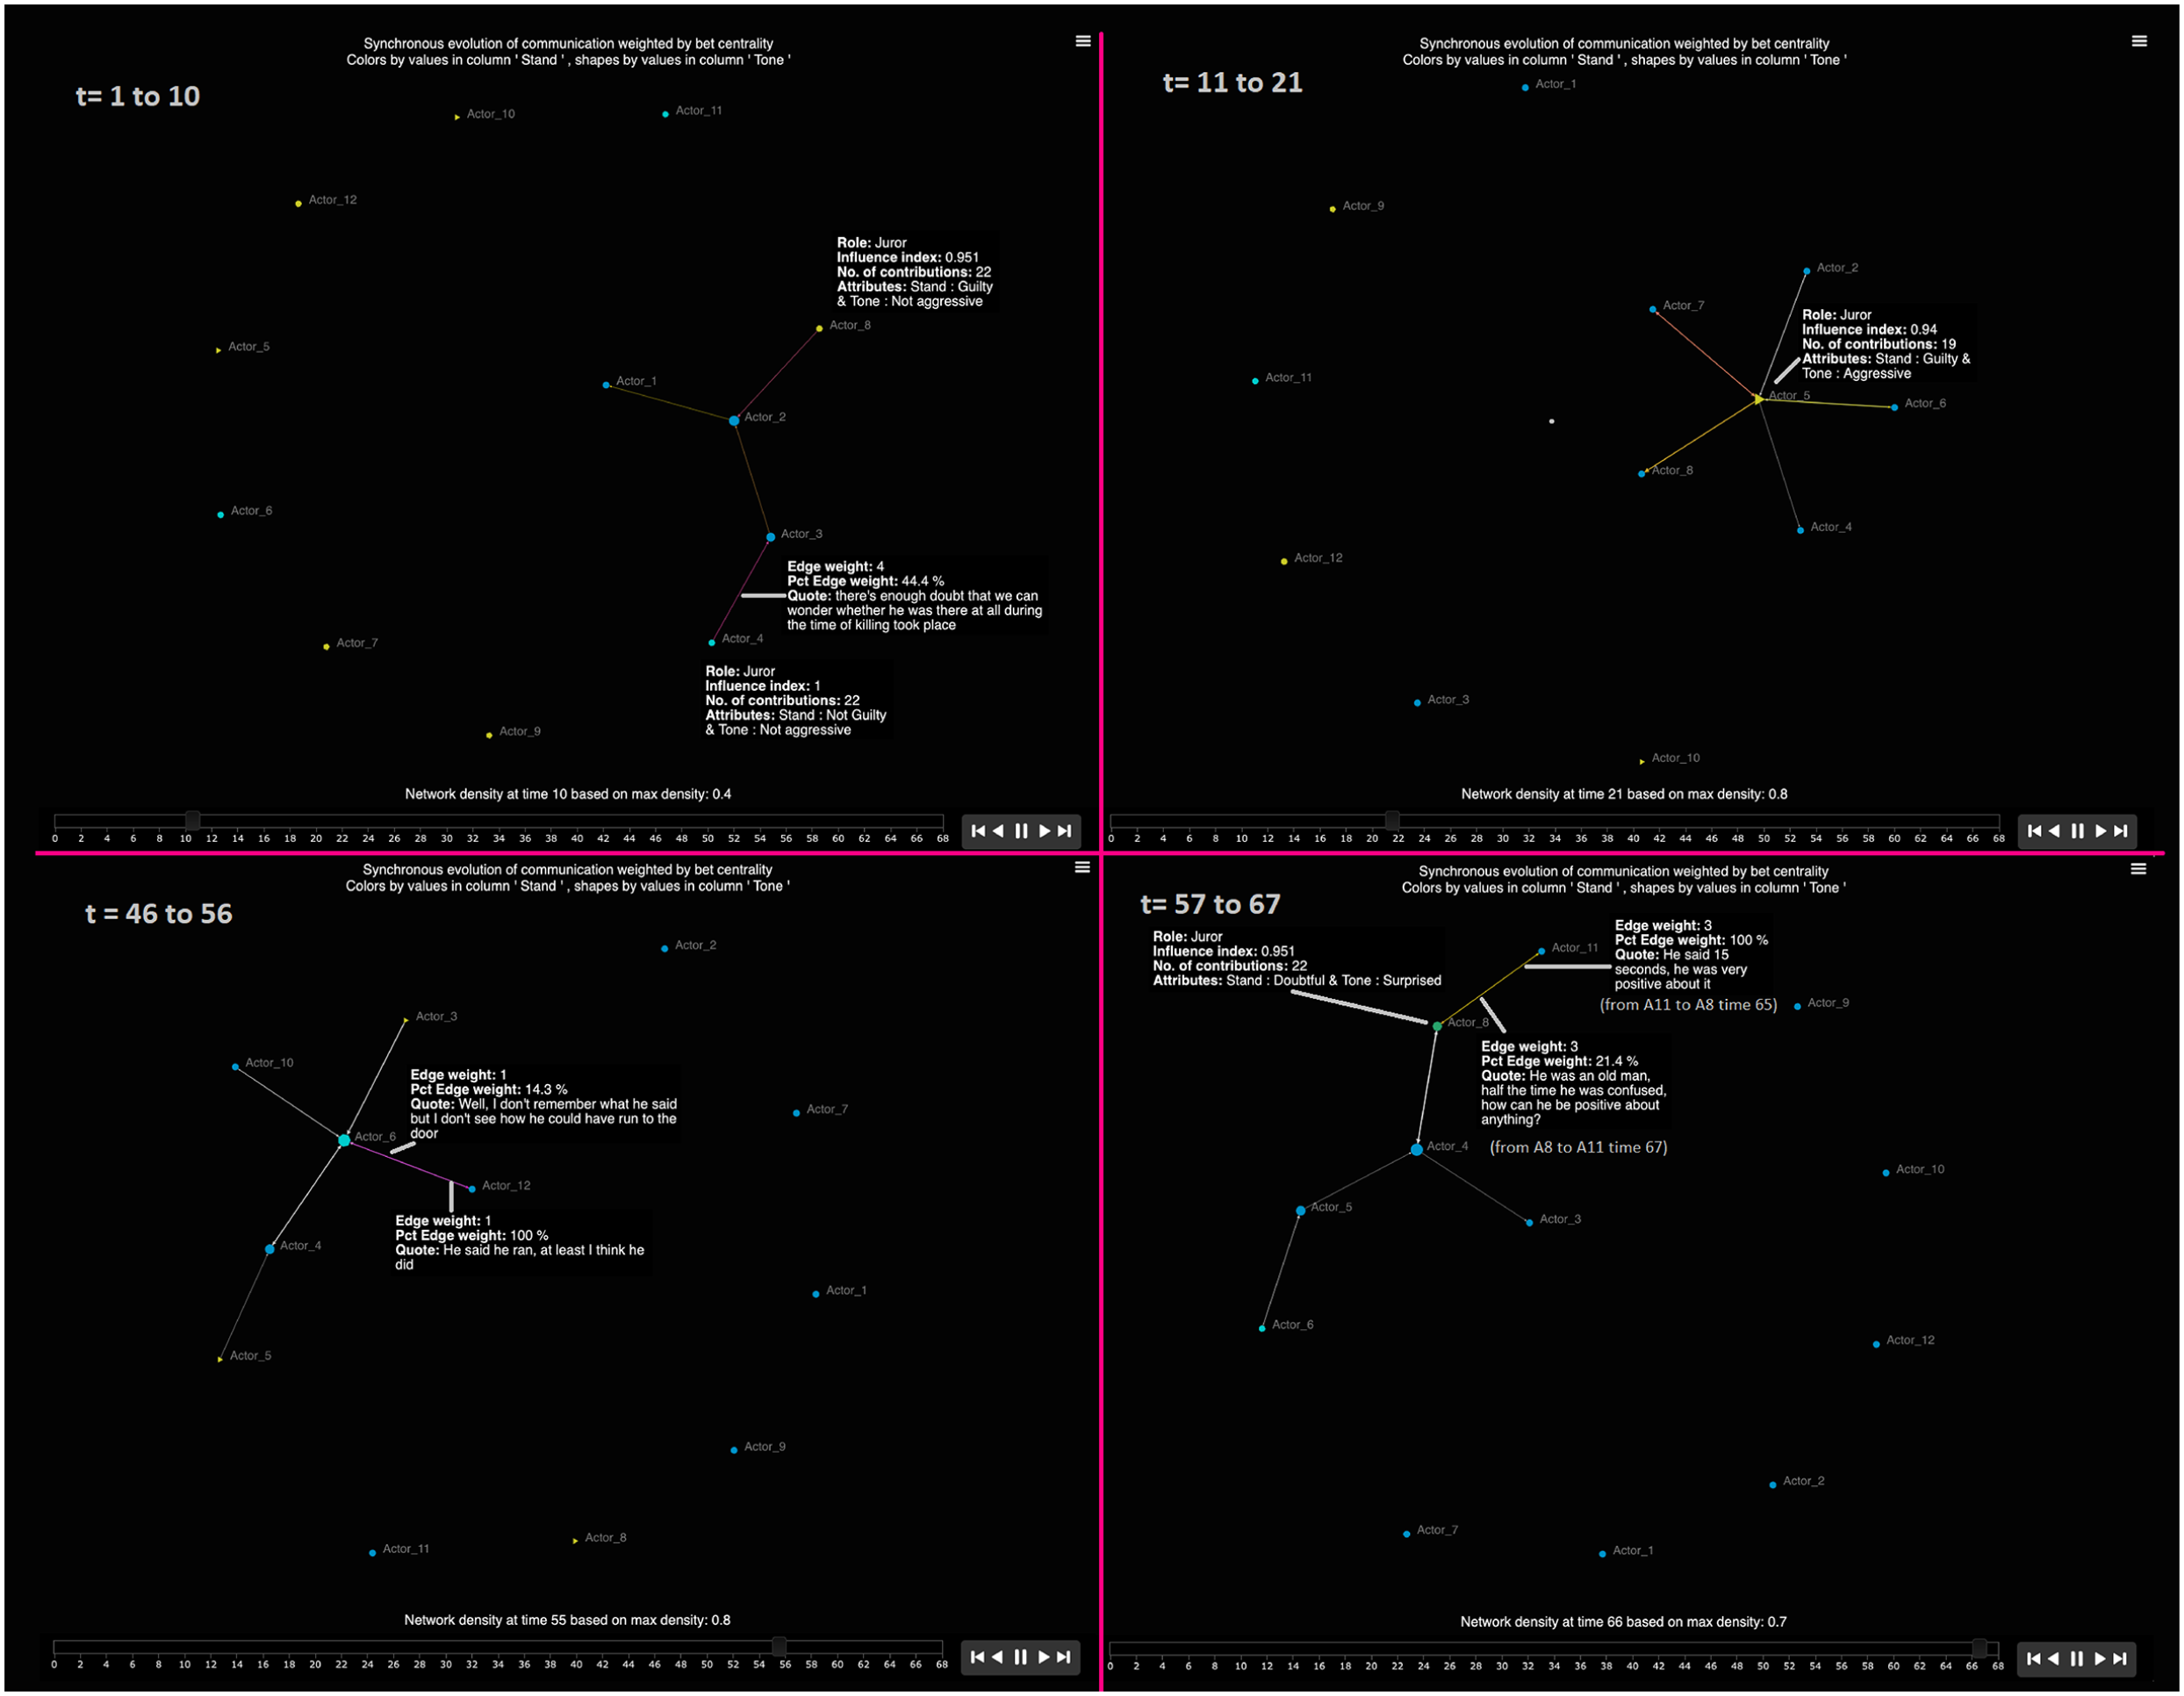
Dynamic temporal synchronous debate output (actor to actor).
Finally, we present time points 57–67. In this depiction, Actor 4 has the highest betweenness centrality (brokerage) role, followed by Actor 8. The dynamic representation of MOVIE, which allowed the dynamic retrieval of betweenness centrality offers a more nuanced understanding of this measure. That is, recall that in Figure 7, Actor 4 did not reach the highest value in betweenness as captured by the time-aggregated analyses; however, throughout these evolution of message exchanges, and as a matter of fact, during the most crucial moment from a verdict-change standpoint, Actor 4 held the most impactful broker role—as highlighted by its size in the network. It is in the last interaction, when Actor 8 realized he could not trust the testimony of the “old man” as reflected by his message “He was an old man, half the time he was confused, how can he be positive about anything?” which is reflected in his color and shape (doubtful and surprised, respectively).
Discussion, closing remarks, and software access
The decision to select publicly available videos as data sources to be analyzed in this paper was to offer readers all the tools and elements to critically assess the contributions and rigor that MOVIE brings as an innovative methodology to model complex processes in social settings. Providing transcripts, codes, and Microsoft Word tools to fully replicate the analyses, and hopefully even conduct new ones was a fundamental goal of this study. That is, it is likely that even with the same transcripts researchers may find slightly different results, however, it is unlikely, if not impossible that they find completely different or contradictory results to the ones depicted here. Recall that as described in our conceptual framework, MOVIE aligns with the notion of general complexity as presented by Byrne and Uprichard (2012) by presenting reliable and valid models that represent true social complex systems (Byrne and Uprichard, 2012). MOVIE aims to capture and produce sociologically useful and meaningful descriptions of social world events via “process tracing.” MOVIE then, makes the pursue of causality, or at the very least, of objectivity or full reproducibility of our shared understandings more feasible to attain and with this, the possibility of truly influencing policy planning and actions using rigorous qualitative evidence.
With regards to objectively capturing the complexity of a system, to the extent that readers who were able to watch the YouTube videos referenced in these examples, found our analyses “redundant,” when compared to these original videos, this would be a clear win for MOVIE. Recall that in actual research settings and papers, it is unlikely to share videos, likely for participants’ confidentiality protections. Accordingly, insofar as our depictions achieved with MOVIE were so accurate, that the tracing of the evolution of these interactions or contributions really resembled or mirrored the actual events taking place in those videos, the more powerful MOVIE’s impact may become in bringing clarity, transparency, and rigor to social science research, particularly in settings that require understandings of processes and reasons like in qualitative research and case studies.
Before closing, it is worth mentioning some of the overarching questions that can be asked in synchronous and asynchronous settings. Note that these questions are just general examples and researchers can employ this analytic framework to address their own substantive questions however they see them fit best with their projects.
Examples of questions that can be addressed with MOVIE in synchronous analyses are:
When considering the processes of information exchanges among participants and when there are groups moderators present in focus of working groups, Were meaningful exchanges of information driven primarily by experts or by moderators/interviewers? [if the latter were driving these exchanges this may be evidence of bias or overt influence of experts’ standings] How did this process evolve and when did it start to decay? What can the observance of this process mean in our meaning-building endeavor? What may be the most transcendent/impactful moments or exchanges?
When considering the evolution of codes or categorized pieces of information, When and by whom were these codes created and further discussed? [moderators or experts again] How did this process evolve and when did it decay? Was there redundancy or evidence of a few actors influencing the group’s perspective?
In both instances, we can also ask who were the most influential actors in general (aggregated depiction) and over time?
Examples of the analytic questions that can be addressed when observing the asynchronous generation of information are:
How did the information provided by the network of participants as a whole evolve throughout the data-collection process?
What do the emergent patterns suggest about the role of both the interviewers and the interview protocol based on the diversity or lack of diversity of the responses observed? Is there evidence of a too strict set of interview protocol questions that may not allow participants or experts to express themselves freely/openly? 14
What were the most prominent discussion points observed throughout the data-collection process?
What participants were the most active contributors of codes, and when did most of responses began to decay?
Note that the outputs generated from MOVIE are just a tool in the analytic process and does not replace the expertise of the qualitative researcher as the most important instrument in social research settings (Brodsky, 2008). It is hoped that with the use of MOVIE, new questions will emerge that may prompt researchers to go back to the collected data or potentially to even go back to the research sites in order to further enrich their understandings.
MOVIE execution and software access
The execution of MOVIE requires the following steps
Select method (asynchronous, or synchronous settings) 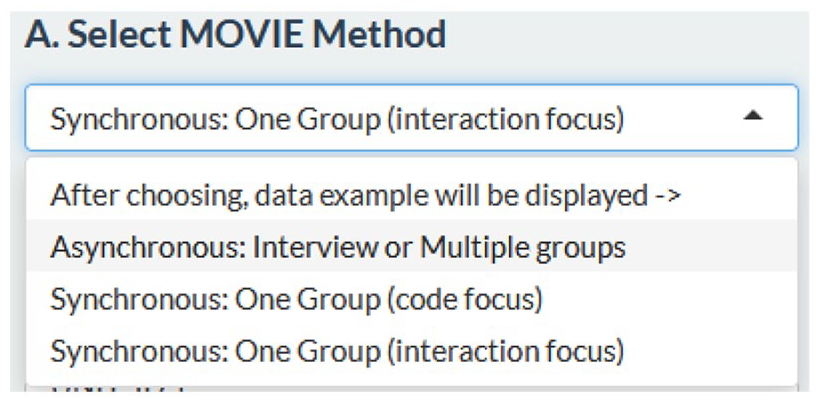
Load data displayed as indicated in the icon or upload your own dataset 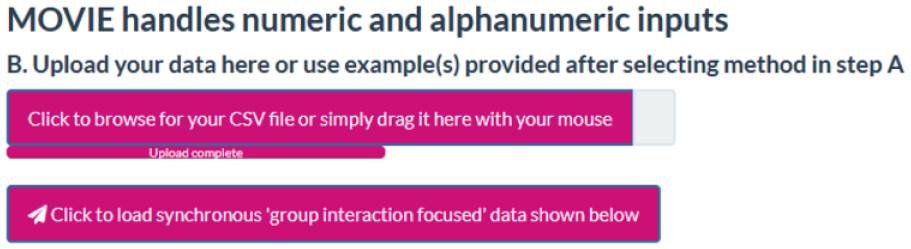
Select the sender or actor column (Sender if using our Microsoft Word macro) as shown in image after point 4 below
Select the receiver or code column (Receiver if using our Microsoft Word macro) 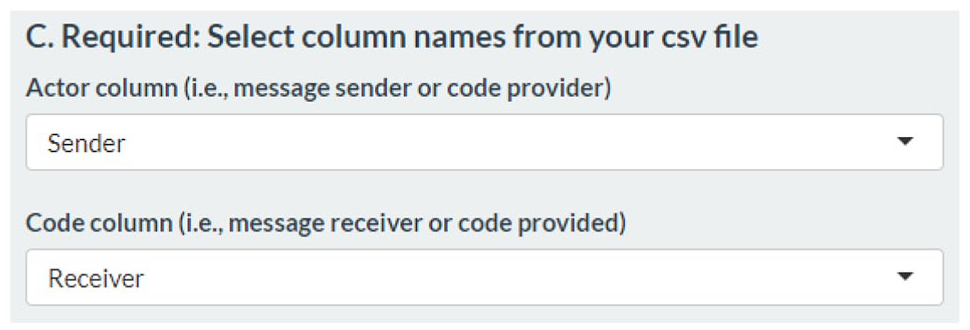
OPTIONAL: If your actor/sender column has attributes select the corresponding columns in role, shape, or color menus (see figure after point “d” below). If the text of message sent or quote of code is available (column “Quote” in our macro), users can select the corresponding column in the menu for code content (see figure after point “d” below). Researchers can map the number of consecutive events to trace. We recommend two, especially if the network has many units (see figure after point “d” below). Finally, researchers can select the transparency level of the colors to be plotted.
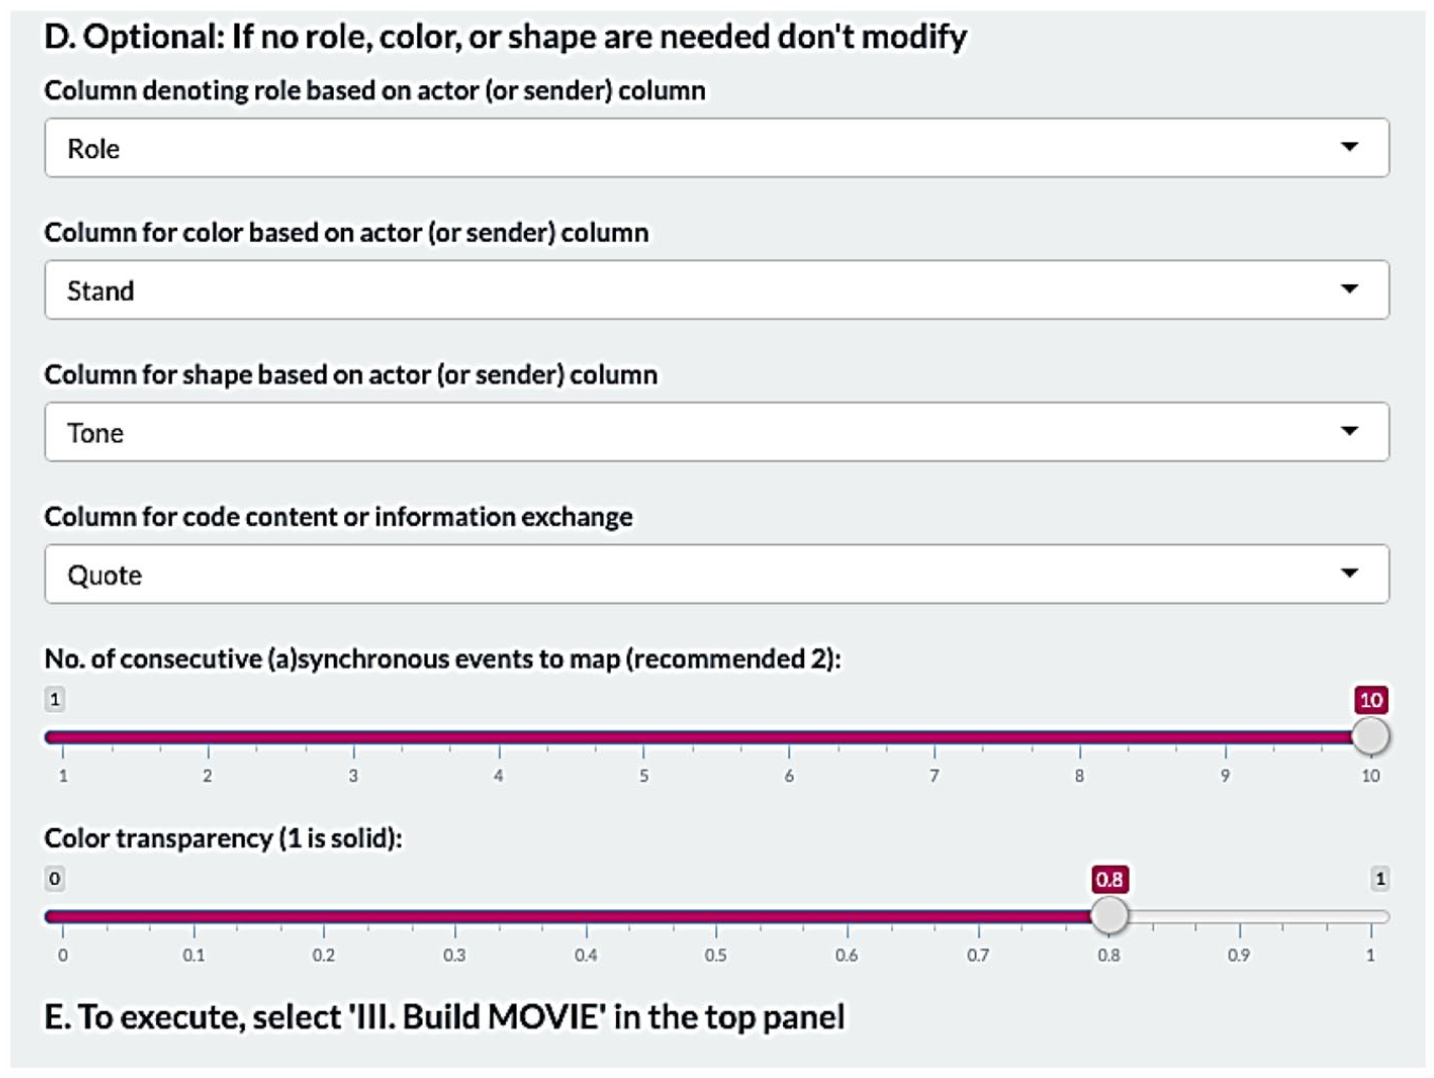
Click “Execute the MOVIE” on the top right panel
Two HTML files will be launched in your computer’s default internet browser. These files can be saved and shared via email. Researchers can also take snapshots of important events that may help open the “black-box” qualitative analytic process. Researchers can also upload the HTMLs to their website repositories as in the examples presented in this study.
Software access
Online version link: https://cutt.ly/RbjJlm1 [this version does not deploy time-aggregated analyses and requires uploading data to the Shiny server; we recommend the offline versions]
Windows offline application: https://cutt.ly/tbcfKiN
Mac offline application: https://cutt.ly/Ybcdrhh
Software execution of offline Mac and Windows versions
Extract the zip folder.
Open the folder starting with “Movie-Application-[Win or Mac]”
Double click on the file called “MOVIE-Application-Mac” or “MOVIE-Application-Win.”
The first time MOVIE is executed, you may be required to select menu “View” and “Force Reload” to generate all paths to this newly extracted folder.
• If after forcing reload, MOVIE does not display as shown in the online version, close the window and execute MOVIE again. • If needed, force reload once more. The interface will now load.
This process is only needed the FIRST time MOVIE is executed in a computer.
MOVIE is housed in a secure server location and requires no installation (just execution). All executable files are virus-free but may require administrative privileges to be deployed.
Due to a recent update of Google drive, Mac users are experiencing a “cannot open the connection” issue when running MOVIE.
To solve this issue, follow these steps:
After unzipping, right click on “MOVIE-Application-Mac” and select “Show package contents”
Go to contents,
Go to MacOS
Double click on “electron-quick-start” to execute MOVIE.
You can also create a shortcut (or alias) of “electron-quick-start” and place it in your desktop or somewhere handy.
MOVIE is offered free of charge as part of Democratizing Data Science 15 a novel analytic movement that seeks to remove computer programming prerequisites/requirements that may prevent the use and application of data science, machine learning, and data visualization tools in qualitative and mixed methods research.
Footnotes
Declaration of conflicting interests
The author declared no potential conflicts of interest with respect to the research, authorship, and/or publication of this article.
Funding
The author received no financial support for the research, authorship, and/or publication of this article.
Notes
Author biography
![]() ).
).