
Abstract
Studies using the social disorganisation theory as a framework to explain crime are commonplace globally. There are numerous inconsistencies however in the operationalisation of the theory with researchers using a plethora of different variables to represent the central tenets of the theory namely socio-economic deprivation, family disruption, residential mobility and ethnic heterogeneity. These inconsistencies bring into question the validity and reliability of the results especially when the selection of variables varies so considerably across local and international contexts. In this study we show how the use of different variables to operationalise these tenets can produce vastly different results when examining the causes of crime in the township of Khayelitsha in South Africa. We conclude by arguing for the potential standardisation of variable selection in spatial crime research using the International Organization for Standardization (ISO) global indicators as a guiding framework. We believe this is particularly pertinent if researchers are interested in undertaking cross-national comparative studies of crime.
Introduction
The notion that higher levels of social disorganisation within an area will increase the risk of crime has been proven in a number of countries including the United States (Bellair and Browning, 2010), Canada (Andresen, 2012), Germany (Oberwittler, 2004), the Netherlands (Nieuwbeerta et al., 2008), Australia (Mazerolle et al., 2010), Malaysia (Zakaria and Rahman, 2017), Brazil (de Melo et al., 2017), Colombia (Escobar, 2012), Mexico (Vilalta and Muggah, 2016) and South Africa (Breetzke, 2010), among many others. However, the testing of the theory continually yields conflicting results regarding the significance and type of associations found among the plethora of variables typically used to operationalise the theory. While some inconsistent results are to be expected given the variety of locations and contexts in which the research is conducted, of greater concern is the considerable variation that exist with regard to the definition and application of measures commonly used to represent the central tenets of the social disorganisation theory. In this study we apply and test the social disorganisation theory in the township of Khayelitsha located approximately 30 km south-east of Cape Town in South Africa. As a point of departure to previous research, we use the same spatial regression specifications but select a variety of different variables to demonstrate how the results of analyses can change depending on the variables being selected, in some instances dramatically. The subjectivity of model performance based on variable selection is also demonstrated. We then motivate for the possible use of standardised variables to operationalise the social disorganisation theory in future and argue why we think this is important for spatial crime research, particularly for researchers in developing contexts.
The measurement of social disorganisation
The conceptualisation and measurement of ‘social disorganisation’ has been an ongoing challenge throughout the history of the theory (Bursik, 1988; Kubrin, 2009). The central tenets and/or structural neighbourhood characteristics of social disorganisation represent complex social processes that are notoriously difficult to quantify. These multi-faceted factors often also manifest themselves within fragile social contexts, further contributing to the highly differentiated manner in which they are selected, defined and measured. A cursory review of a small number of studies in which the social disorganisation theory has been employed highlights the diverse ways in which one tenet – socio-economic deprivation – has been operationalised. For example, some studies use the concept ‘socio-economic status’ (de Melo et al., 2017; Sampson and Groves, 1989) to represent socio-economic deprivation while others use broader concepts such as ‘concentrated disadvantage’ (Escobar, 2012; Triplett et al., 2005) which may also include related social factors. Another inconsistency surrounds the variables and/or combinations of variables used to operationalise the concept. Researchers have used variables associated with income (Ceccato et al., 2007; de Melo et al., 2017), poverty (Escobar, 2012; Strom and MacDonald, 2007), education (Jones-Webb and Wall, 2008; Porter and Purser, 2010) and employment (Lowenkamp et al., 2003; Roh and Choo, 2008) among numerous others. The operationalisation of these concepts in the developing world in particular is often reflective of more extreme levels of deprivation and have included measures of extreme poverty (de Melo et al., 2017; Yahaya et al., 2013), households with no income (Ceccato et al., 2007) and population experiencing hunger (Escobar, 2012). Another popular way of operationalising socio-economic deprivation in the developing context includes access to various basic services (Breetzke, 2010; Escobar, 2012) albeit with varying definitions including access to exclusive bathrooms, or households with open sewers and uncollected and accumulated garbage (de Melo et al., 2017). Definitions of residential mobility are generally more similar across studies although there are still a number of different interpretations. Most studies provide measures pertaining to tenure status and residential mobility or use a combination of both (Law and Quick, 2013; Peterson et al., 2000; Thompson and Gartner, 2014; Warner, 2014). Family disruption has most often been defined as the percentage female-headed households (Lanier and Huff-Corzine, 2006; Roh and Choo, 2008; Strom and MacDonald, 2007) although percentage lone parent households (Law and Quick, 2013; Wong, 2011) and percentage divorced and/or separated are also common (Beaulieu and Messner, 2010; Lowenkamp et al., 2003; Porter and Purser, 2010). Again, in the developing context a number of noteworthy deviations on family disruption have arisen and include the percentage of child-headed households (Swart et al., 2016). Finally, the definition and measurement of ethnic heterogeneity varies substantially and ranges from the percentage of a particular ethnic group (Lanier and Huff-Corzine, 2006; Roh and Choo, 2008) to the percentage of the population who self-identified as belonging to an ethnic minority (Escobar, 2012). Other researchers only make a distinction between Black or non-Black residents (Breetzke, 2010; Porter and Purser, 2010; Strom and MacDonald, 2007; Swart et al., 2016). In their initial research Shaw and McKay (1942) found a strong relationship between the spatial distribution of immigrant groups and delinquency, in part because new immigrants initially resided in the poorest neighbourhoods. This emphasis on immigration in the original study prompted many scholars to include measures relating to the country of origin of residents in their analysis. While such measures have been commonly used in previous research, contrary to expectations, studies have increasingly found that neighbourhoods with higher concentrations of foreign-born residents and/or immigrants may actually experience reduced crime (Allen and Cancino, 2012; He et al., 2015; Martinez et al., 2010). Racial heterogeneity has also been measured in terms of linguistic heterogeneity or language diversity (Awaworyi Churchill and Laryea, 2019; Graif and Sampson, 2009) or in relation to the English language (Varano et al., 2009; Wickes et al., 2013).
It is important to note that the studies cited above represent a mere sliver of the plethora of different ways in which the central tenets of social disorganisation theory have been measured and operationalised. The aim here is not to highlight these studies specifically but rather to simply illustrate the various ways in which certain concepts and variables typically used to represent social disorganisation theory have been employed in past spatial crime research. In the analysis that follows we demonstrate how different variables and/or different combinations of variables can influence the results obtained in studies employing this framework.
Data and method
Study area
The township of Khayelitsha is located approximately 30 km south-east of Cape Town in the southernmost tip of South Africa. Khayelitsha – ironically meaning ‘new home’ in isiXhosa – was artificially established in 1983 under the directive of the former apartheid government of South Africa. The apartheid government aimed to strictly control urbanisation of the majority non-white population through regulating and restricting land ownership (Cole, 2013; Du Plessis, 2014). Using the Group Areas Act of 1950, the government prescribed the racial composition of geographic areas, thereby enforcing the racial segregation of South African cities (Dugard, 1980). Residential areas were divided by racial group with white neighbourhoods situated favourably close to the city centre and in attractive localities, while non-white residents were, at times, forcibly located and/or relocated into areas distant and distinct from the white urban core. These segregated so-called ‘townships’ were characterised by widespread malnutrition, poor or non-existent health systems, poor education in ill-equipped and overcrowded schools, inadequate or non-existent social security, high levels of unemployment and quotidian experiences of racist prejudice and abuse (Chikane, 1986). More than 25 years into democracy the legacy of apartheid’s racist spatial planning policy continues to haunt the country with these township areas, most often located on the urban periphery, continuing to be grossly under-serviced and under-resourced.
Khayelitsha is one such township. The World Economic Forum (2016) lists Khayelitsha as one of the world’s five biggest slums with an estimated 32%–46% of residents living in severe poverty. Crime is rampant. The township is among the most violent in the country with the homicide rate consistently over 80 per 100,000 residents, almost double the national average (Crime Hub, 2018). Khayelitsha has one of the highest rates of sexual violence in the world outside a conflict zone (Luthy-Kaplan, 2015), with one in three children under 18 likely to be a victim of rape and sexual assault (Inter-Ministerial Committee, 2017). Trust in the police is low (O’Regan et al., 2014), a consequence of apartheid-era policing where the former South African Police was more a counterinsurgency force constrained to fighting political enemies than a bastion of law and order (Leggett, 2004; Samara, 2003). This mistrust has resulted in a surge in ‘mob justice’ and violent vigilantism incidents since democracy (Super, 2016), exacerbated by a concomitant increase in gangsterism (Pinnock, 2016).
Crime data
Crime data for Khayelitsha was obtained from the South African Police Service (SAPS). These data contain information pertaining to the location, date and time of occurrence of all crimes in Khayelitsha from 2010 to 2012. 1 The dependent variable in previous studies examining the social disorganisation theory most often represent levels of delinquency or crime at a particular level of spatial aggregation. There is, however, as yet no ‘standard’ way in which to represent crime or delinquency risk in spatial crime research. Neighbourhood or community crime levels have been represented using either offender (Breetzke, 2010) or offence data (Andresen, 2006), while other studies have used criminal victimisation data (Lowenkamp et al., 2003; Marzbali et al., 2014). Criminal offences have also been represented using a variety of categories namely property crime (Allen and Cancino, 2012; Zhang et al., 2007) or sexual crime (Polczynski Olson et al., 2009; Yahaya et al., 2013). Arguably the most popular way to represent community crime in previous studies of social disorganisation is using violent crime (Ceccato and Oberwittler, 2008; Kubrin et al., 2018; Sampson and Raudenbush, 2004; Triplett et al., 2005; Wickes et al., 2013). As a result, a composite violent crime category was created and used as the dependent variable in this research. Another reason for selecting violent crime as the dependent variable in the study is due to the fact that crime committed in Khayelitsha is exceptionally violent. Indeed, the township consistently ranks among the most violent policing areas in the country (SAPS, 2018, 2020) and has some of the highest rates of interpersonal and gender-based violence in the world (O’Regan et al., 2014; Stone and Howell, 2019; Super, 2016). The SAPS include seven crimes in the category serious contact crimes, namely murder, attempted murder, common robbery, aggravated robbery, rape, assault with the purpose to inflict grievous bodily harm (including other sexual assault) and common assault. These were extracted and aggregated to create a violent contact crime category. We are aware of the dangers of aggregating any categories of crime data and the potential impact such aggregations can have on the results (see Andresen and Linning, 2012) but we were keen on improving the statistical power of our analysis through aggregation. It is true however that running separate analysis on individual categories of violent crime may produce somewhat different results and this is a notable limitation of our methodology.
A 3-year average (2010–2012) was calculated to minimise the impact of temporal fluctuations, and to coincide with the most recent 2011 South African census data. Point crime data was aggregated to the small area level (SAL) unit of analysis and a rate calculated per 1000 population and used as the dependent variable in the study. The SAL is the smallest unit of analysis for which Statistics South Africa disseminates spatial information. There are 583 SALs in Khayelitsha with each SAL containing roughly 630 people.
Census data
A total of 11 variables were selected to represent the central tenets of social disorganisation. Variables were extracted from the most recent census conducted in South Africa in 2011 (Statistics South Africa (SSA), 2011). Importantly, the selection of these variables was guided by previous research as well as by the availability of data and the unique local context of Khayelitsha – in this way mimicking most previous studies in which the social disorganisation is used as a framework for guiding variable selection. In our subsequent analysis, a different combination of these variables is used in three separate spatial regression models. Socio-economic deprivation was operationalised using five factors: First, a deprivation index (which included a combination of the percentage of residents earning an income below the poverty threshold, the percentage of unemployed residents, and the percentage of residents with less than a Grade 12 school education). Higher percentages indicate higher levels of deprivation. Second, the percentage of residents with no income. Measures of economic deprivation, specifically low income is frequently applied as a proxy for deprivation, both in the developed (Kingston et al., 2009; Livingston et al., 2014) and developing context (de Melo et al., 2017; Winter and Barchi, 2016). Third, the percentage of residents employed in the informal sector. According to SSA (2011) the informal sector consists of those businesses that are not registered for income tax or value added tax and can be considered a proxy for unskilled labour. Fourth, the percentage of residents with no access to flush toilets. Access to sanitation remains an ongoing challenge in Khayelitsha, with only 76% of residents having access to a flush toilet which are often shared communal toilets which are neither cleaned nor maintained, and are most often in an unusable condition (O’Regan et al., 2014). Fifth, the percentage of households with no access to water inside their dwelling or yard. These households can have access to piped water on a community stand, or within a distance of up to more than a kilometre away from the dwelling or no access to piped water at all (SSA, 2011).
Family disruption is frequently measured using the percentage of female-headed households with the assumption being that the absence of a father would increase family disruption through reduced income, less social control and a lack of male role models. Roughly 42% of households in Khayelitsha are headed by females (SSA, 2011). Residential mobility is operationalised using three variables. First, the percentage of households that are renting. Second, the percentage of households residing rent-free. This less conventional measure of residential mobility represents the percentage of households occupying their residences without paying any rent. Roughly 28% of all households in Khayelitsha do not pay any rent and which provides an indication of the degree to which housing is informal. Rent-free occupation is a common occurrence in South Africa specifically in areas characterised by informal dwellings, where the occupants are often uncertain with regards to their ownership or tenure status. Third, the percentage of residents born outside the Western Cape province – this is the province in which Khayelitsha is located. There are nine provinces in South Africa.
Finding a measure of ethnic heterogeneity in Khayelitsha is complicated by the fact that the township is remarkably homogenous. Indeed, almost 99% of residents are Black African and only 2% of residents are foreign born (SSA, 2011). Similar to previous research we ultimately chose to represent this tenet using language (see Danielsson, 2016; Graif and Sampson, 2009; Hipp and Wickes, 2017; Varano et al., 2009) and specifically a language diversity index. The Blau index (Blau, 1977) captures variation on a specific characteristic, in this instance language, in an area. A perfectly homogeneous group would receive a score of 0 while a completely heterogeneous group would receive a score of 1. The Blau index is defined as:
where p is the proportion of members in a given category and i the number of different categories.
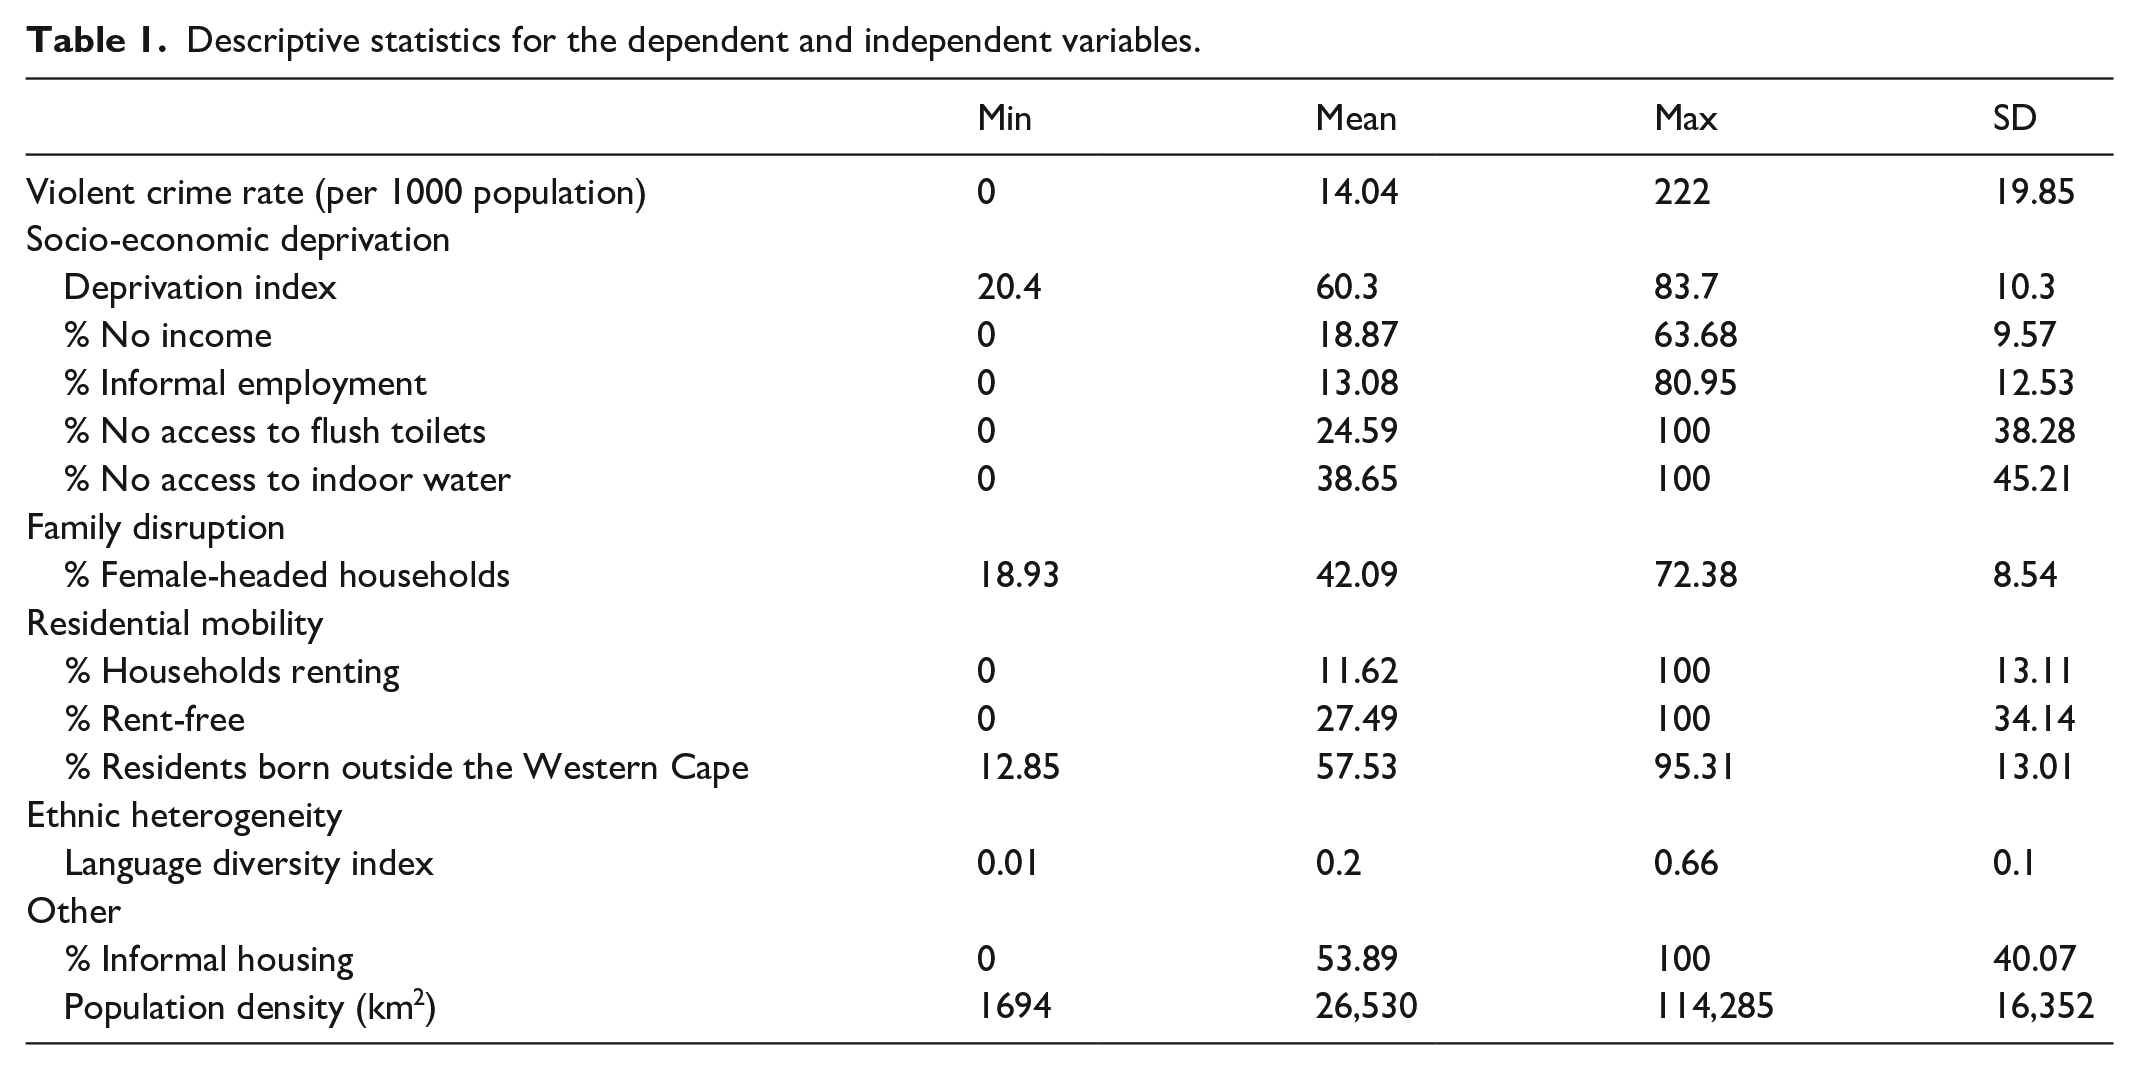
Finally, we added two additional variables in our analysis. These are population density and the percentage of the population residing in informal housing. Population density has most often been found to be associated with higher crime rates (McCall and Nieuwbeerta, 2007; Yirmibesoglu and Ergun, 2007) while measures of informal housing structures have also been found to be associated with increased crime risk (Ceccato et al., 2007; Lancaster and Kamman, 2016; Swart et al., 2016). The inclusion of ‘additional’ variables in studies of social disorganisation is common internationally (see Escobar, 2012; Lanier and Huff-Corzine, 2006; Law and Quick, 2013; Mazerolle et al., 2010) with researchers keen to include other context-specific factors that could potentially be associated with an increased risk of crime. The descriptive statistics for the variables used in the analysis are presented in Table 1.
Descriptive statistics for the dependent and independent variables.
The correlations between the variables used in the study are shown in Table 2. In terms of the independent variables, correlations exhibited expected relationships with the deprivation index positively correlated with the percentage of residents with no access to indoor water, residents living in informal housing and the percentage of residents who were not born in the Western Cape. Both variables related to service delivery (percentage of residents with no access to flush toilets and indoor water) were also as expected significantly and positively correlated with living in informal housing and not being born in the Western Cape. The percentage of households being headed by females were however negatively correlated with living in informal housing and not being born in the Western Cape. Similarly, the percentage of households renting their property were negatively correlated with having with no access to indoor water and living in informal housing. Whilst a number of these correlations were high and posed the risk of collinearity, none of the correlation coefficients were greater than 0.80 – a common threshold for concern (see Andresen, 2006) – while all variance inflation factors were below four.
Correlations.
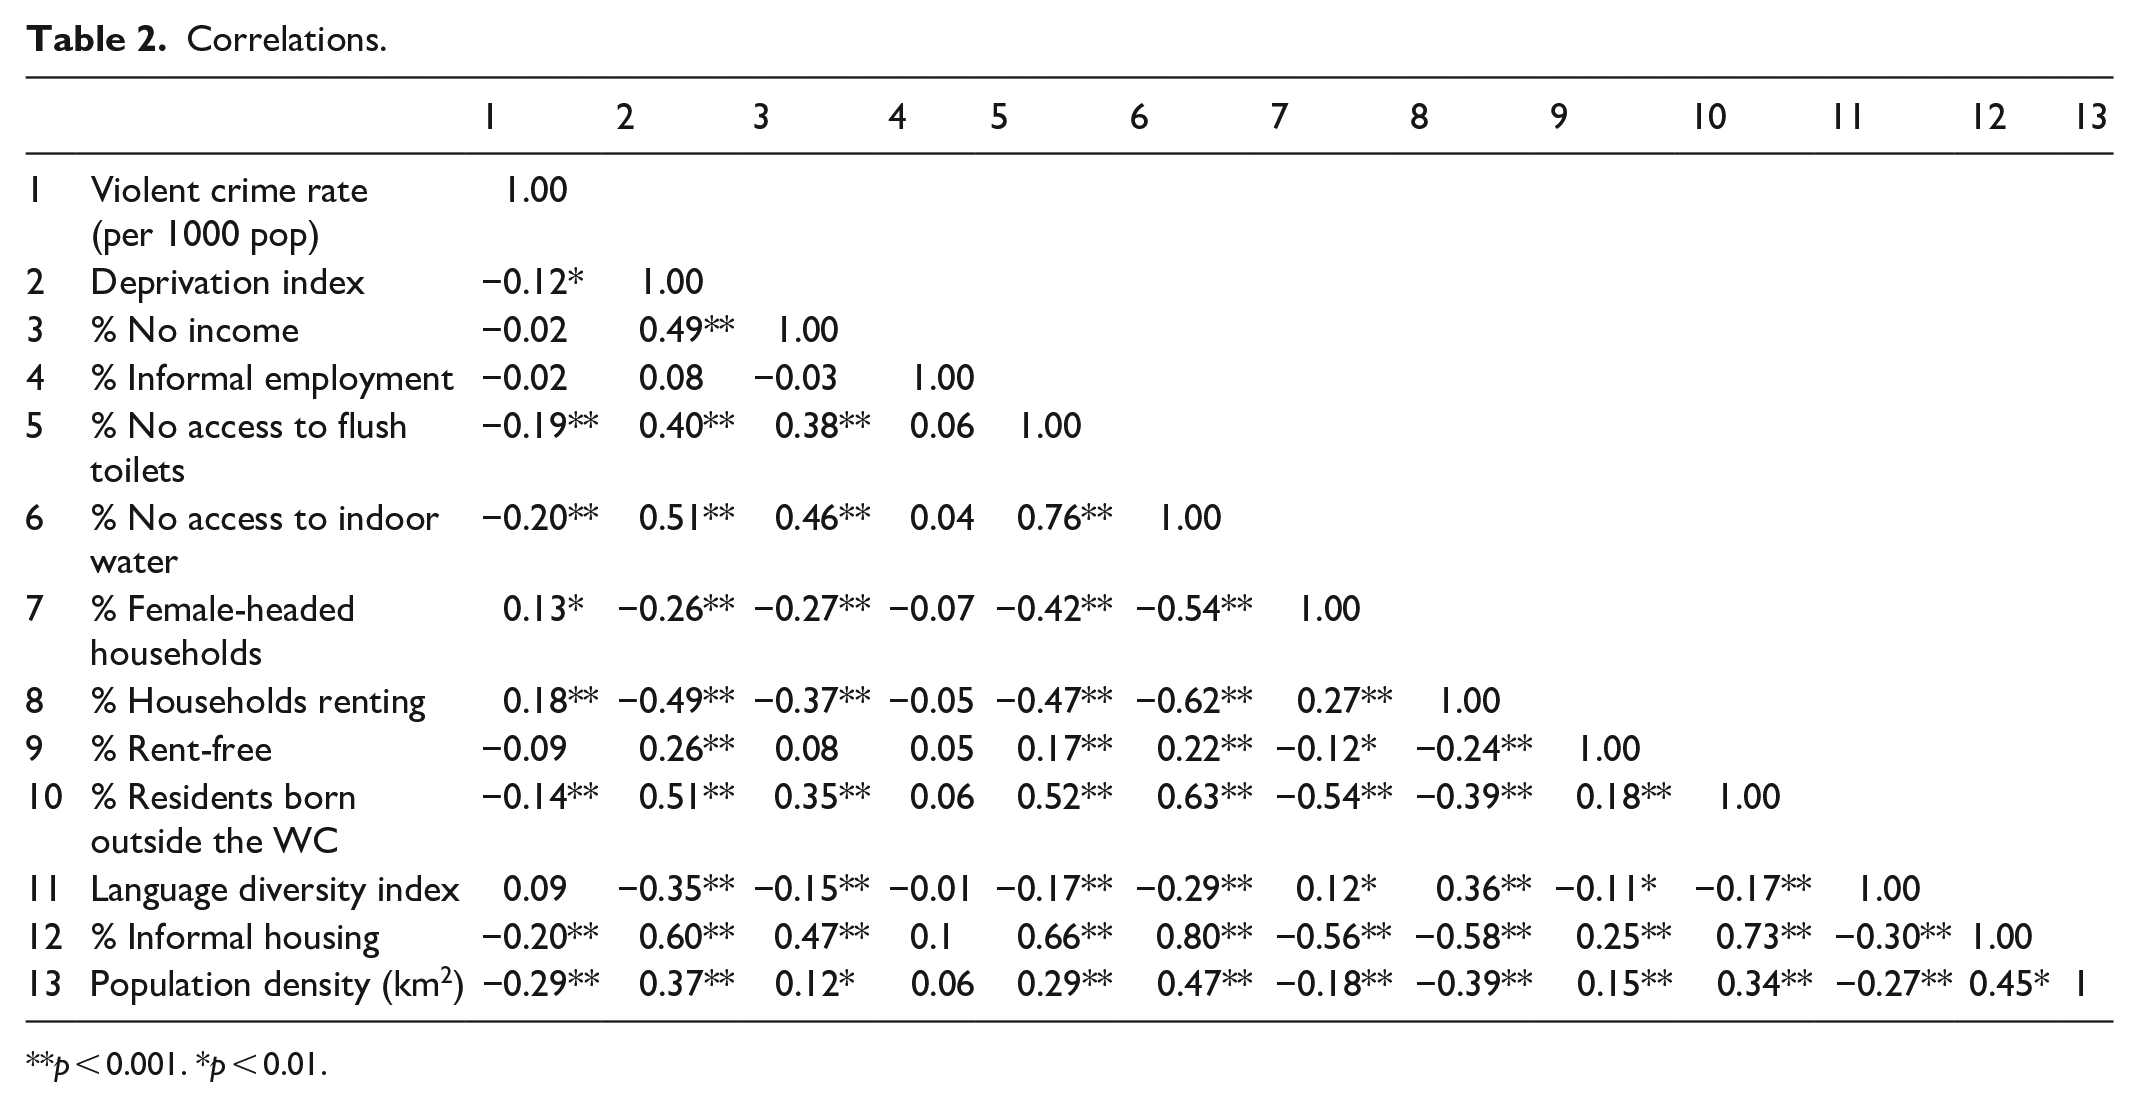
p < 0.001. *p < 0.01.
Analysis
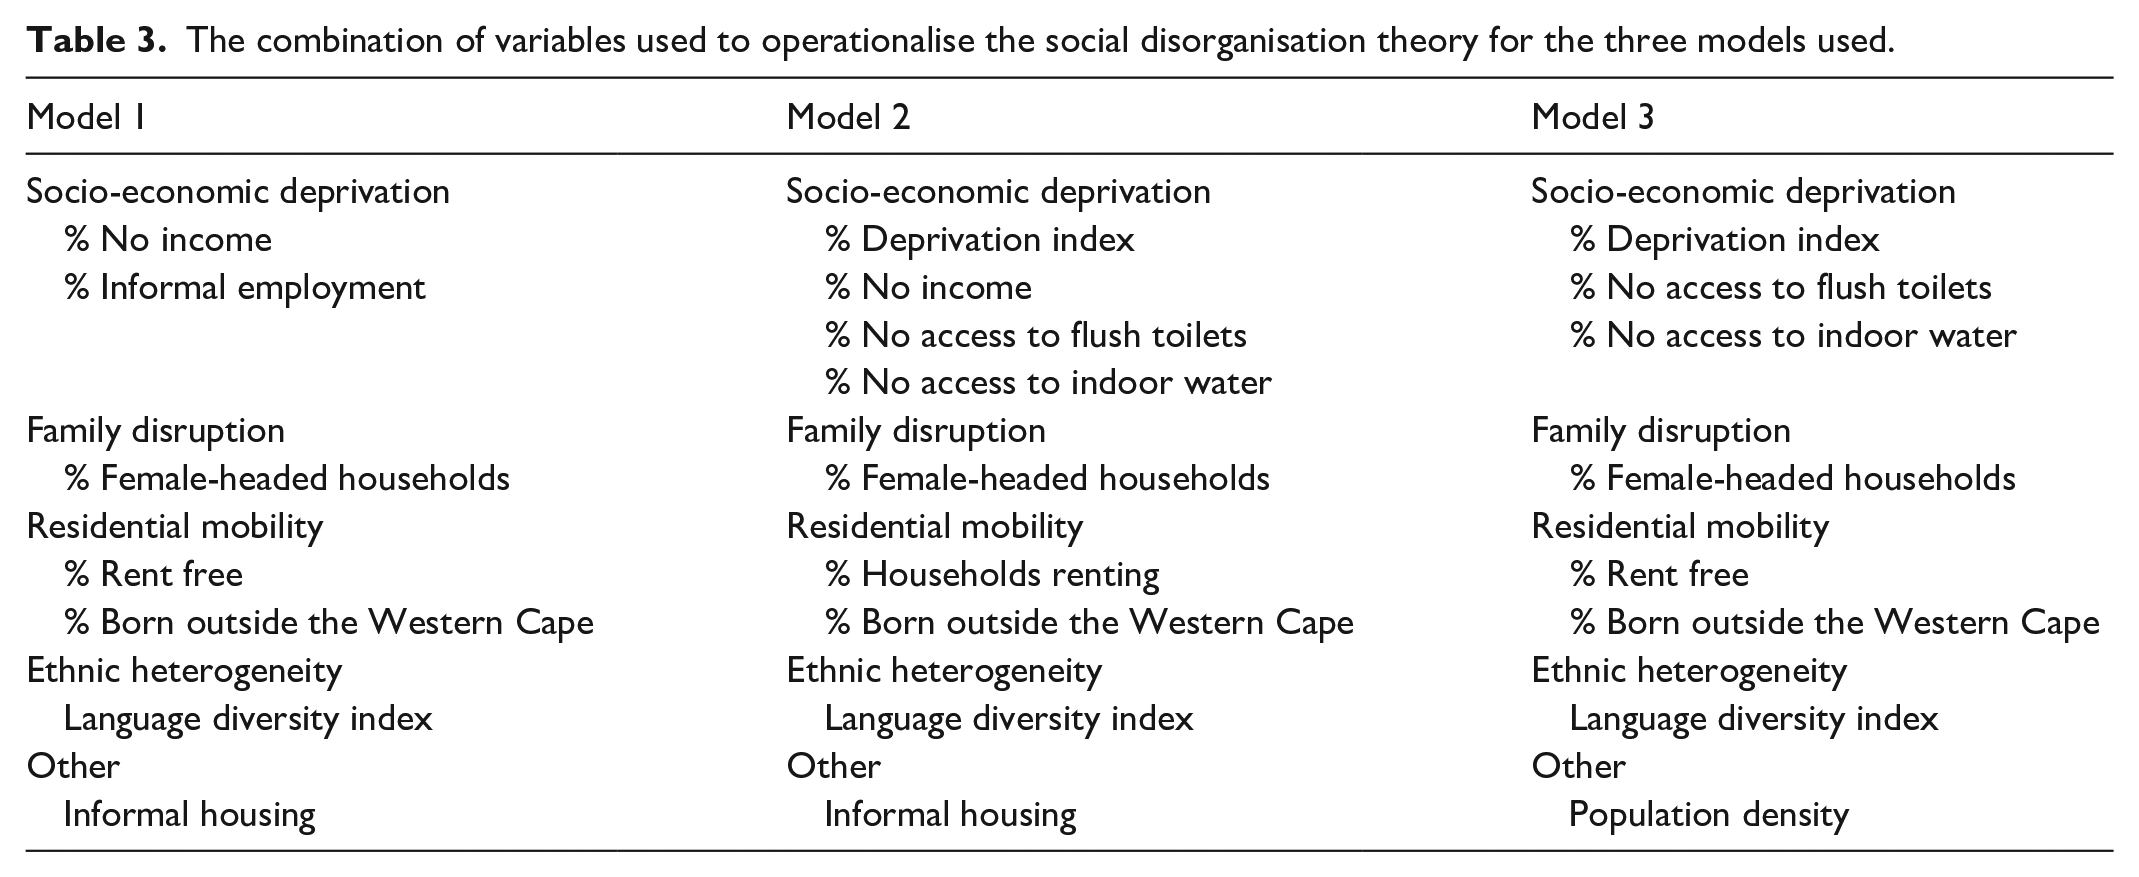
Table 3 shows the separate combinations of variables run using three spatial regression models. These combinations were randomly selected but each set includes at least one variable representing each of the central tenets of the social disorganisation theory. For example, the percentage of the population earning no income and the percentage employed in the informal sector were used to represent socio-economic deprivation in Model 1, whereas the deprivation index, the percentage of the population earning no income and the percentage of the population with no access to flush toilets and indoor water represented socio-economic deprivation in Model 2. Spatial regression (error) models were used due to evidence of spatial dependence confirmed using Moran’s I (0.189; p < 0.00). The general form is of the error model is:
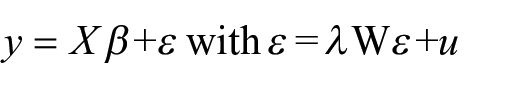
Where y represented the number of violent crimes per 1000 population, X the set of independent variables, β the coefficient, and ε the error term, W the spatial weights matrix, u a vector of errors and λ a parameter. Spatial autocorrelation was modelled using first-order queen’s contiguity for all models.
The combination of variables used to operationalise the social disorganisation theory for the three models used.
Results
It is important to note that while three different combinations of variables were used, the exact same spatial regression methods were specified. We found an approximate 20% difference between the pseudo R² values of the three models, and a notable reduction in the AIC values (see Table 4). Variables representing socio-economic deprivation performed markedly differently depending on the sets of variables used. For example, the deprivation index was significant but negatively associated with violent crime in Model 2, but was not significant in Model 3. In contrast the percentage of households with no income was positively and significantly associated with violent crime in Model 2, but not in Model 1. There was one consistency however with the percentage of households with no access to indoor water significant and negatively associated with violent crime in both Models 2 and 3. The one variable used to operationalise family disruption (the percent female-headed households) was not significant in any model.
The results of the three spatial error models.
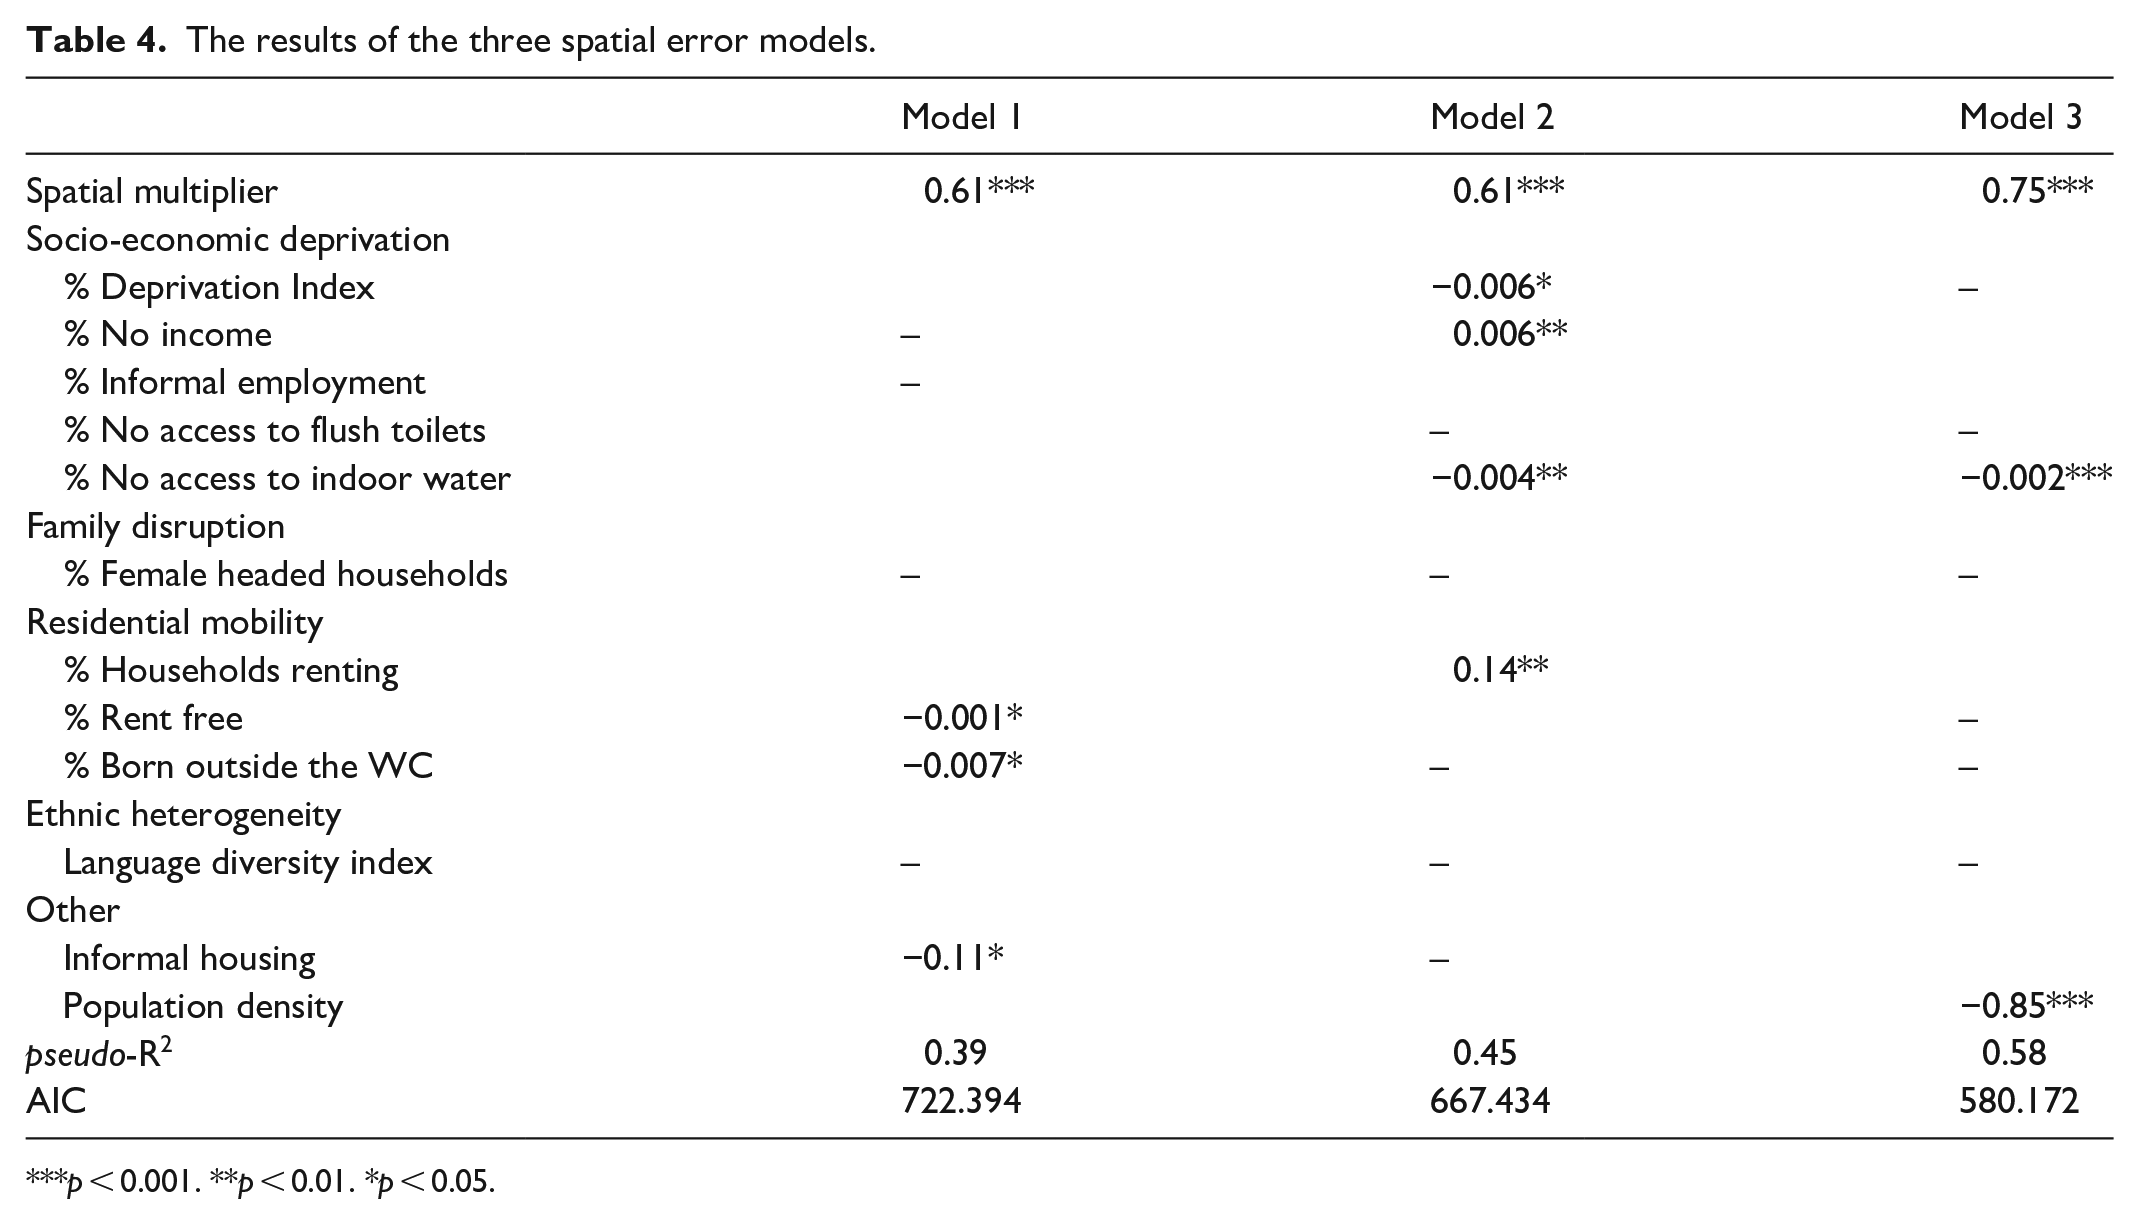
p < 0.001. **p < 0.01. *p < 0.05.
Similar to socio-economic deprivation, the three variables used to represent residential mobility also performed differently. For example, the percentage renting was found to significantly predict violent crime in Model 2, while the other two proxies for residential mobility produced conflicting results with the percentage of households residing rent-free and the percentage born outside the Western Cape both exhibiting negative and positive associations with violent crime in Khayelitsha in Model 1 but both variables being non-significant in Model 3. The percentage born outside the Western Cape was also non-significant in Model 2. Finally, population density was negatively significant in Model 3 while the percentage of households residing in informal housing was also found to negatively predict violent crime in Model 1 but exhibited no significance in Model 2.
Discussion
The purpose of this study was to demonstrate how the selection and combination of variables commonly used to represent social disorganisation can impact overall model performance as well as the associations and significance of the variables themselves. This was done by identifying a list of 11 variables which were used as input into three separate but identical spatial regression models. Importantly, with the exception of the rent-free tenure and informal employment, all the variables selected for use in the analysis have previously been used in studies applying the social disorganisation theory. Rather unsurprisingly, the results of models differed by almost 20% in terms of overall model performance while the significance and associations of variables differed too depending on the model. For example, none of the two variables representing socio-economic deprivation in Model 1 (percentage no income; and percentage informal employment) were found to be significant, yet three of the four variables representing socio-economic deprivation in Model 2 (the deprivation index; the percentage no income; and the percentage with no access to indoor water) were found to be either negatively and positively significant in Model 2. So, if you were interpreting these results based on Model 1 then socio-economic deprivation is not significantly associated with violent crime in Khayelitsha. However, if you were interpreting these results based on Model 2, then socio-economic deprivation plays a much more complex role in predicting violent crime in the township with one variable being positive as expected (percentage no income), two variables being surprisingly negative and significant (deprivation index; and no access to indoor water) and one variable (no access to flush toilets) exhibiting no significance. The natural question to ask therefore is: which answer is correct? Or rather, is any answer correct? Moreover, which indicator of socio-economic deprivation is the most ‘appropriate’ given the unique context of Khayelitsha? And lastly, what would the outcome have been if all four individual variables been combined in a single measure or index of socio-economic deprivation, which is not uncommon in studies of social disorganisation (Lockwood, 2007; McCall et al., 2010; Martinez et al., 2010; Nieuwbeerta et al., 2008; Thompson and Gartner, 2014; Weijters et al., 2009). The answer to this question is not so straightforward.
Previously, researchers have attempted to ‘standardise’ methods and data when applying the social disorganisation theory in cross-national comparisons (McCall and Nieuwbeerta, 2007; Van Wilsem, 2004), or cross-city comparisons (Strom and MacDonald, 2007; Weijters et al., 2009). In these instances, researchers have attempted to identify similarities or differences in these localities in order to identify the possible causes of crime. Other researchers have gone to considerable effort to measure the causes of crime over time applying exactly the same measures in order to be able to compare results (Beaulieu and Messner, 2010; Ceccato and Dolmen, 2011; Livingston et al., 2014; Martinez et al., 2010). For example, McCall et al. (2010) compared the predictors of homicide rates over five decennial periods and included a large sample of cities (904), metropolitan areas (259) and states (50) across the US from 1960 to 2000. A similar study by Beaulieu and Messner (2010) compared the effect of divorce rates on homicide over a period of five decades, including 131 large cities in the US. In these, and other studies, researchers have used a standardised methodological approach in order to find a comparable association between social disorganisation and associated crime rates, however the robust and consistent predictors of crime used in their studies are limited either to Europe or the US. Without globally standardised measures, different interpretations of social disorganisation variables will continue to remain a hindrance in the identification of consistent predictors of crime across international contexts.
One possible solution to the inconsistencies that we have identified in our results is to consider using International Organisation for Standardisation (ISO) 37120 indicators to operationalise social disorganisation theory in spatial crime research. The ISO 37120 is a set of guidelines which forms part of a worldwide initiative to promote and implement sustainable development. The indicators contained within the ISO 37120 provide a standardised manner in which to measure performance and monitor progress over time, while promoting information sharing, transparency and open data. Indictors include measures related to poverty, transport, immigration and service provision among numerous others. The most recent indicators – developed in 2018 – were specifically developed to promote international comparison by providing an international benchmark to measure and compare the quality of life and services in cities, promoting the sharing of best practices.
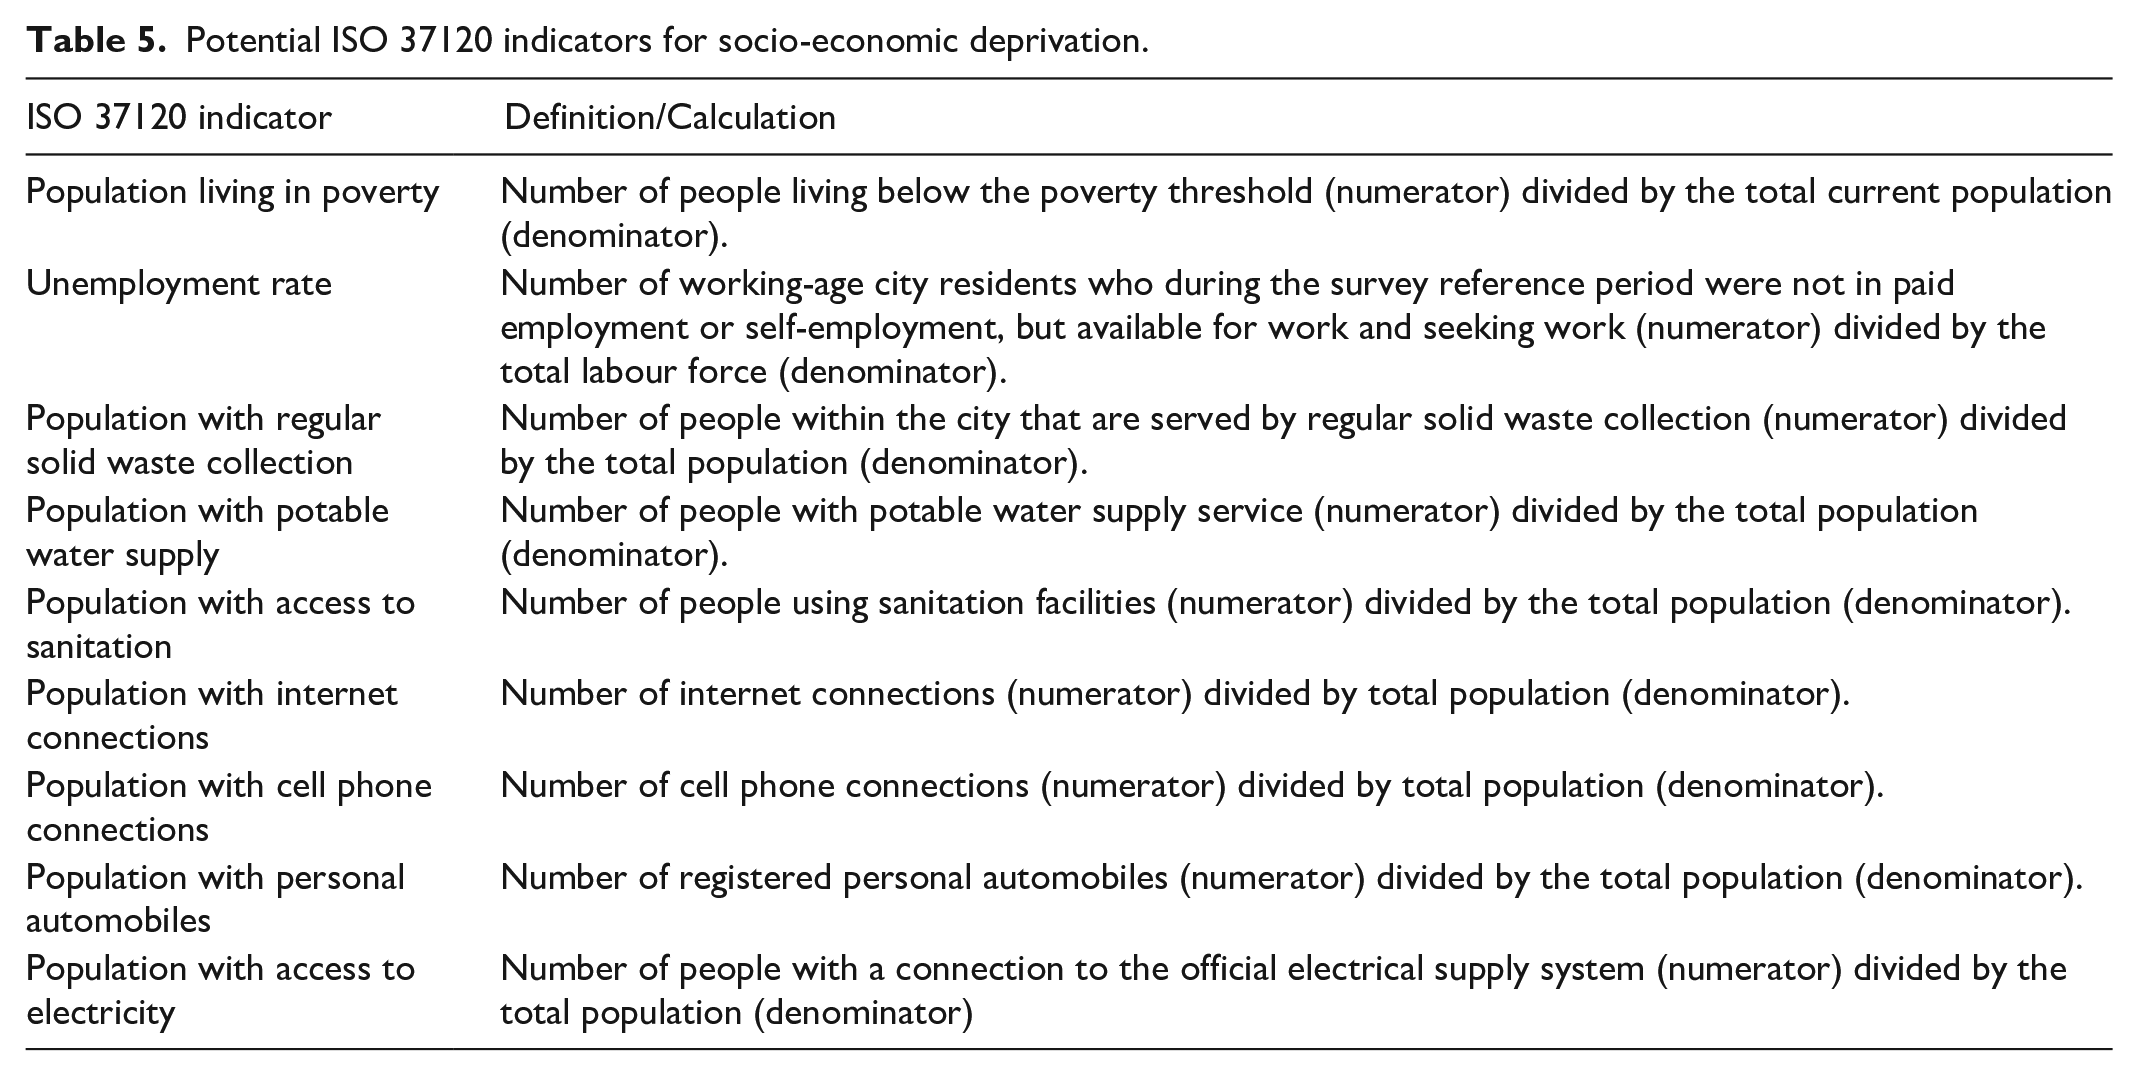
There are a number of ISO 37120 indicators which we believe could potentially be used to represent the central tenets of the social disorganisation theory. Table 5 provides a sample of ISO indicators that could, for example, be used to operationalise socio-economic deprivation in future cross-national studies using social disorganisation theory. Included are indicators linked to poverty, employment, education and service delivery; all concepts with a tacit linkage to deprivation. In all instances, a clear and unambiguous measure of calculation for each indicator is included. Some ISO indicators listed in Table 5 have already been included in previous studies using social disorganisation theory as a guiding framework (Breetzke, 2010; Escobar, 2012; Sampson and Wilson, 1995) although the ISO provides specific guidelines on how each should be measured in order to ensure comparability between any two contexts. Other more complex ISO indicators related specifically to geographic marginalisation and social isolation (percentage of the population living in slums) could also be added to the plethora of variables depending on the contexts. Importantly, these internationally agreed indicators include clearly defined specifications regarding their measurement and calculation, with the aim being that the application of these standards would promote simplified and inexpensive reporting which can be applied in diverse localities, irrespective of size, location or level of development. Currently, there are no international standardised measures allowing for these types of crime comparisons across contexts.
Potential ISO 37120 indicators for socio-economic deprivation.
But why is it important or necessary to have standardised measures to represent social disorganisation theory? At face value, this study examined the causes of crime in Khayelitsha, South Africa. Violent crime was found to be positively and negatively associated with socio-economic deprivation in the township. It was also found to be non-significant. These perplexing and contradictory findings are the result of using a wide range of different variables and combination of variables to represent this particular tenet of the theory. The non-standardised way in which the central tenets of the social disorganisation theory are operationalised limits the ability of researchers – particularly in the developing world – to compare and benchmark their results with other international studies. Comparative analysis requires standardised approaches and standardised variable definitions. The ISO provides one such universally agreed upon framework which could be used as a basis to guide variable selection. Townships such as Khayelitsha desperately require crime prevention and reduction interventions based on sound empirical evidence. This evidence can emanate from comparative knowledge sharing with other international studies which can arguably only be achieved though international benchmarking. The use of these indicators could also offer the benefit of contributing towards the creation of a reliable foundation of globally standardised data which can assist cities in building core knowledge surrounding crime causation, and can be used for comparative knowledge sharing in spatial crime research. Other advantages can be obtained in terms of long-term performance assessment, informed decision making to guide policy, and transparency and open data. The theory of social disorganisation is one of the most influential spatial theories of crime and has been applied and tested for more than half a century, resulting in a plethora of knowledge to engage with. The theory has been shown to be relevant in most international settings, and could provide a sound theoretical framework within which to understand crime in Khayelitsha and, more importantly, inform strategies aimed at preventing and reducing its occurrence. However, the results of our analysis provide more questions than answers in terms of its applicability. If, however, we could confirm the applicability of the theory in a South African context using a standardised cross-national comparative methodology with another international context, this could allow for relevant role-players that deal with crime prevention in the country to prescribe policies to reduce crime. Importantly, a number of crime prevention strategies employed commonly worldwide are based on existing crime theory (Akers, 1973; Sampson and Wilson, 1995; Shaw and McKay, 1942); South Africa could potentially follow suit. Of course, we are not advocating for the substitution of existing ‘conventional’ variables in spatial crime research or in any study in which the social disorganisation theory, or other spatial crime theory, are employed but rather motivate that standardised measures can, in certain instances, provide an extra string in the bow for researchers, particularly in contexts outside the West, to compare and contrast their results with their Western peers. Any such advantage should be welcomed, particularly in a context such as Khayelitsha, where crime is normalised and criminal justice and state structures employed to address this scourge have no legitimacy.
Footnotes
Declaration of conflicting interests
The author(s) declared no potential conflicts of interest with respect to the research, authorship, and/or publication of this article.
Funding
The author(s) received no financial support for the research, authorship, and/or publication of this article.