
Abstract
Ex-post harmonization of survey data creates new opportunities for research by extending the geographical and/or time coverage of analyses. Researchers increasingly combine data from different survey projects to analyze them as a single dataset, and while teams engaged in data harmonization continue to expand the information they provide to end users, there are still no commonly agreed standards for the documentation of data processing. Existing harmonization project typically opt for recode scripts that are generally hard to read, modify, and reuse, although some projects make efforts to facilitate verification and reproduction. This paper describes an alternative procedure and a set of simple tools for the exploration, recoding, and documentation of harmonization of survey data, relying on crosswalks. The presented tools are flexible and software-agnostic. The illustrative example uses the programming language R and spreadsheets—both common software choices among social scientists. Harmonization of variables on trust in institutions from four major cross-national survey projects serves as an illustration of the proposed workflow and of opportunities harmonization creates.
Introduction
International multi-wave survey projects are a major advancement in the social science infrastructure for cross-national research, yet their country and time coverage remains necessarily limited by funding availability, organizational conditions, interests of principal investigators, and other factors. Ex-post harmonization of survey data promises to overcome these limitations and create larger datasets with global coverage as well as time series necessary for longitudinal analyses, which enable stronger tests of theoretical mechanisms. Thus, harmonization of existing data in order to maximally exploit their potential is one of the current research directions in empirical social sciences. Despite the promises, the associated challenges are multi-faceted including technical, logistical, methodological, as well as substantive, and remain an active area of enquiry.
As the number of harmonization projects increases, it becomes evident that the lack of commonly adhered to standards for documentation of the harmonization process adversely affects the reusability of harmonization materials and collaboration. Harmonization initiatives commonly document data processing with recode scripts, which are generally hard to read, modify, and reuse, although some projects make efforts to facilitate verification and reproduction by, for example, providing script overviews, annotations, or splitting lengthy scripts into shorter ones. 1
This paper addresses the challenge of adequately documenting ex-post survey data harmonization process by presenting a procedure and a set of simple tools for the exploration, recoding, and documentation of harmonization of survey data, relying on crosswalks for mapping the original coding scheme onto a common (harmonized) one. The described approach includes automated steps that ensure efficiency of data processing, with human decision-making to integrate methodological expertise and domain knowledge, enabling the flexibility necessary in dealing with the variation and diverse standards found in survey datasets. The product of the harmonization process—apart from the harmonized dataset itself—is its documentation in form of crosswalk tables that map (1) source variables to target variables and (2) source values to target values. The readability of crosswalks enables the verification and reproduction of the harmonization process, and aides error detection. The crosswalks follow good practices of working with spreadsheets (Broman and Woo, 2018), which makes them suitable for automated processing. The crosswalk approach is software-agnostic and can be used with any programming language. The case study presented in this paper uses the programming language R (R Core Team, 2020), a common choice among social scientists. Altogether, the presented workflow is sufficiently simple that it can be successfully implemented by a single person or a small team of programming non-specialists, and powerful enough that it can handle large amounts of data and harmonization situations of moderate complexity, with complex cases possible to accommodate after some modifications.
The paper is organized as follows. I start by introducing the concept of ex-post survey data harmonization and provide a brief overview of research projects that have applied ex-post harmonization to data from cross-national social surveys. In doing so, I highlight the different documentation practices the projects have chosen, pointing to the lack of clear standards for reproducibility and limited interoperability of the harmonization frameworks. Next, I turn to the proposed crosswalk-based workflow, which systematizes data processing, ensures the transparency and documentation of all data transformations, and facilitates the sharing and communication between harmonization initiatives. As an illustration, I use items measuring trust in institutions in four cross-national survey projects: the European Social Survey (ESS) rounds 1–9, the European Values Study (EVS) rounds 1981–2017, the European Quality of Life Survey (EQLS) rounds 1–4, as well as 59 rounds of the Standard Eurobarometer (EB) that feature trust questions. Following a discussion of limitations of crosswalks, I conclude by linking the crosswalk approach to other developments in the area of survey research quality and management.
What is ex-post survey data harmonization?
Ex-post (or retrospective) data harmonization refers to procedures applied to already collected data to improve the comparability and inferential equivalence of measures from different studies (Fortier et al., 2017). In the case of ex-post survey data harmonization, the procedures are applied to survey datasets that were not intended for joint analysis, in order to integrate them into a single dataset that can be meaningfully employed in substantive research. Ex-post data harmonization is conceptually close to individual data metaanalysis (also called “integrative data analysis,” Curran and Hussong, 2009), used in medical and psychological research, a framework for pooling, and jointly analyzing individual participant data from separate studies (e.g. Ioannidis, 2017). The harmonization process is simultaneously theory-informed and data-driven. Theories provide the concepts and definitions, but data availability to a large extent determines what ends up being measured and how. Most generally, a survey data harmonization project consists of the following steps: (1) concept definition, (2) data preparation, (3) harmonization, and (4) verification and documentation (cf. Fortier et al., 2017; Granda and Blasczyk, 2016; Kołczyńska, 2020; Slomczynski and Tomescu-Dubrow, 2018; Wolf et al., 2016).
Ex-post survey data harmonization projects
The exact number of publications relying on survey data harmonized ex-post is difficult to establish, because “ex-post survey data harmonization” is not a commonly used term for the procedure in question. Based on a non-systematic review of ex-post survey data harmonization projects in the social sciences, two broad categories can be distinguished: projects where harmonization is performed for the purposes of a single publication and the harmonized data are intended for use solely or primarily by the person or team performing the harmonization, and projects that perform harmonization with the explicit purpose of making the harmonized data available to the research community. 2
Projects in the first category have meanwhile become so many, that the review of their data documentation practices would require separate systematic treatment. Most briefly, if these small projects document data harmonization, they typically do so as part of supplementary materials for the respective publication. Like in the case of supplementary or replication materials for other empirical papers, their content of is not standardized, and may include additional analyses, code, and original and/or cleaned data.
The diversity in data documentation approaches among the second category, that is, projects that explicitly aim to create harmonized datasets for broader use by the research community, can be illustrated on the example of harmonization projects in the area of political attitudes and behavior that rely on data from cross-national social surveys. At the time of writing, there are at least six such initiatives. The below brief description presents the type of documentation made available to researchers.
The “Democratic Values and Protest Behavior” (DVPB) project published the final harmonized data (in Stata and SPSS formats) and documentation, including lists of source variable names selected for harmonization from each dataset akin to variable mapping tables, SQL scripts used to perform harmonization, and codebooks of the harmonized data that include descriptions of harmonization procedures (Slomczynski and Tomescu-Dubrow, 2018; Slomczynski et al., 2017; Słomczyński et al., 2016).
The next three initiatives document their work in form of scripts, in Stata or SPSS. The project “Old and new boundaries: National Identities and Religion” makes available instructions and scripts, that enable the user to download the correct source data files and perform all recodes, as well as extensive documentation, including partial variable mapping tables (Bechert et al., 2020; May et al., 2020). The harmonized data are not published due to copyright restrictions on the source data. Similarly, the Harmonised PolPart Dataset created in the project “How citizens try to influence politics and why?” published harmonization scripts, a replication manual, and a codebook of the final data (Huijsmans et al., 2019). The project Global Citizen Politics, published documentation and Stata scripts to apply the necessary recodes and combine the data, as well instructions, a codebook, and mapping tables for source to target variables. 3
The last two projects provide limited replication materials. The Global Trust Research Consortium’s Harmonized Trust Database published a mapping table with source variable names and a PDF codebook (Sandberg and Bekkers, 2018). Finally, the project Human Understanding Measured Across National Surveys created a dataset as well as PDF documentation with recodes from source to target coding schemes, names of source variables, and names of source data files (Klassen, 2018a, 2018b).
All six projects had broadly similar goals and scopes in terms of the source data and the substantive interest in harmonizing particular variables, and all were conducted more or less at the same time (between 2013 and 2020). While all of them at least partly embraced crosswalks for variables to map source variable names to target variables, none used crosswalks for document source-to-target values recodes. Instead, three of the six projects documented their work with harmonization scripts in Stata or SPSS, which make it hard to follow and compare the harmonization choices in different projects, and thus hamper knowledge exchange. The DVPB project stands out with its reliance on SQL and tools that are not commonly used by social science researchers (Powałko and Kołczyńska, 2016). While the documentation is voluminous, in practice the exact replication of all harmonization procedures would likely not be straightforward due to the need to re-create a complex programming environment (cf. Liu and Salganik, 2019). Overall, despite all similarities, the six projects created documentation that does not enable easy reproduction of data processing.
The proposed workflow
This section provides an overview of the harmonization process. In the proposed workflow, harmonization documentation—variable and values crosswalks—are created as part of the harmonization process itself, not a separate product requiring additional attention. Crosswalks are a common approach for mapping one scheme onto the other. The crosswalk format documents the recoding decisions in a more explicit and accessible way compared to traditional scripts. In social surveys most variables are categorical, and numeric value codes on their own have no meaning, which makes crosswalks, where value labels are presented next to value codes, particularly useful for reducing error risk. Similarly, in variable crosswalks, the often uninformative variable names are presented next to corresponding variable labels. While recoding data with crosswalks would likely involve manual data entry, the table format makes verification and validation of the recodes substantially easier and more efficient by enabling the filtering and sorting, for example, by source and target values. Crosswalks lend themselves particularly well to reliability checks in cases when coding of the same data was performed by more than one person. Finally, crosswalk tables can be annotated in separate columns with the same information as annotations in code, but in a way that can be easily filtered.
In terms of data processing, harmonization involves working with data at different levels. For each step, a table is created on the basis of the source data. The resulting crosswalks are used in the next step of harmonization and at the same time serve as documentation. The data flow is presented schematically in Figure 1. Mapping can be performed manually by entering values into a worksheet in a spreadsheet program, or programmatically by defining appropriate transformation rules.
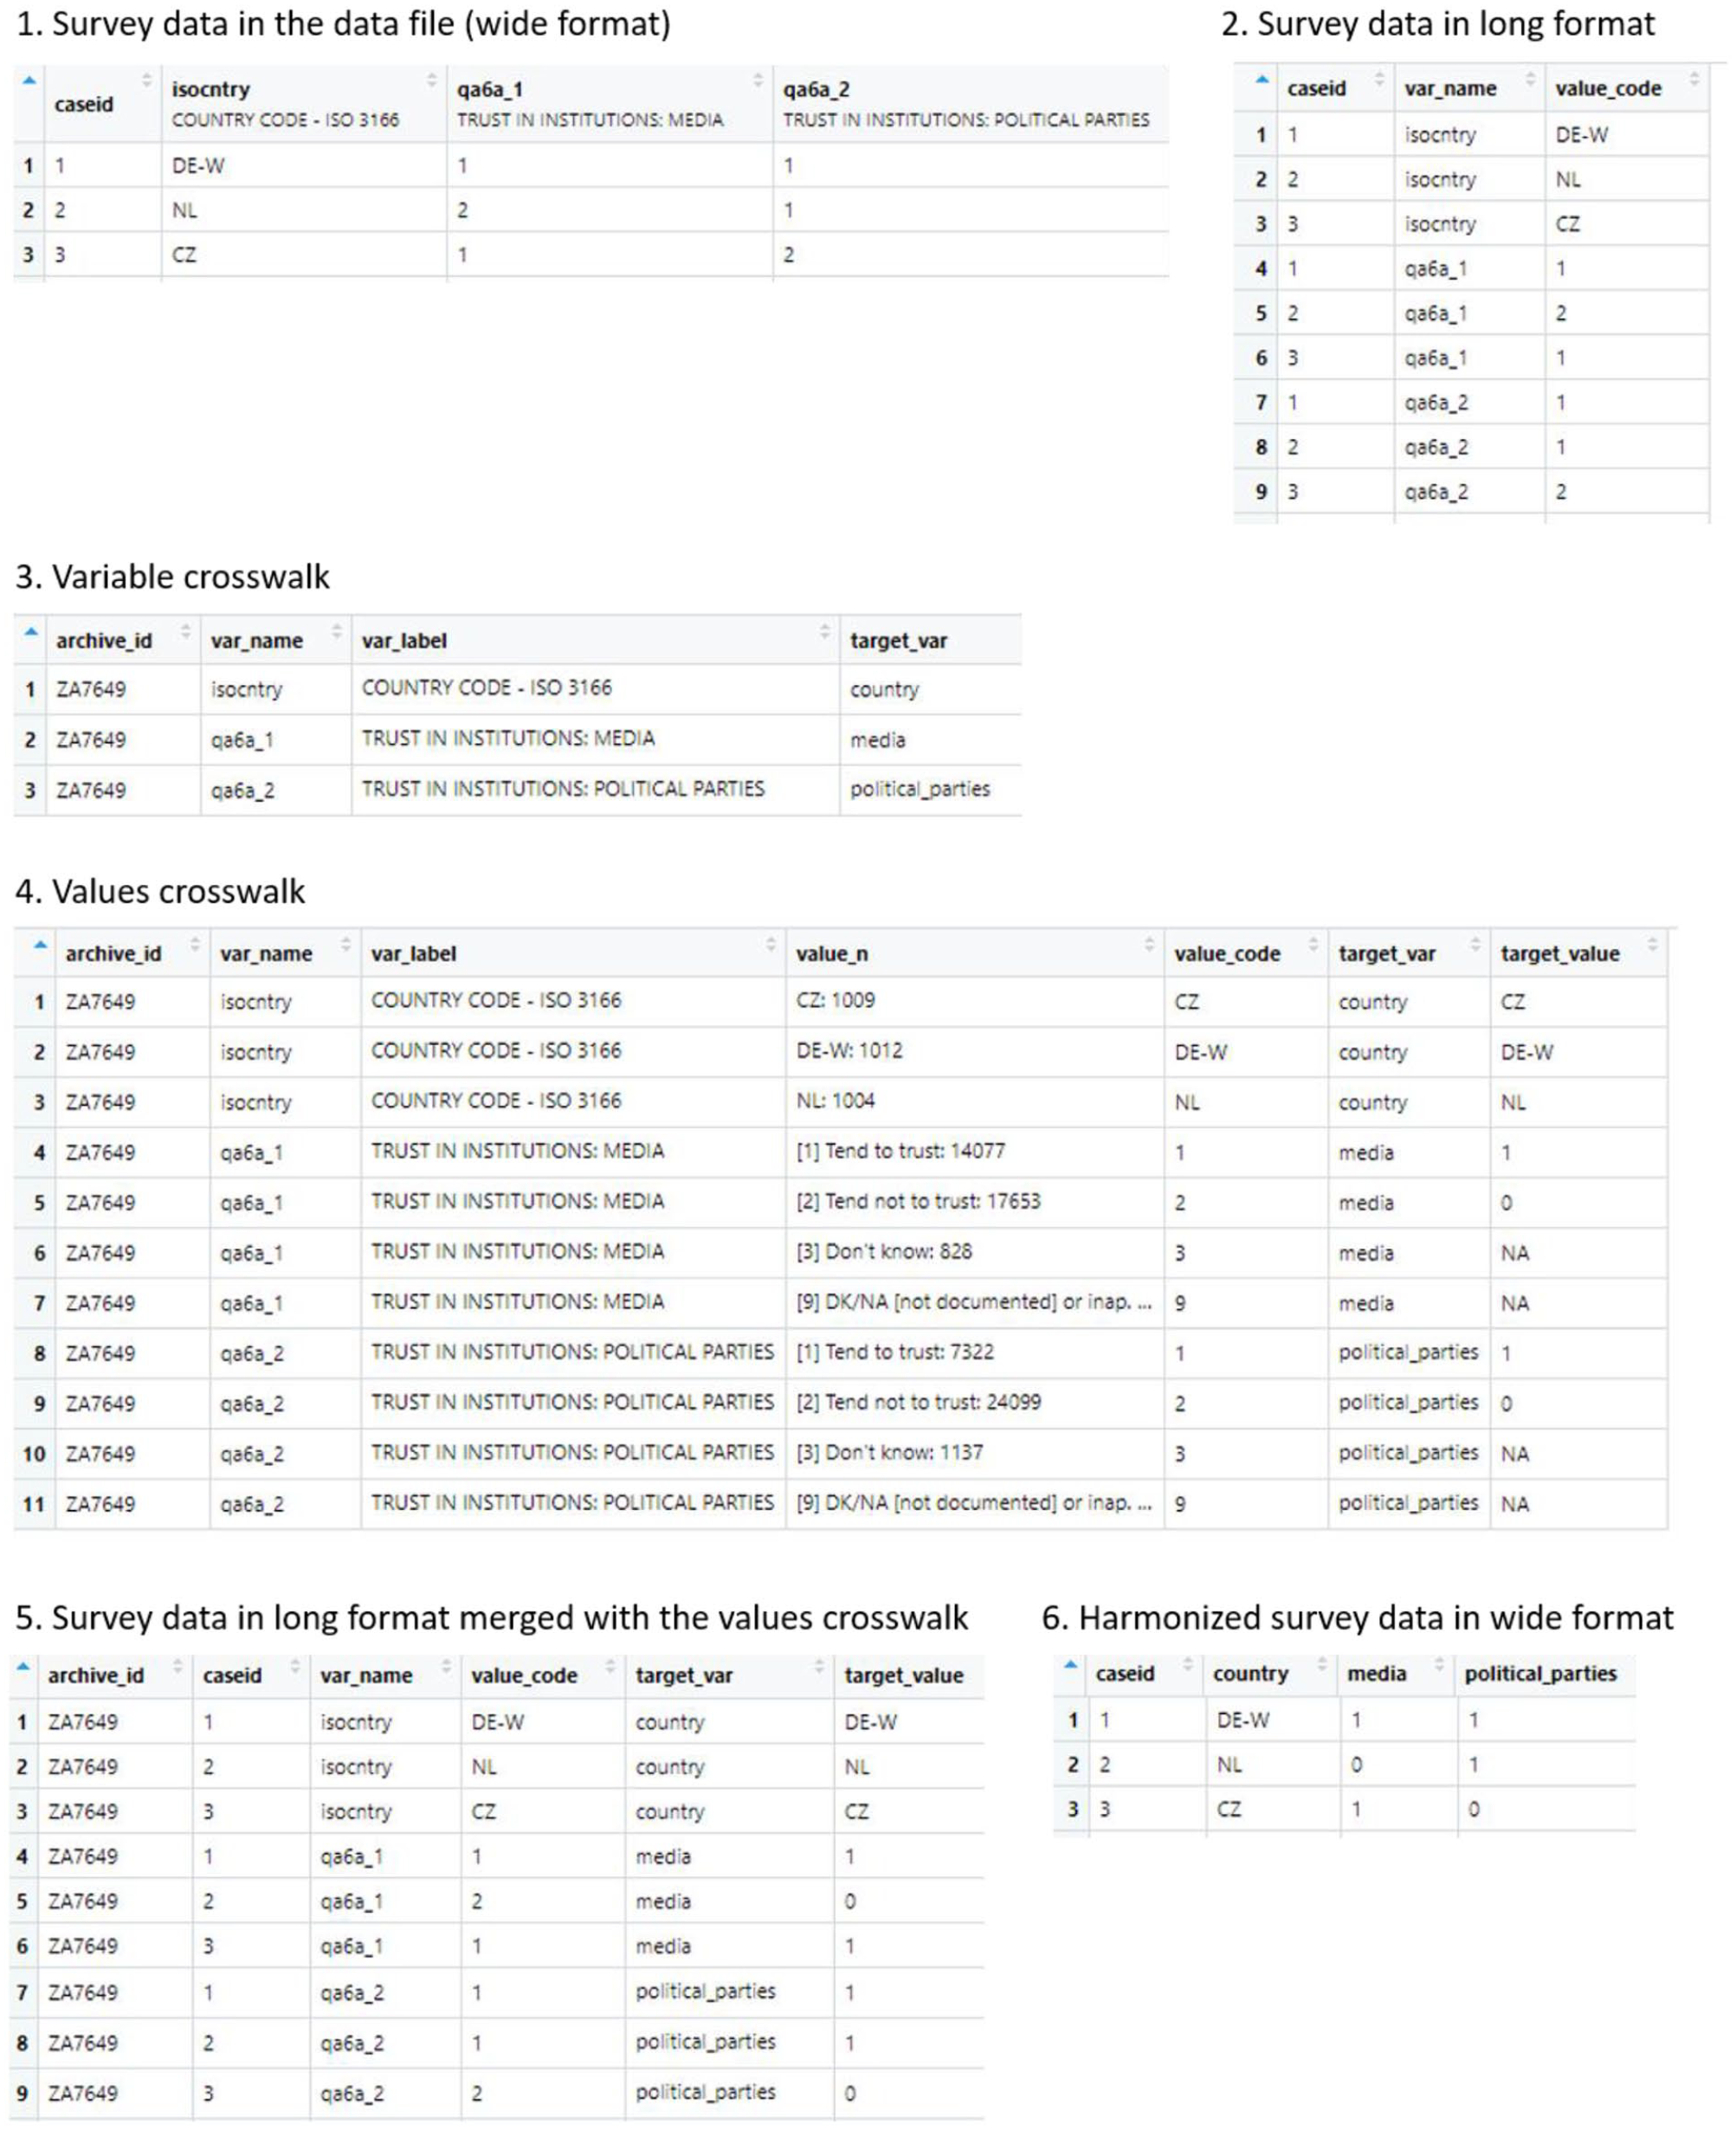
Harmonization: Data flow schema.
Step 1: Selection of source variables for harmonization
The procedure starts with all source data files downloaded to a single location, and their origin and versions noted. Each data file is processed separately. The first step focuses on the variable level, and involves identifying variables for harmonization in the source data files, and assigning a standardized target variable name to each source variable of interest, including substantive variables and technical variables. Substantive variables are those that correspond to survey responses and capture characteristics that will be the subject of research. Technical variables are necessary to uniquely identify surveys, that is, data from interviews administered to respondents from the same sample, and respondents within surveys. The minimum set of variables to identify a survey depends on how the data are stored in data files. In datasets that contain data from a single country and wave, the name or identifier of the data file is sufficient. In datasets that contain data from a single wave but multiple countries, the country identifier is needed. In datasets that contain data from multiple countries and multiple waves, both the country and wave identifiers are necessary. 4 Case (respondent) identifiers enable reshaping of the data to a long format (as shown in Figure 1, parts 1 and 2) which becomes useful for merging the data with the crosswalks as the final harmonization step. In addition to this minimum set of technical variables, it is also practical to include the year when the survey was conducted, for example, to easily match the survey data to contextual data, such as economic indicators, 5 as well as survey weights that are often provided to adjust for the sampling design and/or adjust for non-response, and are necessary when calculating sample statistics.
In the variable selection step (Figure 1, part 3) the variable crosswalk, a table with names and labels of all source variables— also called the codebook or data dictionary—is created on the basis of metadata from the source data files, and includes variable names, labels, as well as—optionally—value codes, value labels, and their corresponding frequencies. The latter make it easier to understand the meaning of variables that may be inadequately labelled, or to choose one variable out of a few that measure the same concept. In some cases, for example if variable labels are too short or otherwise uninformative, it is necessary to consult the original survey documentation. The list of source variables corresponding to the concepts of interest is used to select the necessary subset of the survey data to reduce the amount of data for further processing.
Step 2: Mapping source values to target values
The second step (Figure 1, part 4) focuses on the level of individual values of the chosen source variables, and requires mapping these source values onto a coding scheme of the respective target variable. Subsets of source data files are selected that include only the variables tagged in Step 1. For those variables, a values crosswalk or mapping table is created, that is, a table similar to the codebook, but where each source value of each variable corresponds to one row and each variable accounts for as many rows as there are unique values in the data. Each source value is assigned a target value on the basis of the common coding scheme. This step also includes identifying codes corresponding to different forms of item nonresponse as missing. The completed crosswalk is used for mapping (recoding) values of the source variables to their target values.
Step 3: Recording characteristics of source items and surveys
The third, optional, step is at the level of the data file and/or survey, and refers to the recording of properties of the source variables and/or source surveys that are worth preserving because of methodological reasons. For example, information about characteristics of survey items is sometimes necessary for modeling: ordinal models require information about the length of response scales. Typically (but not always), properties of source items vary between, but not within, survey projects.
Harmonization and analysis of harmonized survey data should also take into account characteristics of survey samples and of the entire survey process, which often vary across projects, countries, and over time, and may impact data quality and comparability through different types of errors (cf. Smith, 2018). These characteristics include fieldwork procedures and response rates, the quality of documentation (Jabkowski and Kołczyńska, 2020; Kołczyńska and Schoene, 2018), as well as processing errors (Oleksiyenko et al., 2018), the quality of survey weights (Zieliński et al., 2018) and sample bias (Jabkowski et al., 2021). Analyzing the variation in the relevant methodological characteristics of the harmonized survey data may be used to evaluate the potential for comparability violations in the harmonization process and analyses of the resulting data.
Illustration: Trust in institutions
As an illustration I use items on trust in institutions in four cross-national survey projects in Europe: EB, EQLS, ESS, and EVS. The data sources and versions are available in the Replication and supplementary materials. All four projects collect survey data in many European countries, consist of multiple data collection waves, use samples intended as representative for entire adult populations of the respective country, and regularly feature items on trust in different institutions. While sharing these basic characteristics, the four project are also quite different. The oldest one, EB, is a public opinion poll of the European Commission conducted since 1974, initially with two waves per year and more recently with up to nine surveys in 2019. EB is conducted in all EU member states, as well as occasionally in candidate or applicant countries, relying on random route samples and targeting individuals aged 15 and above. While the composition of each questionnaire is different, EB regularly repeats the same questions, including those on trust.
EVS was initiated in 1981 by a group of academics in order to measure and compare values and attitudes of European societies. Since then surveys have been conducted about every nine years with country coverage increasing from 13 in 1981 to 36 countries in the most recent wave in 2017. Early EVS waves used quota samples and then switched to probability samples. The target population in EVS includes individuals aged 18 and above. While the questionnaire has changed over time, the primary focus on values has remained and many questions were repeated across waves.
ESS is an academically driven project conducted since 2002 every 2 years, with explicit emphasis on methodological excellence and cross-national as well as over-time comparability of samples and measurement. ESS uses probability samples and targets individuals aged 15 and above. In each wave the questionnaire repeats the same set of core questions, in addition to wave-specific topical modules.
EQLS is run by the European Foundation for the Improvement of Living and Working Conditions, and agency of the European Union for social research. Four waves have been conducted since the first edition in 2003. The target population includes persons aged 18 and above selected with random route procedures or multistage probability samples, depending on the country and wave. Table 1 presents basic information about these projects, while systematic information about methodological aspects of the surveys are provided in Jabkowski and Kołczyńska (2020).
Description of the survey projects used in the analysis.
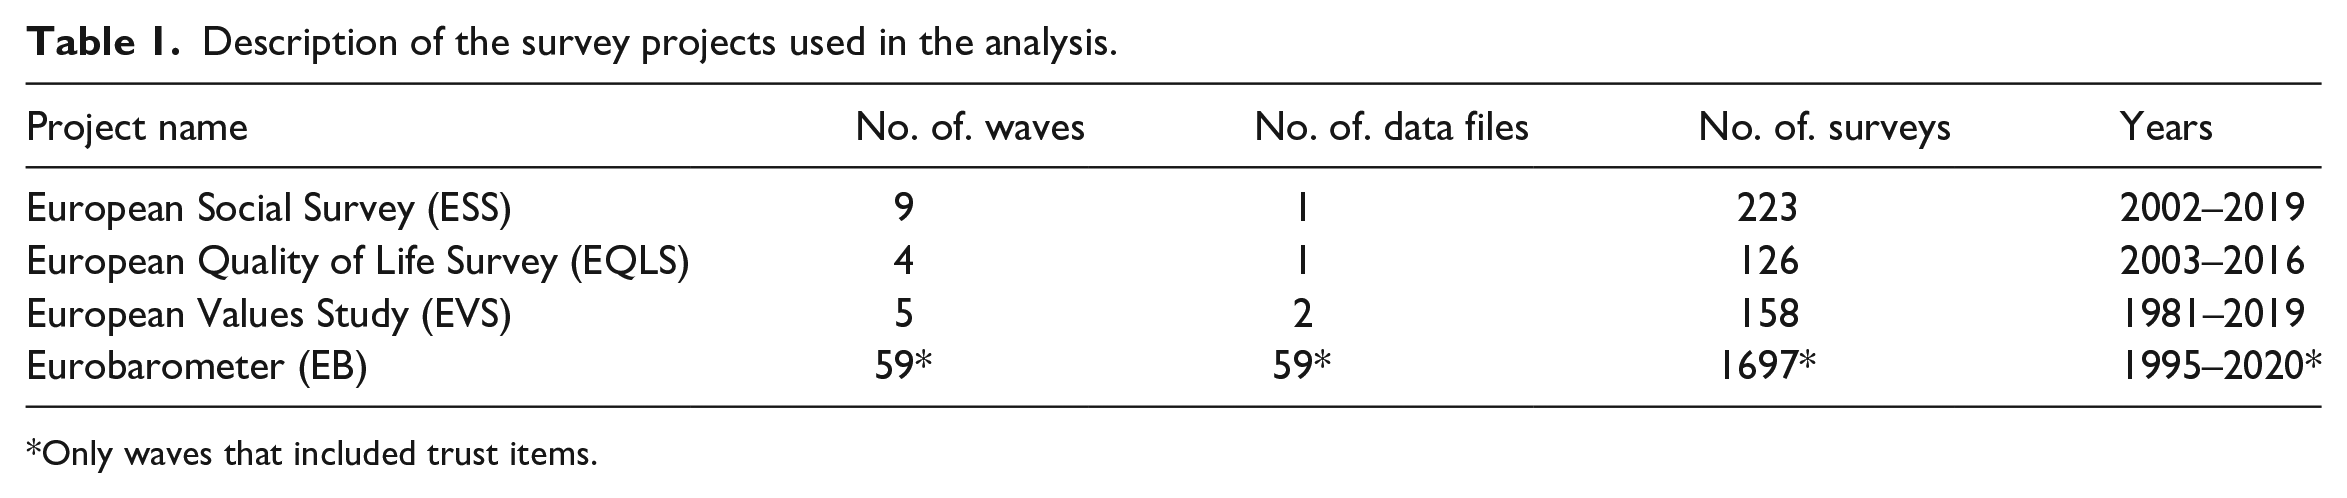
Only waves that included trust items.
Trust in institutions is a common item in many cross-national surveys. In ESS, EVS, and EQLS, trust items are included in all waves, but the set of institutions differs across projects and waves. EB is different in that trust items are only included in 59 of the over 200 waves. In each project the design of the trust items is slightly different, in particular with regard to question wording and response scales. While the differences in question wording, including the use of the word “trust” or “confidence” does not seem consequential, the differences in the length of the response scale need to be taken into account in any analysis of harmonized data from the described projects (Kołczyńska and Slomczynski, 2018).
Step 1: Selection of source variables for harmonization
The first step in the harmonization process is the selection of source variables corresponding to target concepts of interest, as well as technical variables. The target concepts in this case include trust in different institutions, as many as there are available in the source data. Items asking about social trust, trust in people in general and in various groups are excluded.
To map source variables to target variable names, a table is created with a list of source variables in each dataset. Most survey datasets used by social scientists are available in Stata or SPSS formats, which—in addition to variable names and values—also store attributes such as variable labels and value labels. These attributes can be extracted from the data files and processed. Thus, the variable table is created by extracting variable names and variable labels, and presenting them in a tabular format. In R, this can be achieved, for example, with the packages labelled (Larmarange, 2021) and sjlabelled (Lüdecke, 2021). Examples of functions are provided in the Replication and supplementary materials. The codebook can be searched via filtering and regular expressions like any other data table. It can also be exported into a spreadsheet program, if this is more convenient, for example, in collaborative settings.
Figure 1, part 3, shows a snippet of the variable table created for EB wave 93.1 collected in July and August 2020 in 35 countries. The first column (archive_id) contains the Gesis archive ID for the EB dataset, which serves as an identifier of the source data file. The column var_name contains the names of source variables, var_label contains the variable labels, and wave contains the wave number. The column target_var was filled with names of target variables to which the selected source variables correspond. In the example shown in Figure 1, country was assigned to the country identifier, media was assigned to the variable on trust in the media, and political_parties to the variable on trust in political parties.
Step 2: Mapping source values to target values
In the second step, for the variables selected for harmonization in the previous step, a values crosswalk is created, where each value of each variable is in a separate row, and value labels are presented next to value codes. For each value of the source variable a target value needs to be assigned, either manually (after exporting the crosswalk to a spreadsheet program) or programmatically, paying attention to the treatment of missing value codes.
The snippet in Figure 1, part 4, shows a fragment of the values crosswalk for the three variables introduced earlier. In the trust variables, values
Once the value crosswalk table is ready, it can be used to recode the survey data. A convenient (and fast) way is to use joins to match values of the crosswalk to the survey data converted into the long (stacked) format, where values of all source variables are in one column and the different variable names are stored in another column, as shown in Figure 1, parts 2, 5, and 6. 6
Step 3: Recording characteristics of source items and surveys
The present example records the length of the original response scales to illustrate differences in country trajectories depending on the original scale length, as presented in Figure 3.
Results: Availability of trust items
The availability of different variables across projects and surveys is relevant both for those preparing to perform ex-post harmonization, and for other secondary data users. A documentation review is not always sufficient in this respect, as integrated multi-country and multi-wave datasets often contain variables based on questions that were only asked in a subset of countries or waves.
Altogether, in the analyzed datasets, I identified trust items in 50 different institutions, as listed in Figure 2. 7 The most common items are on trust in the national parliament, available in 1976 national surveys, followed by trust in the European Parliament (1685 surveys), in the national government (1668), and in the United Nations (1549) Of course, the order of items is largely driven by their availability in EB surveys, which comprise 77% surveys in the analysis.
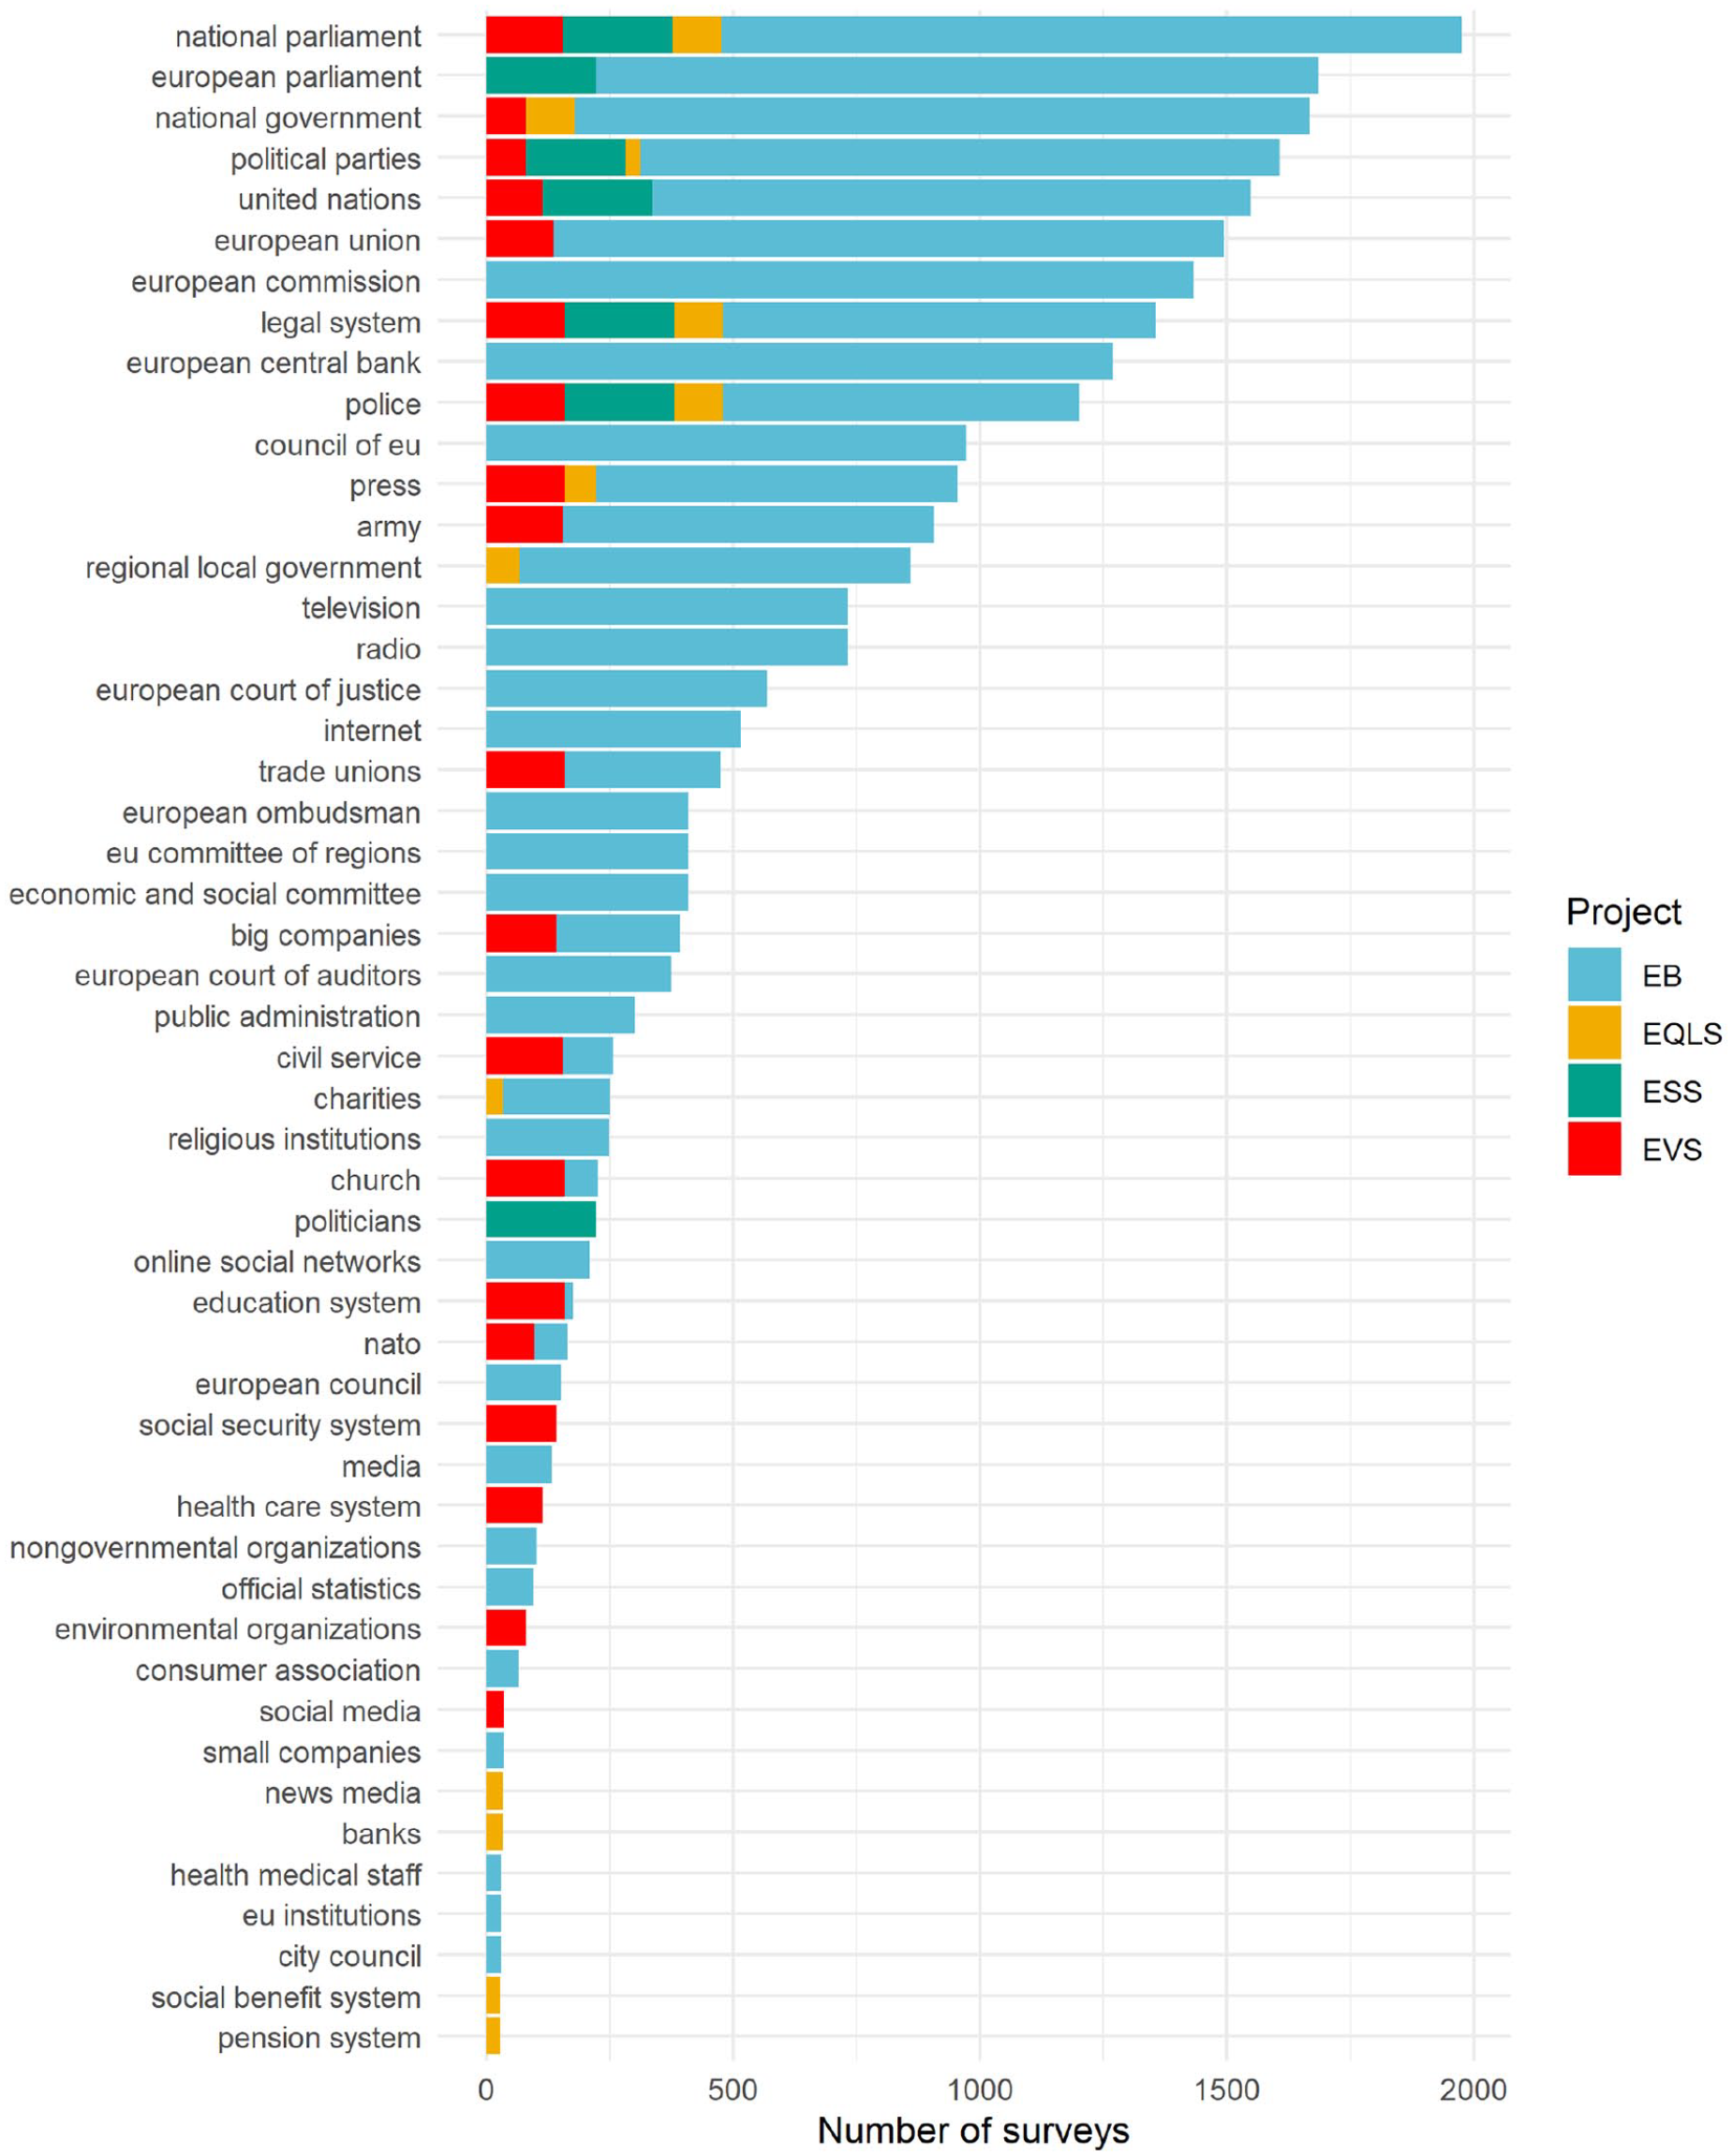
Availability of trust in institutions items in the European Social Survey/1-9, European Values Study/1-5, European Quality of Life Survey/1-4, and 59 Eurobarometer waves.
Four items are represented in all four projects: trust in the national parliament, political parties, legal system (including the justice system), and police. At the same time, 32 items are unique to a single project, including European Union institutions that only EB asks about.
Results: Trends in political trust
One of the main purposes of harmonization projects is analysis of the combined survey data, such as the trends in political trust over time. Figure 3 presents average levels of trust in the national parliament per survey for selected countries between 1990 and 2020. Prior to averaging, the values have been rescaled to a common scale by spreading values of scales shorter than 11 points evenly in the range between 0 and 10. These results show that, while within-project trajectories point to roughly the same patterns of declines and increases, the levels differ between projects. The extent to which the individual project trajectories are shifted also varies across countries, with the lines largely overlapping in the case of Czechia, and larger gaps in Finland and Poland. Even within projects, the length of the original scales may be a source of differences, as is the case in EB. Rescaled averages of responses to the trust question with the 10-point scale in EB tend to be lower (and close to means from the 10-point EQLS scale) than those from the usual binary scale. For a more thorough analysis of scale and project effect with regard to political support, see, for example, Valgarðsson and Devine (2021).
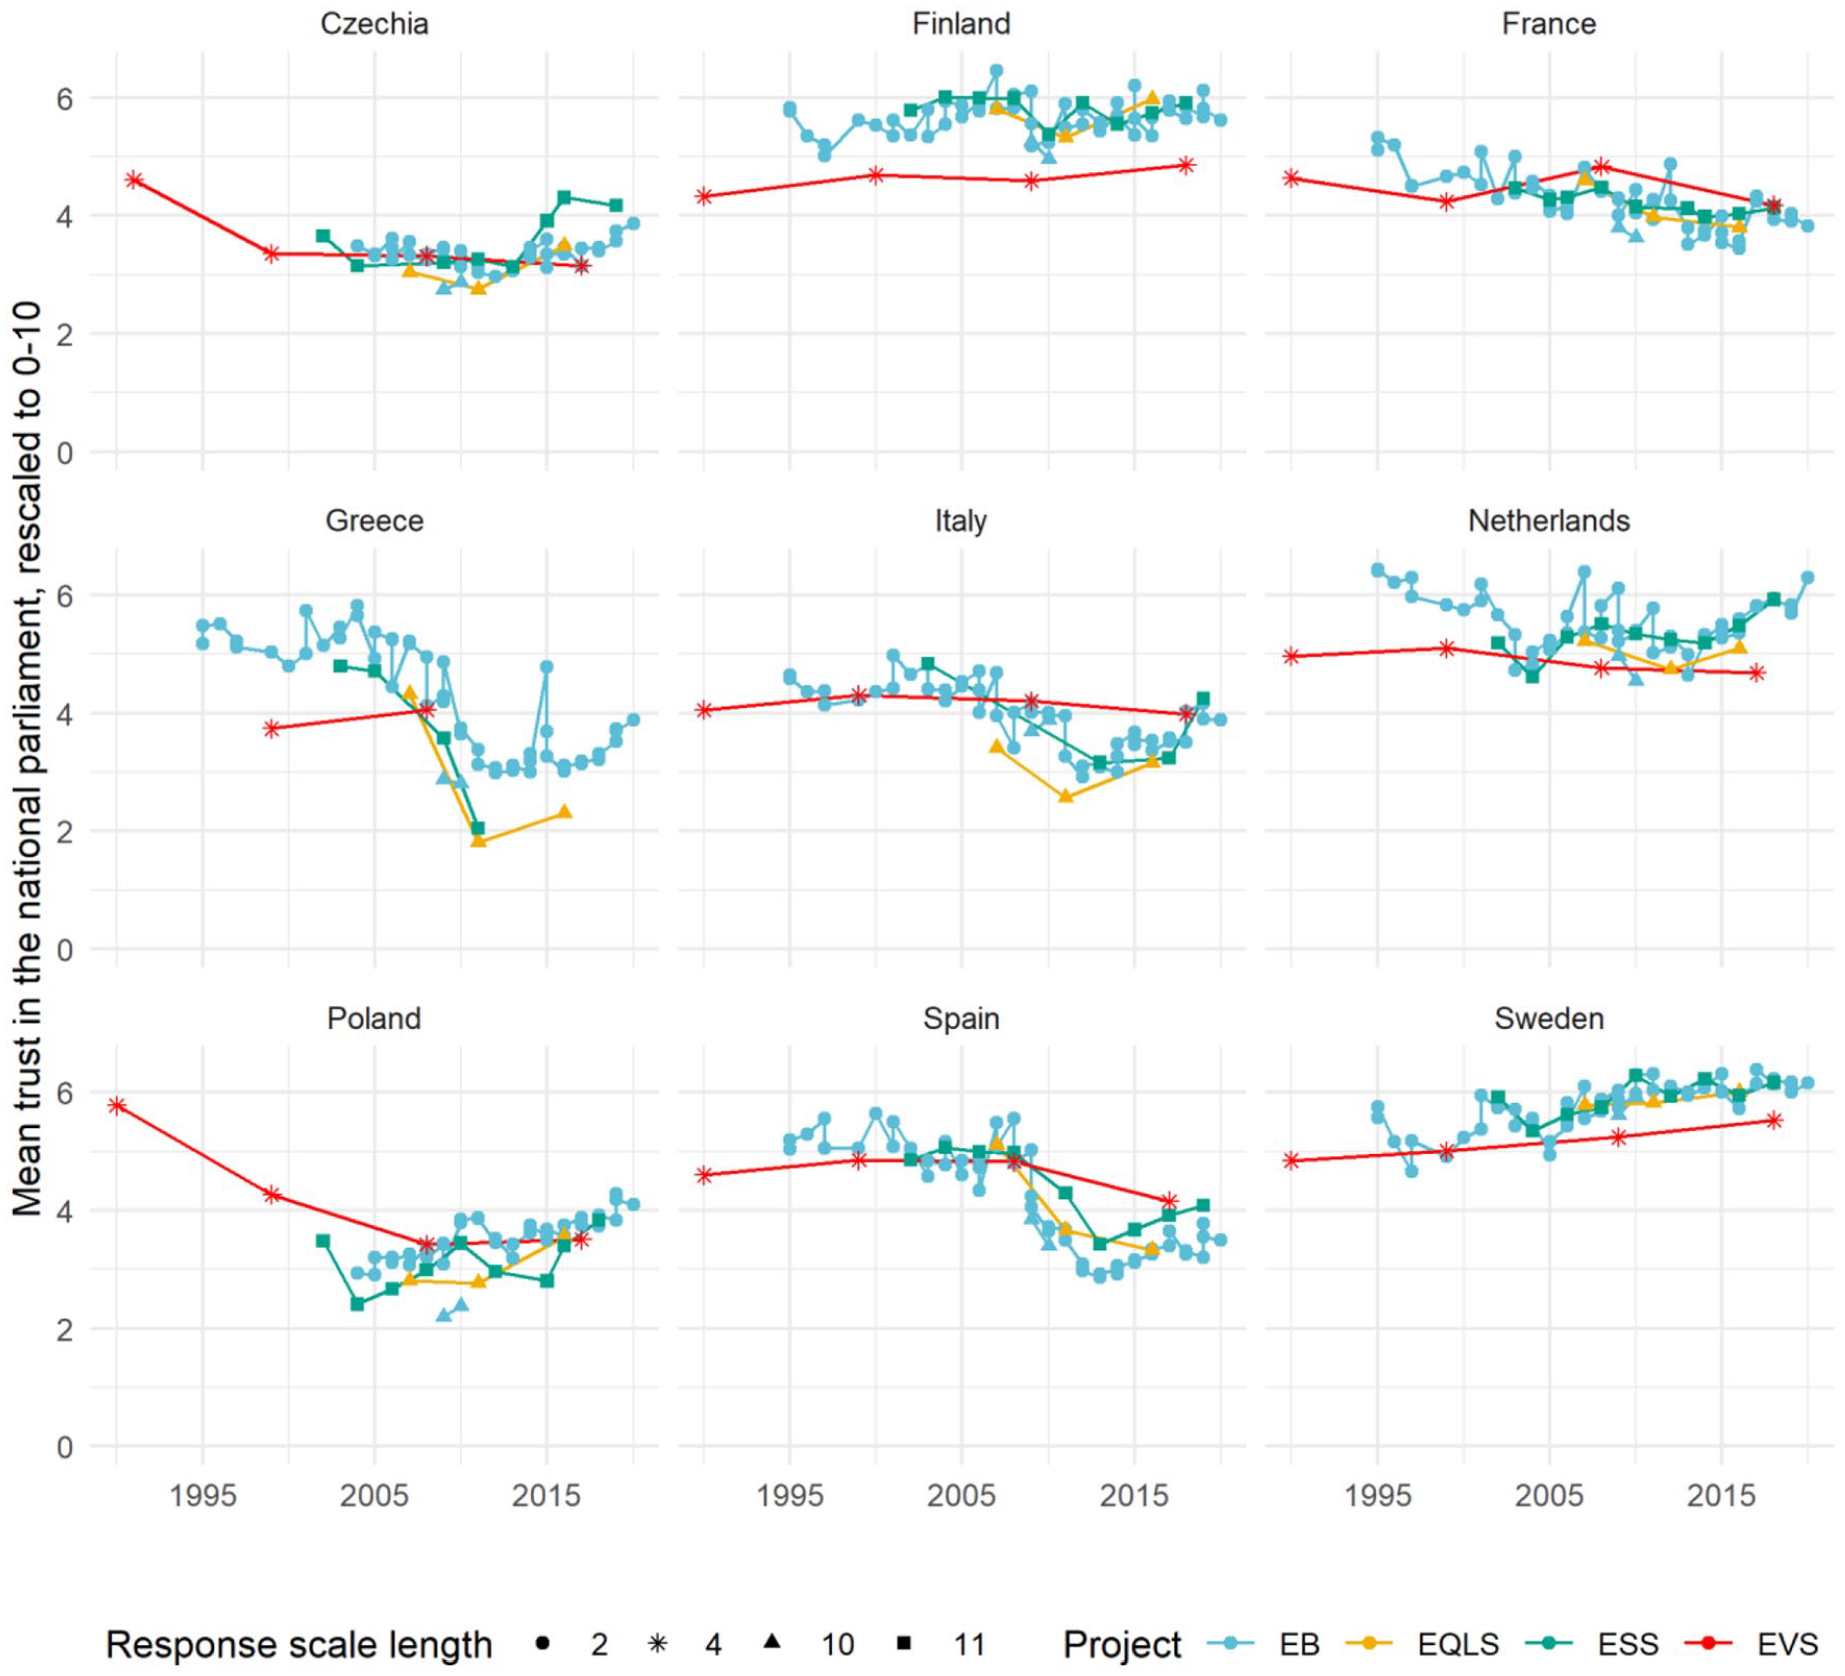
Unweighted sample means of trust in the national parliament in selected countries between 1990 and 2020. The means were rescaled to the 0–10 range. Colors indicate different source projects, while shapes indicate different lengths of original response scales. EB: Eurobarometer; EQLS: European Quality of Life Surveys; ESS: European Social Survey; EVS: European Values Study.
The differences observed in Figure 3 may also stem from differences in sample representativeness, as the present analysis did not use case weights or any other adjustments such as multilevel regression and poststratification (e.g. Park et al., 2004). Thus, when pooling data from different survey projects that feature the same or similar items but different response scales, it is necessary to consider how to take the variation in measurement and in representation into account.
Limitations
The presented approach of documenting data processing naturally has limitations. If the source and target schemas do not unambiguously map onto each other, the need for “intelligent flexibility” (Hillmann and Westbrooks, 2004: 91) arises. One such challenge emerges in the harmonization of ordinal rating scales of different lengths, as in the trust example, where different mapping approaches are possible. In one approach, the target scheme would be the simplest one, that is, a binary scale, and longer response scales in the source data are dichotomized (the midpoints in scales with odd number of points can be either collapsed with one of the two target categories, or discarded as missing data; for an example of the latter application see Valgarðsson and Devine, 2021). Another approach involves rescaling to a common range while keeping all the interim values. In the illustration with trust in institutions, such rescaling was performed to the longest scale in the source data, that is, the 11-point scale while Durand et al. (2021) chose the 7-point scale as the target scheme. A different solution to the harmonization of ordinal scales employs ordinal models that take into account the varying number of thresholds across surveys or projects (e.g. Kołczyńska et al., 2020).
Some situations require workarounds, for example when - in a multi-country dataset - the same values of a variable mean different things in different countries, as is the case with education coding in the early waves of the International Social Survey Programme. The solution would be to create value crosswalks separately by country, and manually transfer the meaning of each value in each country from the survey documentation to the values crosswalk.
Researchers may also want to construct a target variable based on two or more source variables. For example, the target variable “membership in organizations” could be constructed with two source variables corresponding to membership in political organizations and membership in non-political organizations. Cases when two (or more) variables need to be combined into one target variable can be handled by creating interim harmonized variables for each type of membership, and combining them in an additional step of recoding. Situations described above would also have to be dealt with when performing harmonization with recode scripts, which similarly involve recoding on value into another, so they do not constitute drawbacks of crosswalks when compared to scripts.
A different limitation deals with ex-post survey data harmonization in general. Each time a transformation of the source variable(s) is performed, the costs and benefits need to be considered. Since at least the 1940s it has been known that the design of the survey items influences the distribution of respondents’ answers, and—consequently—of sample aggregates, such as means or proportions (Cantril, 1944). In the case of items that are designed as a scale to measure a latent trait, selecting some items of the scale, or changing their coding, may undermine the validity of the scale (Mustillo et al., 2018). While the literature on question and questionnaire design effects is rich and growing, recommendations are typically formulated with regard to best practices in future data collection efforts, not from the point of view of procedures that improve the comparability of already existing data.
Conclusion
This paper proposed a crosswalk-based workflow for harmonizing data from different cross-national survey projects. The procedure includes (1) variable selection, (2) variable recoding, and (3) recording variable and/or survey metadata that are important from the point of view of the given analysis. The workflow based on crosswalk tables for mapping source variables to target variables, and—for selected variables—of source to target values, constitutes an alternative to the thousand-line-long harmonization scripts provided as documentation by recent harmonization projects. Despite its limitations, most of which arguably apply equally to recode scripts, the crosswalk approach has clear advantages. First and foremost, its readability and format promotes transparency and replicability of data transformations in line with principles and recommendations formulated in the recent report on the quality of cross-national survey by the American and World Association of Public Opinion Research (AAPOR and WAPOR, 2021).
Standardized machine-readable documentation based on crosswalks aides collaboration, especially given that the crosswalk-based workflow can be used for recoding variables with any programming language.
Even outside the harmonization context, providing variable-level metadata as tables constitutes a more convenient and machine-readable alternative form of survey documentation to the common PDF codebooks. Such metadata tables can be extended with additional information to enable automated data processing as proposed for the Fragile Families and Child Wellbeing Study (Kindel et al., 2019). Variable metadata tables are also an important resource for secondary data users, as they facilitate exploration and selection of the most suitable data sources (Powałko, 2019).
Footnotes
Acknowledgements
I thank Przemek Powałko for contributing ideas regarding data processing that inspired the workflow described in the present paper, and for his comments on earlier versions of the manuscript. This work builds on experiences of the following projects: (1) Democratic Values and Protest Behavior: Data Harmonization, Measurement Comparability, and Multi-Level Modeling project funded by the (Polish) National Science Centre, (2) New Approach to Analyses of the Relationship between Democracy and Trust: Comparing European Countries Using Quantitative and Qualitative Methodology funded by the (Polish) National Science Centre, (3) Stratified Modernity, Trust in State Institutions and Democratic Change in Cross-national Perspective: Using Harmonized Survey Data from 116 Countries supported by the Silverman Research Support Award from the Department of Sociology, The Ohio State University, and (4) Effects of Status Inconsistency on Political Values, Attitudes and Behavior: A Cross-national Analysis with Survey Data Harmonized Ex-post, funded by the Institute of Philosophy and Sociology, Polish Academy of Science.
Declaration of conflicting interests
The author declared no potential conflicts of interest with respect to the research, authorship, and/or publication of this article.
Funding
The author disclosed receipt of the following financial support for the research, authorship, and/or publication of this article: Grant from the Polish National Science Centre (2019/32/C/HS6/00421).
Replication and supplementary materials
Notes
Author biography
Marta Kołczyńska is an assistant professor at the Institute of Political Studies of the Polish Academy of Sciences. Her research interests include political attitudes and behavior, as well as survey data quality and harmonization.