
Abstract
Rating scales are ubiquitous in the social sciences, yet may present practical difficulties when response formats change over time or vary across surveys. To allow researchers to pool rating data across alternative question formats, the article provides a generalization of the ordered logit model that accommodates multiple scale formats in the measurement of a single rating construct. The resulting multiscale ordered logit model shares the interpretation as well as the proportional odds (or parallel lines) assumption with the standard ordered logit model. A further extension to relax the proportional odds assumption in the multiscale context is proposed, and the substitution of the logit with other convenient link functions is equally straightforward. The utility of the model is illustrated from an empirical analysis of the determinants of respondents’ confidence in democratic institutions that combines data from the European Social Survey, the General Social Survey, and the European and World Values Survey series.
Keywords
Introduction
Rating scales are one of the epitomes of survey research. It is a rare questionnaire indeed that would not incorporate some version of a Likert scale to tap into the intensity of respondents’ agreement with some opinion or statement, ask respondents to rate their happiness or satisfaction with specific domains of their lives, or that supplies respondents with some rating scale to help them express degrees of emotional bonding with particular social groups or sentiments of trust and confidence in others and in societal institutions. The communal feature of all these various forms of rating scales in survey research is that researchers are interested in capturing respondents’ location on some latent dimension. This dimension may often be conceptualized as a continuum of underlying attitudes or beliefs, yet the latent dimension is lacking any natural metric, and hence different locations on the continuum may only be approximated by providing verbal or numerical cues to respondents. These cues then imply an element of gradation—as when it may be presumed that a statement of “strongly agree” corresponds to a higher degree of affirmation than “agree,” or the choice of a happiness score of 8 to convey a higher level of contentment than the choice of a score of 5—but substantial ambiguity inevitably remains as to whether respondents are sharing a reasonably common understanding of the survey stimuli, or whether and when the number of response categories might be sufficiently large and the distance between them sufficiently evenly spaced in substantive terms to permit treating the empirical observations as satisfying a metric scaling level.
In empirical research, such fine-grained methodological discussions often also seem to stem from the fact that the statistical modeling of ordinal data is something like the poor relation of the standard linear or logit regression models that social scientists are extensively familiar with. Applied researchers may be aware of the ordered logit (or probit) model that is extending fundamental principles of categorical data analysis to the case of ordinally scaled dependent variables (see Long 1997:114-47; Cameron and Trivedi 2005:519-21; Agresti 2010, Wooldridge 2010:655-59; Greene 2012:824-32; Hosmer, Lemeshow, and Sturdivant 2013:289-310) or of interval regression models that find application when metric data have been recorded in response categories (e.g., income brackets) rather than as point data in the original metric (e.g., Cameron and Trivedi 2005:532-35; Wooldridge 2010:783-85), but in practice still turn back to more basic models when being confronted with ordinal outcome data. It seems fair to say that most social scientists then routinely either seek to rationalize a metric interpretation, perhaps even explicitly acknowledging the approximation, in order to proceed with using standard linear regression on their data, or resort to identifying specific cutoff points on the ordinal outcome scale from either theoretical or empirical considerations, and then use a standard binary logit (or probit) model to analyze outcomes. And in many instances, these convenience techniques will, in fact, provide pragmatic statistical solutions that result in valid and empirically informative parameter estimates, certainly when judged against conventional inferential standards and against the typical inferential targets in quantitative social science research, where researchers are typically focused on establishing the principal existence and direction of some hypothesized effect, rather than on evaluating any sharply quantified prediction on the magnitude or range of some particular effect on some well-specified metric that would be deemed observationally compatible with a researcher's theoretical model.
Yet even when often well-founded, the social scientist's statistical pragmatism may find its limits. With rating data, an important practical difficulty arises whenever response formats change over time or when they vary systematically across different surveys. In some such cases, it might be possible to devise data harmonization rules from, for example, noting the equivalence of certain verbal cues (“agree” and “fully agree”) that are being provided to respondents to help anchor the response scale and to then analyze the data specifically at those cutoff points or response thresholds that appear being consistently captured over time or across surveys. In other cases, it is possible to achieve data pooling and joint estimation via suitable interval regression modeling, namely when the ordinal response scale may have been merely a data recording tool to either help respondents by providing them with informative categorizations of some underlying continuous metric, or to increase item response rates by permitting respondents to choose between outcome categories (e.g., income brackets) rather than having to disclose point information on the original metric scale; multiple response formats and variability in recording categories are, in fact, straightforward to handle in the interval regression routines of standard statistical packages. Yet in one important class of situations, the applied social scientist is lacking guidance and adequate statistical tools, and that is when response formats evidently differ, when verbal cues are incompatible or unavailable, and when the scaling level is genuinely ordinal at the point of data collection because the construct of interest is lacking any natural metric.
This, of course, is precisely the case of the typical Likert-type survey question that asks respondents to express their degree of agreement with some particular statement, to rate their happiness and satisfaction with different domains of life, or to state their degree of closeness and attachment to some community, political party or organization, where the same question has been asked repeatedly over time or in different countries and places, but where the precise response format of the question may have changed over time or may have varied across surveys and locations. In one survey, respondents may have been asked to rate their happiness on a scale between 1 and 7, the next survey provides a scale from 0 to 10, and yet another may use four response categories that have explicit verbal labels (“excellent,” “good,” “satisfactory,” etc.) attached to them. Or respondents may have been asked to state their degree of confidence in some public institutions, yet the survey was initially using a 5-point Likert scale, then switched to an 11-point scale in some later wave, and yet another version of the questionnaire may have experimented with using a small number of verbal cues as response categories. In these and other similar constellations that frequently arise in survey research, it would be attractive to be able to pool and analyze the rating data across question formats in order to either simply increase statistical power or, perhaps more importantly, to obtain the required leverage to address broader substantive questions on, for example, historical changes or cross-country differences in outcomes and processes that cannot be addressed by using the original data sources in isolation. Yet because the rating scales in question lack any natural metric, data pooling may seem impossible or may at least seem to require that researchers be prepared to accept an inevitable degree of arbitrariness in whatever data harmonization rules they may choose to adopt. As a more principled alternative, however, it is also possible to generalize the standard ordered logit model to accommodate the presence of multiple rating scales that capture a common latent index, and to thereby resolve the apparent incommensurability of alternative response formats. In the remainder of this article, I present and discuss the resulting multiscale ordered logit model, and then illustrate its practical utility in an empirical analysis of the relationship between income inequality and citizens’ trust in democratic institutions that draws on survey data from the European Social Survey (ESS), the General Social Survey (GSS), and the European and World Values Survey (EVS/WVS) series.
A Generalized Ordered Logit Model to Accommodate Multiple Rating Scales
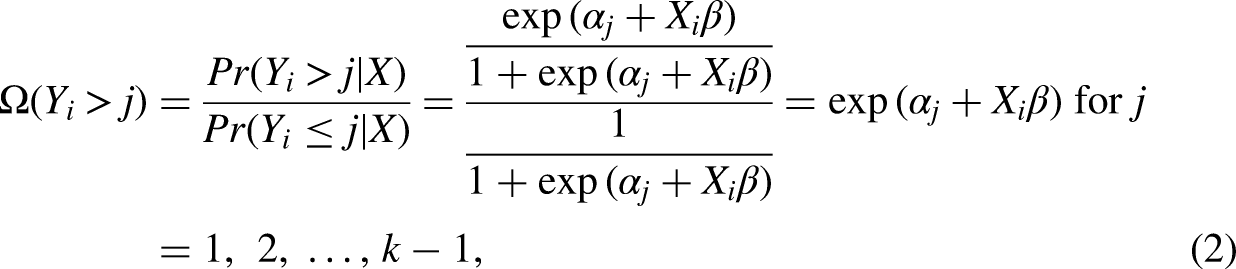
Although various alternatives exist (see Agresti 2010:44-117; Fullerton 2009; Fullerton and Xu 2016; Hosmer et al. 2013:289-310), it is the so-called proportional odds model that is conventionally seen as the standard logit model for ordered outcome data (e.g., Cameron and Trivedi 2005; Clogg and Shihadeh 1994; Long 1997; McCullagh 1980; Williams 2006, 2016). Besides retaining the straightforward interpretation and other features of the well-known logit model for binary outcome data, the proportional odds model rests on conceptual foundations that align with the typical use of rating scales in social science surveys, and it will therefore also serve as the natural starting point for the proposed extension to a multiscale version of the model that is capable of accommodating the presence of multiple rating scale formats in the data at hand. The proportional odds model itself may be conveniently written as the threshold model


As a modeling device, the parallel regression assumption has the powerful implication that the structural component My experience suggests that the parallel regression assumption is frequently violated … When the assumption of parallel regressions is rejected, alternative models should be considered that do not impose the constraint of parallel regressions (Long 1997:145), A key problem with the parallel-lines model is that its assumptions are often violated; it is common for one or more β's to differ across values of j; i.e., the parallel-lines model is overly restrictive (Williams 2006:60) and The use of an ordered logit model when its assumptions are violated creates a misleading impression of how the outcome and explanatory variables are related (Williams 2016:11),
Upon closer inspection, this widespread attitude as well as the implicit conflation of the two notions of “violated assumption” and “flawed model” it rests upon are quite misplaced, however. As can be seen from the latent variable formulation of the proportional odds model in equation (4), the effect of any covariate x implies nothing but a location shift along the underlying attitude or rating continuum. Equation (4), in other words, is thus nothing else than a categorical data analog of the standard modeling assumption made by any researcher who decides to fit a linear ordinary least squares (OLS) regression. Like in any OLS regression, the proportional odds model can thus be understood as a regression model for the central tendency of the latent outcome distribution, except that the outcome
But this then is nothing like any inherent “failure” of the ordered logit model, and it clearly is something very different from the model being seen as “misrepresenting” how the outcome and explanatory variables are related. The proportional odds model (often) “misrepresents” the data in the exact same way that an OLS regression is “misrepresenting” it: both models focus on the central tendency of the outcome distribution and provide a linear regression model for it. Sometimes this is exactly what a researcher wishes for, because she may have a hypothesis to test on some average group difference in outcomes. In other cases, the researcher might have more encompassing descriptive interests or her hypothesis might be more complex because it relates (also) to a group difference in the variance of the outcome distribution or specifically to a group difference in one of the tails of the outcome distribution, and then standard OLS would be inadequate and the researcher would better turn to more appropriate (conditional) quantile regression models (e.g., Koenker 2005; Koenker, Chernozhukov, He, et al. 2020), to (co)variance function regression techniques (e.g., Bloome and Schrage 2021; Western and Bloome 2009) or to other types of location-scale models (e.g., Hedeker and Nordgren 2013; Leckie, French, Charlton, et al. 2014). But in neither case would anyone ever consider faulting the OLS regression model for principally “creat[ing] a misleading impression of how the outcome and explanatory variables are related” (Williams 2016:11). Instead, one would simply note that some inferential task is beyond standard OLS regression, and then apply one of the readily available extensions of the basic model in the empirical analysis. Tellingly, the surging interest in examining various types of heterogeneities in the relationships between purported causes and effects has been accompanied by a very visible increase in the use of quantile regression and related models to ascertain not just the association between a covariate and the mean outcome, but also group differences in the shape (or variance) of the entire outcome distribution (e.g., Cheng 2014; Ebner, Kühhirt, and Lersch 2020; Lersch, Schulz, and Leckie 2020; VanHeuvelen 2018a, 2018b).
Seen in this light, what is usually perceived as a disadvantage and an “overly restrictive” nature of the ordered logit model (and its probit cousin), is actually a powerful feature of key interest to substantive research. For the specific case of ordinally recorded outcome data that can be understood as an imperfect measure of some underlying continuous index, that is for the typical case of rating and other attitude data common in survey research, the proportional odds model is an elegant approach to model the central tendency of the outcome variable conditional on covariates and the assumption of a linear regression function. It is thus an analog to the standard OLS regression, except that there also is a generalized ordered logit model to relax the parallel regression assumption when required (see Fullerton and Xu 2016; Long 1997; Williams 2006, 2016), and several formal statistical tests are available to ascertain whether employing the generalized model may be indicated by some systematic signal in the empirical data (again, see Long 1997; Fullerton and Xu 2016:109ff.; Williams 2006, 2016; Brant 1990 for the well-known specification test). But the relation between the proportional odds model and the generalized ordered logit model certainly is not one between a “failure” and an “appropriate” model, but instead between a model that exclusively focuses on establishing group differences in the location of the conditional outcome distribution and an alternative model that simultaneously addresses group differences in the central tendency and in the spread (i.e., in the shape as well as the location) of the distribution. Clearly, the suitability of choosing one over the other is not a principal matter, but one of the research priorities, substantive questions, and specific hypotheses—and unlike in the case of standard OLS regression, the ordered logit model even provides a unified framework for conducting either type of analysis.
Against this background, it may have become plausible why, despite much textbook criticism, the proportional odds model is nevertheless taken as the starting point for proposing a natural extension of the ordered logit model to a multiscale setting. Indeed, it is precisely because of the assumption of parallel regressions and the associated equivalence of the model's structural component
An Empirical Illustration: Explaining Confidence in Democratic Institutions
Citizens’ trust in the institutions of government of course is a main pillar of any democratic order, and its study of consequently significant interest to the social sciences. Unsurprisingly, social science surveys regularly field questions that ask respondents to indicate how much confidence they have in specific institutions or branches of government, and provide them with different rating scale formats to express their degree of trust. For the purpose of providing an illustration of the multiscale ordered logit model, one may note that high-quality and nationally representative surveys like the ESS (European Social Survey 2018–2021), the GSS (Smith, Davern, Freese, et al. 2019), and the EVS/WVS (European Values Study 1981–2017; Inglehart, Haerpfer, Moreno, et al. 2014) series all contain respective items to solicit respondents’ sense of trust in various democratic institutions. And especially when interested in exploring contextual determinants of citizens’ trust in institutions, it would be attractive to be able to pool data across these various survey sources in order to increase empirical variation in institutional, societal, or macroeconomic conditions, and to thereby enhance a study's analytical leverage by fully exploiting the geographical or historical coverage of the available survey data.
Yet, unfortunately, as question formats differ significantly across surveys (see Online Appendix 2 for the original question formats in the ESS, EVS/WVS, and GSS series), it is far from self-evident how to best do that and how to achieve consistent data integration and valid data harmonization. In the EVS/WVS series, for example, respondents are asked to state whether they might have “a great deal” of trust, “quite a lot,” “not very much,” or “none at all,” the ESS employs an 11-category rating scale, but only provides verbal anchors at either extreme of the scale (i.e., by linking the bottom category to the description of “no trust at all,” and the top category to indicate “complete trust,” but omitting any verbal cues in between), and the standard GSS question format allows respondents to distinguish whether they feel “a great deal,” “only some,” or “hardly any” confidence in public institutions (and still further variations exist, as the GSS has over the years occasionally tested alternative response formats in split-sample experiments, for example). Confronted with this reality of technical variation in survey instruments, the ordinary response is that researchers either give up on the attempt of pooling the data entirely or that they are forced to bend over backwards in order to rationalize some particular data harmonization rule they may choose to adopt—for example, is the GSS category of having “only some” confidence referring to the same stimulus as the ESS/WVS category of “not very much” or might it not be closer to “quite a lot” of trust after all, and if so, which numbers from the 0 to 10 ESS rating scale might exactly reflect any of these verbal labels?—only to invariably find their statistical results to be questioned due to the inevitable arbitrariness involved in adopting any of several mildly plausible harmonization rules, and to perhaps eventually have their work accepted by peer reviewers and fellow researchers after demonstrating in extensive robustness checks that running the regression analyses under all the various harmonization rules that may claim some plausibility does not critically affect the main result a researcher wishes to report.
The purpose of the present article is to introduce the multiscale ordered logit model as a principled alternative to resolve the issue, and to permit standard regression modeling of the pooled data without requiring the analyst to resort to second-best data harmonization rules and all the smaller or larger degree of arbitrariness they may involve. To illustrate the working of the model more concretely, I now turn to an analysis of citizens’ trust in the national parliament that seeks to characterize the empirical association between trust and respondent characteristics like gender, age, and level of education on the one hand, as well as between trust and the macroeconomic environment described by a country's level of economic prosperity (i.e., GDP per capita) and it's level of economic inequality (as indexed by the Gini coefficient of household equivalent disposable incomes) on the other. I conduct this analysis specifically for 2018, as biannual ESS data collection efforts are scheduled in even years and as the timing coincides with the 2017–2020 wave 7 of the WVS data collection and wave 5 of the EVS data collection that is coordinated with the larger WVS enterprise. Besides ensuring the principal availability of high-quality survey data for the period, the choice of focus on citizens’ trust in 2018 is both slightly artificial and chosen for a strategic reason. Restricting the analysis to a single year of course is artificial insofar as more data is readily available in the original surveys, and as few analysts would therefore wish to limit their substantive research to some more restricted setting than the available survey data would easily afford. Yet over and above the practical goal of keeping the subsequent demonstration exercise reasonably parsimonious, the strategic element in the particular choice is that the data collection for the U.S. part of the WVS series had already happened in 2017. So, if it was the case that the (hypothetical) analyst truly wished for an international perspective on citizens’ trust in the national parliaments in 2018 specifically, then she would need to bring in GSS data in order to keep the United States in the sample, as the GSS, like its ESS equivalent, is fielding its biannual data collection in even years. Yet doing so is inevitably upping the methodological stakes further, as bringing in the GSS data implies that the researcher has to deal not just with two, but actually with three different response formats to measure the same dependent variable.
Different responses to tackling the challenge, and the differences in empirical conclusions they imply, may be inferred from Tables 1 and 2, which provide estimates from alternative regression models that may have been applied in practical research and that may be contrasted with the findings from a multiscale ordered logit model that manages to unite all the available survey data under a single regression specification, despite the differences in response formats in the source data. Specifically, the parameter estimates for this multiscale ordered logit model are the ones given as specification M1 in Table 1, and this model will be the focal point of comparison relative to other types of regression analyses that might plausibly have been conducted. True to purpose, model M1 is the regression specification that is utilizing the full sample of N = 75,561 valid ESS, EVS, GSS, and WVS interviews that have been conducted in 2018, where respondents have provided a statement on their degree of trust in the national parliament as well as data on their gender, age, and level of education, and where information on a country's level of economic prosperity and level of economic inequality could be obtained by merging data on previous-year (i.e., 2017) GDP per capita and on the previous-year Gini coefficient from the World Development Indicators (WDI, World Bank 2021) and the Standardized World Income Inequality Database (SWIID, Solt 2020), respectively. The resulting sample pools data from 44 countries and 52 national surveys, and the ESS, EVS, and WVS source surveys each contribute roughly a third of the overall sample. More specifically, more than 26,000 cases from 21 European countries result from interviews that have been conducted in 2018 under the umbrella of the ESS round 9, another 23,000 interviews from 15 European countries stem from wave 5 of the EVS series, some 24,500 respondents have been surveyed in another 15 non-European countries in 2018 under the WVS wave 7, and a final sample of 1,500 U.S. respondents can be drawn from the 2018 GSS. Eight European countries—namely, Austria, Germany, Estonia, France, Italy, Norway, Serbia, and the United Kingdom—contribute independent samples from the ESS as well as the EVS to the present analysis, which explains why the number of N = 52 national surveys is exceeding the maximum number of N = 44 countries.
Macroeconomic and Demographic Determinants of Trust in the National Parliament Under Alternative Ordered Logit Model Specifications.
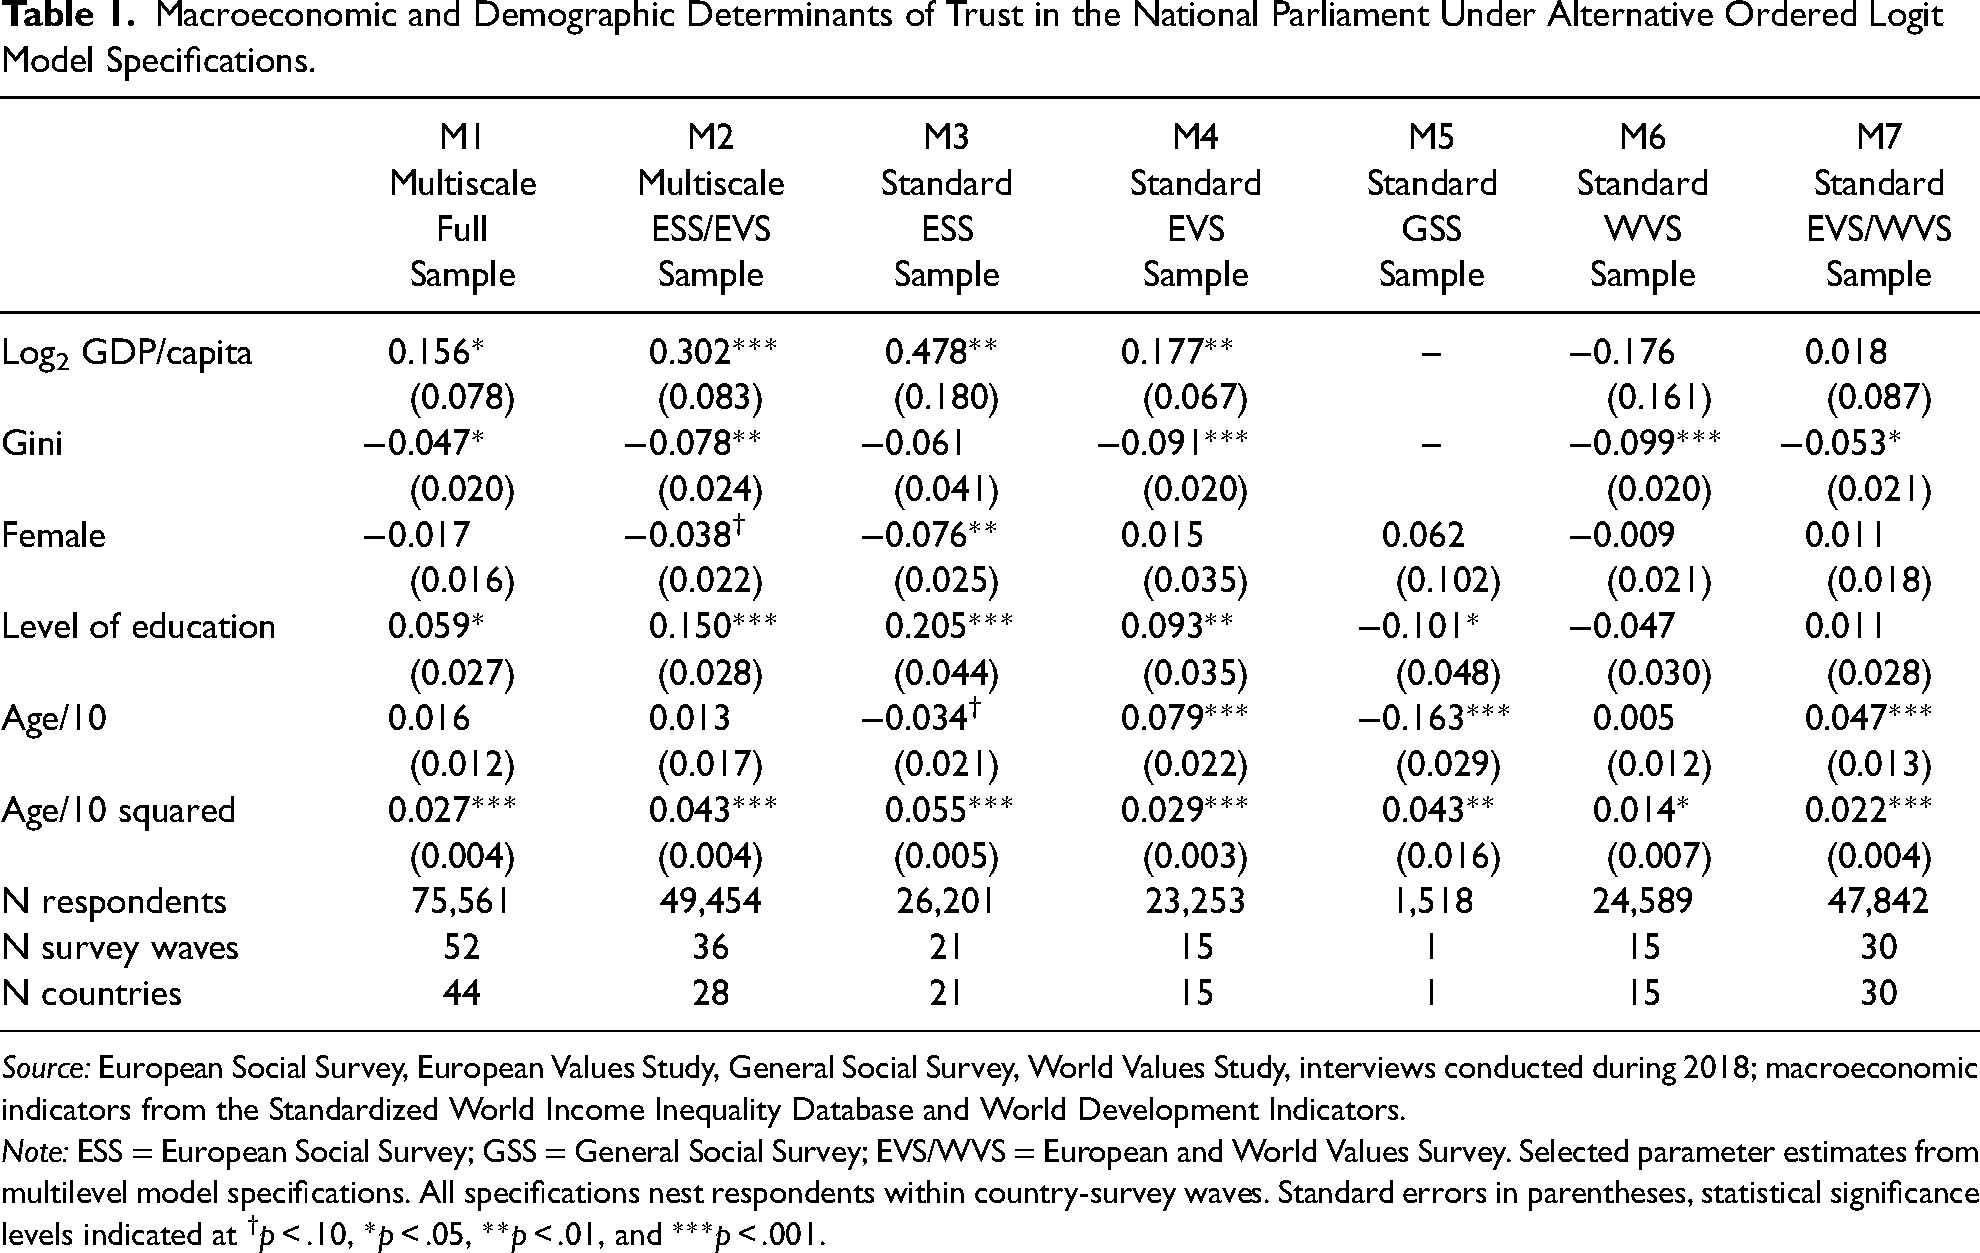
Source: European Social Survey, European Values Study, General Social Survey, World Values Study, interviews conducted during 2018; macroeconomic indicators from the Standardized World Income Inequality Database and World Development Indicators.
Note: ESS = European Social Survey; GSS = General Social Survey; EVS/WVS = European and World Values Survey. Selected parameter estimates from multilevel model specifications. All specifications nest respondents within country-survey waves. Standard errors in parentheses, statistical significance levels indicated at †p < .10, *p < .05, **p < .01, and ***p < .001.
Macroeconomic and Demographic Determinants of Trust in the National Parliament Under Alternative Data Pooling and Standard Regression Specifications.
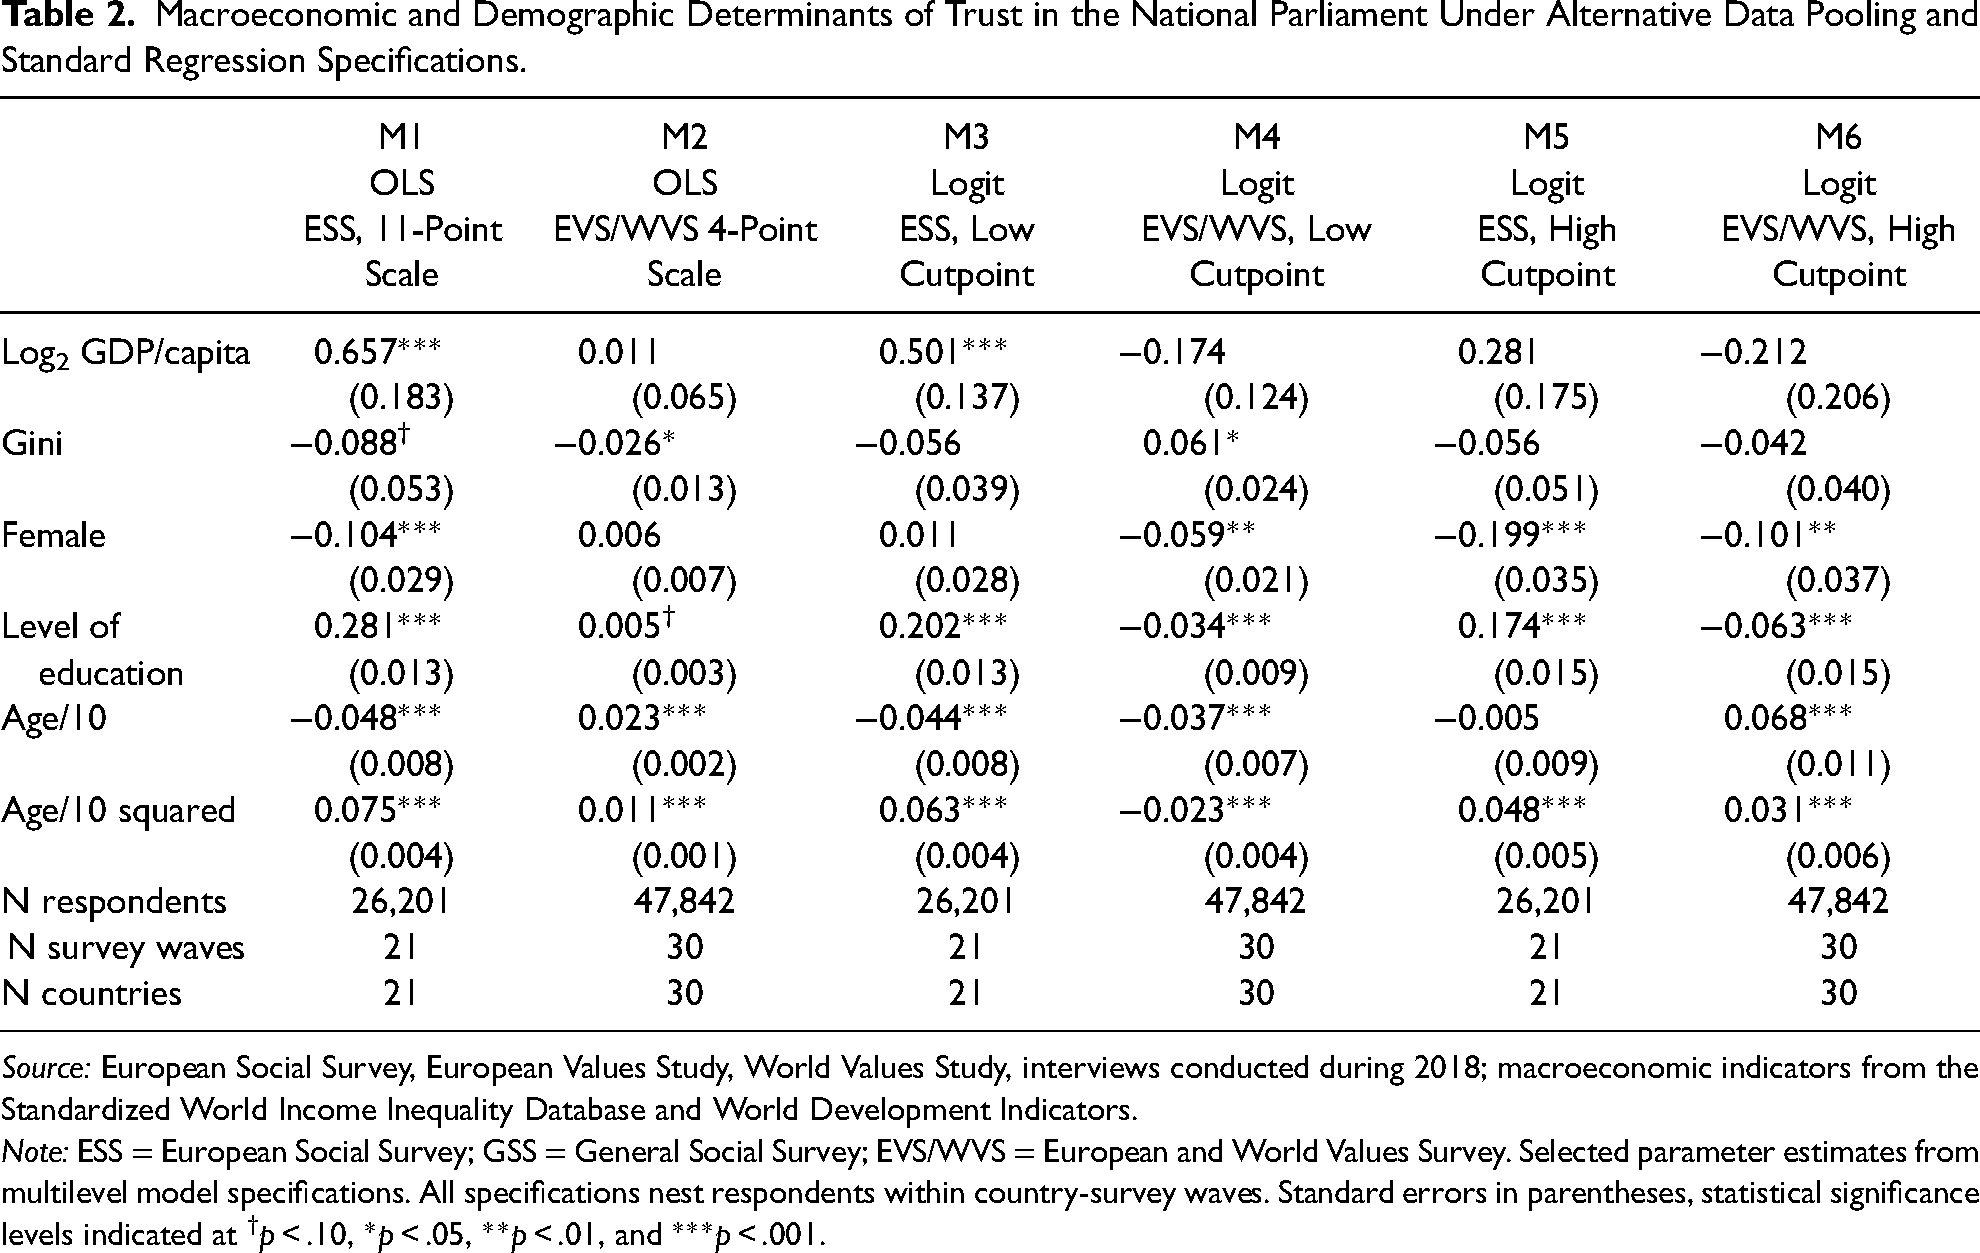
Source: European Social Survey, European Values Study, World Values Study, interviews conducted during 2018; macroeconomic indicators from the Standardized World Income Inequality Database and World Development Indicators.
Note: ESS = European Social Survey; GSS = General Social Survey; EVS/WVS = European and World Values Survey. Selected parameter estimates from multilevel model specifications. All specifications nest respondents within country-survey waves. Standard errors in parentheses, statistical significance levels indicated at †p < .10, *p < .05, **p < .01, and ***p < .001.
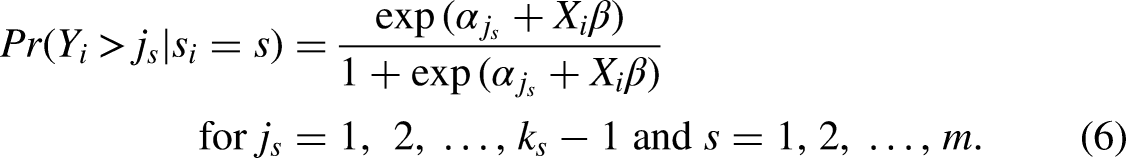
To respect the hierarchical structure of the data, that is, the fact that survey respondents are clustered within countries, I actually expand on the earlier presentation of the multiscale ordered logit model by estimating its multilevel version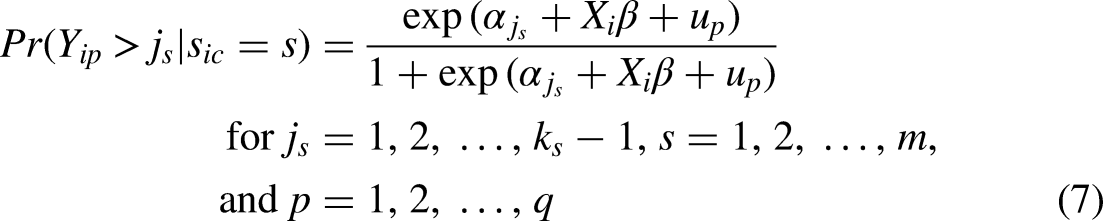
From these preludes, it is easy to summarize the substantive evidence from the multiscale regression specification M1 as indicating that macroeconomic context as well as citizens’ socio-demographics matter for trust in parliament. More specifically, the effect of GDP/capita on trust is positive, while high levels of economic inequality clearly depress citizens’ trust in a core democratic institution like the national parliament. On the micro level, gender differences between male and female citizens tend to be very small on average, but higher levels of education lead to clearly higher levels of trust in the parliamentary institutions of democratic governance. The age effects indicate a U-shaped pattern of association with democratic trust, with the lowest levels of trust being found among citizens in their mid-forties, ceteris paribus. 3 And of course, as is true in any cross-sectional sample, what is reported as an age effect here is likely to reflect some mixture of true life-cycle and true cohort effects, but the fundamental identification problem at the heart of any age-period-cohort (APC) model, of course, does not allow to undertake any empirically grounded attempt to distinguish between and quantify the relative importance of either temporal source of political trust—nor would any such attempt be required in the present context of a purely descriptive and associational analysis done for demonstration purpose.
Instead, the characteristic achievement of the multiscale ordered logit model emerges when comparing model M1 against some more standard alternatives. Absent the multiscale specification, it would of course have been possible to fit the standard, single-scale ordered logit model on the data, or at least on those parts of the sample that originate from the same source survey and therefore share the same question format in data collection. Estimates from respective specifications are provided as models M3–M7 in Table 1, each fitting a standard ordered logit model on data from one of the original survey sources or, in the last specification M7, on pooled EVS/WVS data that share the same response format for the political trust question. When eyeballing the parameter estimates across the different models, it is evident that some quite significant heterogeneity is apparent in the determinants of citizens’ trust across surveys and localities—and that the estimates obtained in the multiscale specification M1 provide something like the average over the different source surveys and over the whole sample of respondents. The effect of education, to take one example, is positive in the European data, but more so in the ESS sample than in the EVS one, but negative in the WVS sample, and quite negative in the GSS—and the multiscale parameter estimate of
And this exact same pattern gets repeated if one was to compare the multiscale estimates based on the two European sources (i.e., model M2) to those obtained from fitting standard ordered logit models on the ESS and EVS source data separately (i.e., to models M3 and M4)—and of course this is precisely the behavior that is to be expected from any regression model. It is a very basic regression methodology to understand that any regression coefficient reflects the (weighted) average association between X and Y among the sample observations, and so fitting a regression model on some pooled data will inevitably result in parameter estimates that represent the weighted average of the corresponding coefficients from the series of identical models fitted on separate (and non-overlapping) partial datasets in isolation, and these parameter estimates will typically be more precisely estimated (i.e., exhibit lower standard errors) because of the larger sample brought to the task. And it is in this exact sense that the proposed multiscale specification of the ordered logit model is shown to “work” as it should by the evidence in Table 1. It is a regression model that allows to pool rating data and that provides an estimate of the (weighted) average association between X and Y in the full sample, despite differences in response formats across source surveys. 4 The multiscale model, in other words, substitutes a principled statistical model for any informal eyeballing that a researcher otherwise might wish to execute when trying to summarize rating scale evidence obtained from different samples and across different question formats.
The benefits of adopting this type of principled approach should also be self-evident when comparing the multiscale ordered logit model to some more traditional convenience alternatives that are often being adopted to avoid the ordered logit model altogether. Table 2 provides some examples, and thereby helps further illustrate their downsides relative to the main multiscale model (i.e., model M1 in Table 1). In applied research, social scientists often use standard OLS on rating data, and defend the practice by noting that substantive results more often than not tend to align with those of the ordered logit model. The same pattern is evident in the current analyses, as the linear regressions of M1 and M2 in Table 2 effectively mirror those of the corresponding ordered logit models M3 and M7 in Table 1 as far as the direction and statistical significance of the different effects are concerned. 5 But unlike with the ordered logit model, standard linear regression does not offer any constructive way forward when data pooling across different response formats may be desired. It is of course possible to adopt a rule-of-thumb harmonization protocol by, for example, distributing the four EVS/WVS response categories “evenly” across the 11-category ESS format in order to achieve data integration across these series, but whether that rule may have some empirical foundation or whether this amounts to a forced data pooling based on an entirely arbitrary methodological choice cannot adequately be decided.
Similarly, it would in principle be possible to define specific thresholds of the outcome variable that are of particular interest and then fit a standard binary logistic regression on the data, this approach would provide for a more intuitive interpretation of the resulting parameter estimates that is preferred by many social scientists over the linear model or the latent variable interpretation of the ordered logit model, but it would also not provide a constructive way forward to achieve valid data harmonization. Models M3–M6 are illustrations of the point, as these report the estimates from two logit model specifications that focus on the lower and the high end of the trust distribution, respectively, and that have each been fitted separately on the ESS and EVS/WVS data. These estimates on the one hand reflect similar substantive differences between the determinants of trust in the ESS and EVS/WVS samples and provide some empirical indications that associations between covariates and trust may indeed not be constant across the entire outcome distribution on the other—a topic to which I return in the next section—, but do not permit to answer the key question about the validity of pooling the data. Is, for the lower-tail models M3 and M4, a cutoff value of 4 on the ESS scale a good equivalent to respondents stating to have “not very much” trust on the EVS/WVS item, so that pooled analysis would be defensible? Is the ESS cutoff value of 8 about the same high level of political trust as expressed by EVS/WVS respondents who state having “a great deal of” trust in parliament?
Compared with these unanswerable questions, it may be instructive to consider how the multiscale model addresses the comparability issue by effectively sidestepping it. Seen from the starting point of a latent continuous variable that is being imperfectly observed via the (ordered) categories of some particular rating scale employed in some specific survey, the multiscale model is nothing but an extension of the standard ordered logit model that allows for the presence of multiple sets of scale location points in estimation, with one set of cutoff points corresponding to each type of question format. The empirical locations of the different cutoff points
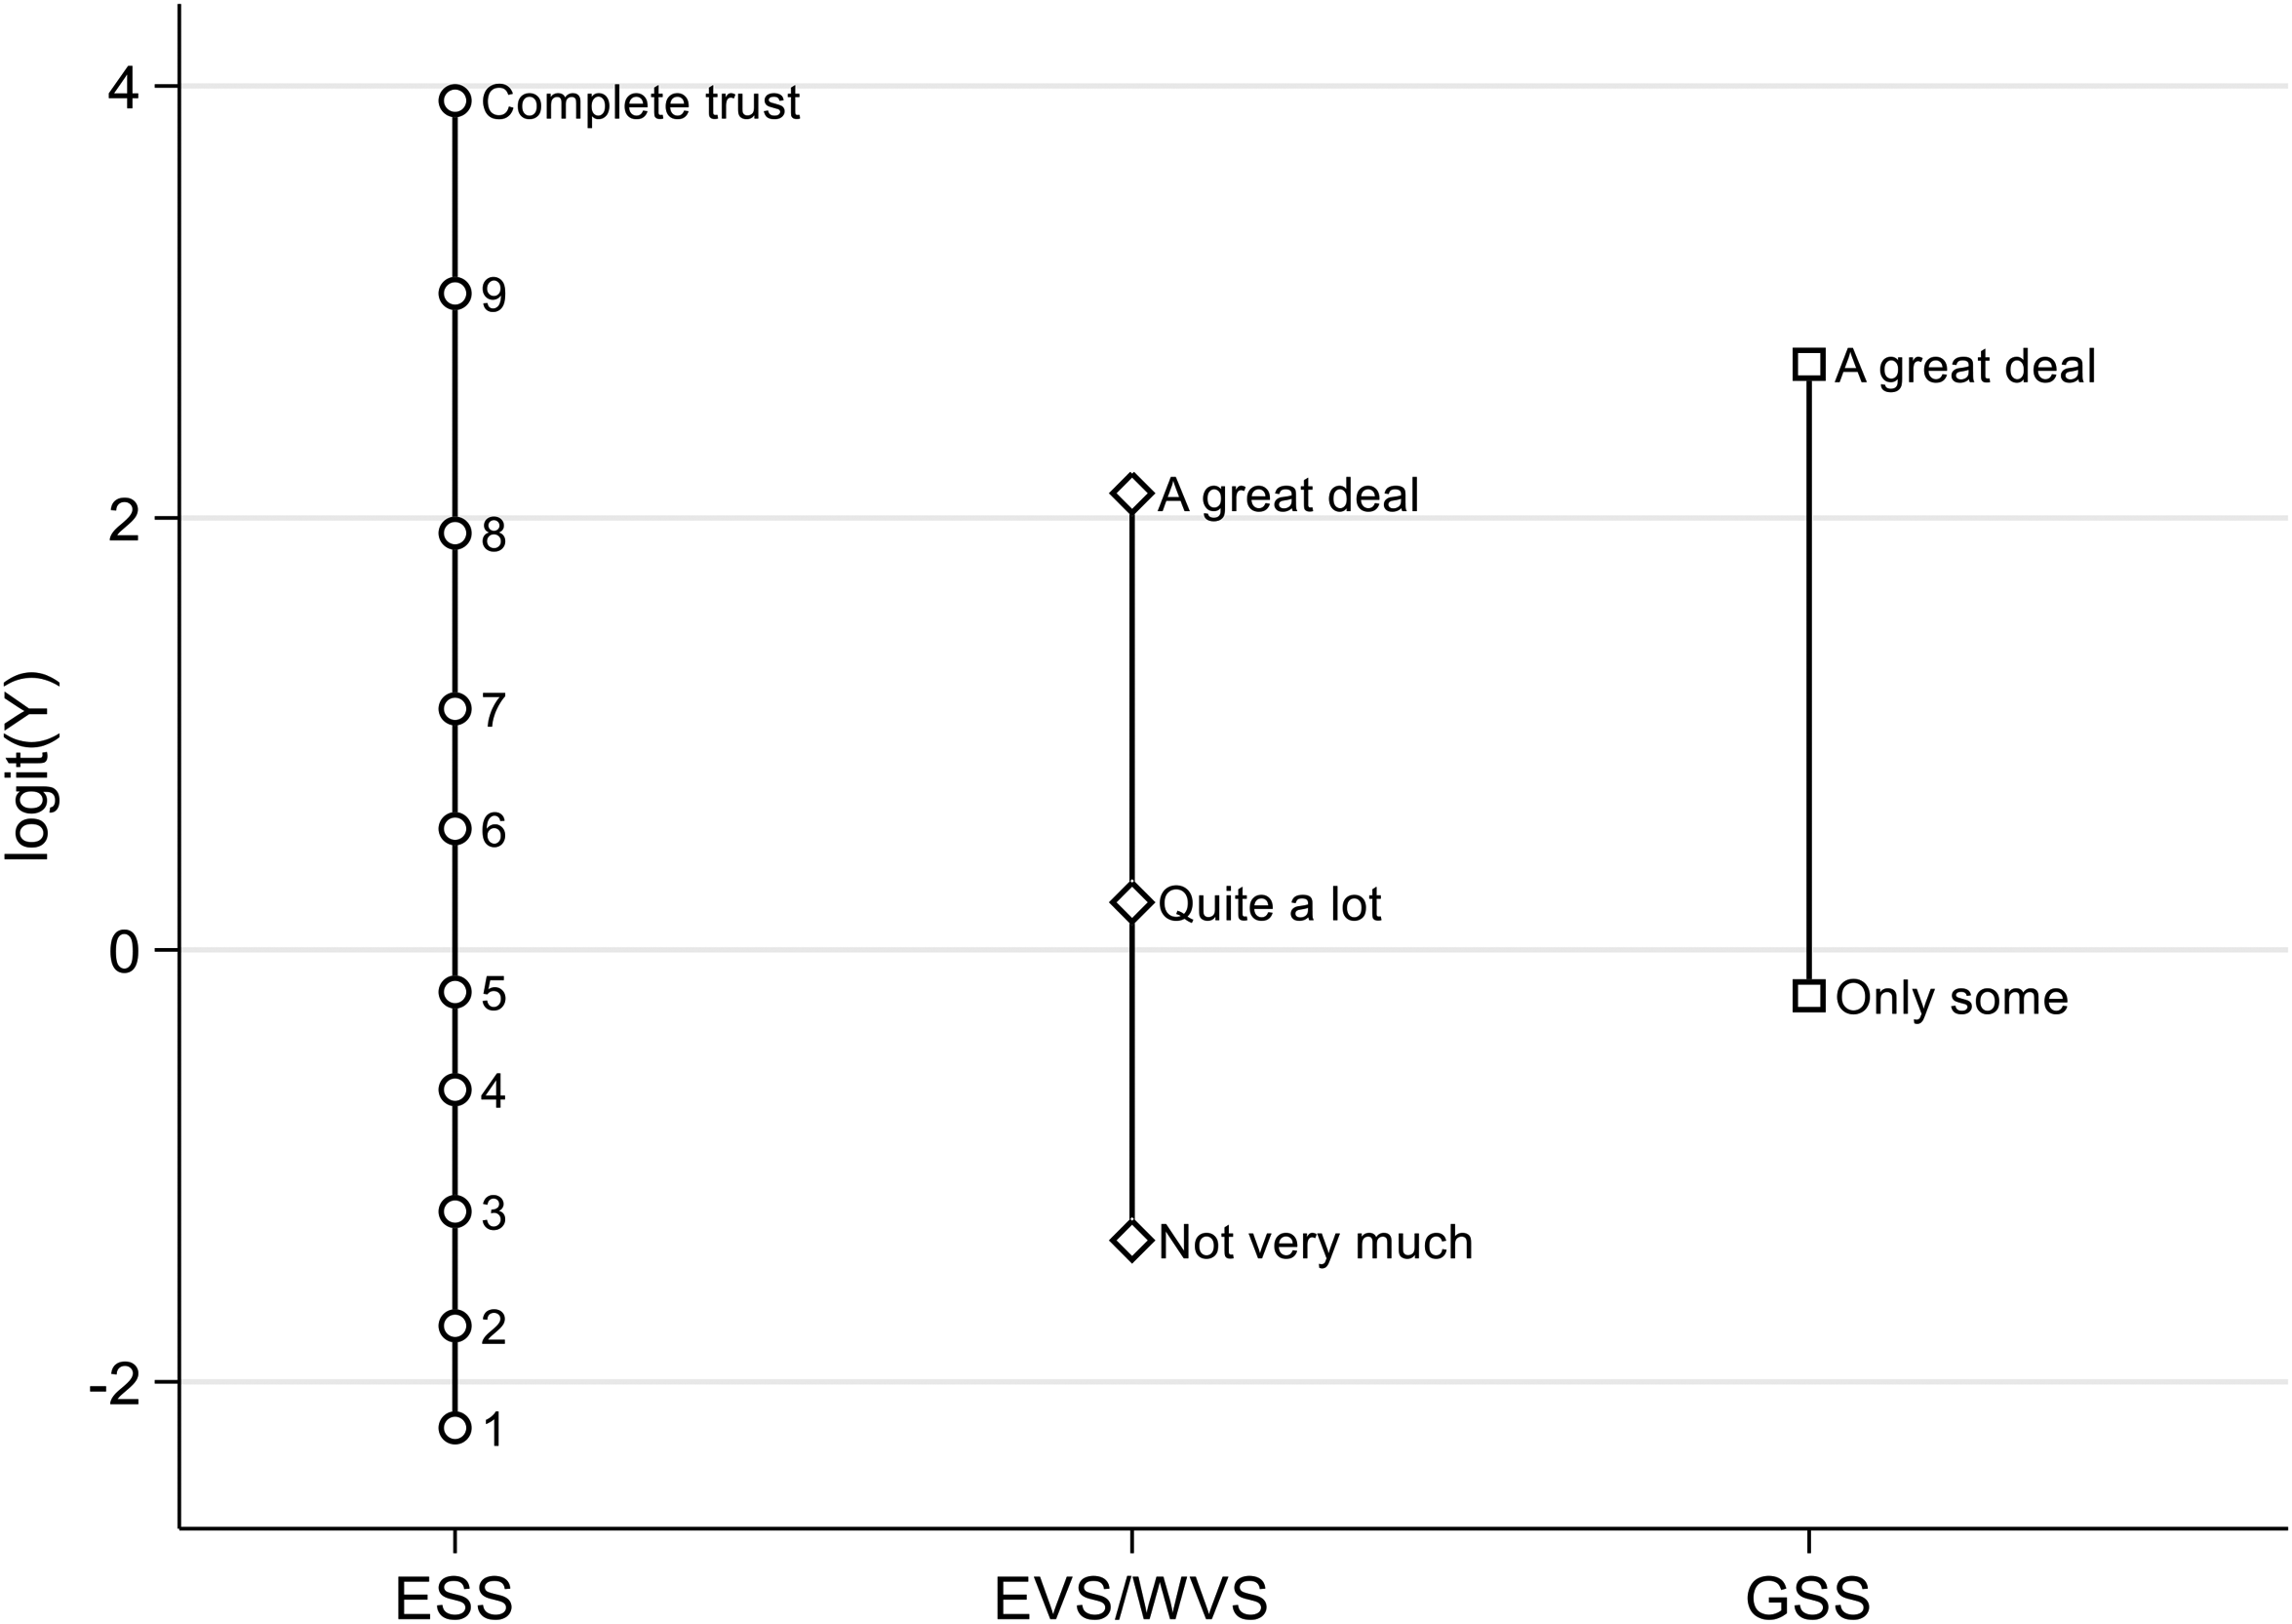
Estimated cutpoint locations for the ESS, EVS/WVS, and GSS response formats to express trust in the national parliament. Note: Inverted cutpoint estimates
From these, it is readily apparent how the multiscale specification is implicitly answering the earlier rhetorical questions: first, on the high end, the ESS cutoff value of 8 indeed seems to index pretty much the same intensity of trust as the verbal stimulus of “a great deal” of trust in the EVS/WVSs. But, second, on the low end, the ESS cutoff value of 4 does not seem to correspond to the EVS/WVS's verbal stimulus of having “not very much” trust. Instead, it rather is the ESS cutoff value of 3 that matches the EVS/WVS location of having “not very much” trust quite well, and Figure 1 then also suggests that the EVS/WVS category of expressing “quite a lot” of trust does not have its ready ESS equivalent, but is sitting somewhat uneasily between values 5 and 6 on the ESS scale.
But that said, it is also important not to mistake the evidence of Figure 1 for a suggestion of some substantive and empirically-grounded harmonization rule that might or that even should have been adopted by the researcher. Instead, the multiscale model is better characterized as sidestepping the question of any substantive equivalence of response categories across different rating scales by combining a methodologically entirely relativist position on the “meaning” of any single response category with an additive model where the same structural component
Yet of course, these estimated cutpoint locations
In the context of this current and slightly artificial analysis, it would thus not be possible to turn to the multiscale ordered logit model to answer the substantive question of whether U.S. citizens are less trustful of democratic institutions than the citizens of other countries, because the demonstration exercise has been strategically chosen to involve a perfect correlation between country and response format in the U.S. case. Hence, there is no extra degree of freedom available to estimate a country-fixed effect and the cutoff locations
Relaxing the Parallel Regression Assumption in the Multiscale Ordered Logit Model
At this point, readers may agree with the perspective that it is possible to extend the ordered logit model to a multiscale setting, while retaining a modeling framework that is well-known to social scientists and that affords flexible ways of interpreting the resulting parameter estimates either in terms of covariate effects on an underlying latent and continuous outcome or in terms of odds ratios or probability differentials of crossing specific response thresholds. At the same time, readers may likewise feel the multiscale model to still be overly restrictive insofar as it of course also shares the critical parallel regression assumption with the standard ordered logit model. And even as some criticism of that assumption may itself be rather regarded as being based on a misapprehension, there is merit in the principal insistence on methodologies that permit researchers to adequately examine issues of dispersion and (treatment) effect heterogeneity over and above central tendencies of the outcome distribution and the association between covariates and conditional mean outcomes that are the mainstay of standard regression models including the proportional odds ordered logit model.
Respective interest in relaxing the parallel regression assumption may also be justified on purely empirical grounds, and, in fact, even in a somewhat artificial and restrictive setting like that of the present analysis. With dichotomous outcome measures to reflect, respectively, particularly high and low levels of political trust among citizens, a comparison of parameter estimates between ESS- and EVS/WVS-based logit models M3–M6 in Table 2 suggests that several relationships may, in fact, vary systematically across the outcome distribution, like the effect of gender and GDP per capita in the ESS data, or the effect of the Gini coefficient in the EVS/WVS sample. And in principle, it is actually straightforward to address such concerns and to relax the parallel regression assumption when required. As the multiscale model is derivative of the standard ordered logit model, it also inherits the principal approach toward its generalization. Specifically, and exactly as with the conventional model, the natural specification of a generalized multiscale ordered logit model is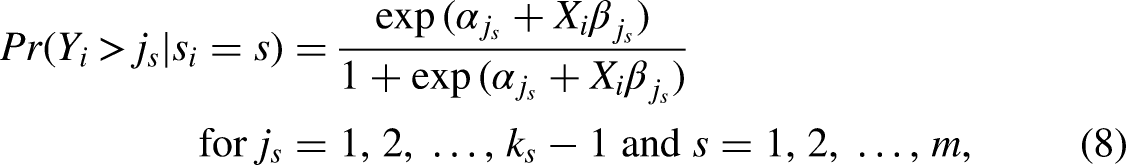
While this procedure has evident statistical merit insofar as it seeks to exhaust the data signal by finding a maximally parsimonious model specification to fully capture and describe it, it is also possible to approach the issue of generalizing the ordered logit model less from a data-analytic and more from a subject-matter perspective. And without intending to deny the value of Williams’ (2006, 2016) alternative, this will be the approach taken here. Then, from a subject-matter perspective, it often seems less relevant to be able to fully and efficiently characterize all systematic patterns that may be apparent in the empirical data, but generalizing from the standard proportional odds formulation seems warranted whenever researchers may wish to evaluate hypotheses that extend beyond expectations about (conditional) group differences in average outcome levels. A typical case would seem to be that social scientists may harbor expectations about how some factor X would affect the shape of the outcome distribution over and above any upward or downward shift of the overall distribution that could be detected by examining conditional mean outcomes. Applied to the case at hand, one might reason that some covariates may be particularly relevant for protecting citizens from disenchantment with democratic institutions, and in such cases, one would expect to observe stronger associations between these particular covariates X and outcomes Y in the lower tail of the outcome distribution specifically, but weaker or perhaps even no statistical associations further up.
As one concrete example, adequate macroeconomic performance has often been considered a necessary condition of democratic legitimacy in classical works in political sociology or among students of the history of democratic societies (e.g., Lipset 1959, 1960, 2004). Translated into statistical terms, this could be read as indicating the expectation that macroeconomic conditions mostly affect the lower tail of the trust distribution, that is, may be considered particularly decisive for determining whether someone accords at least some basic degree of confidence to the institutions of democratic governance, but may have fewer if any implications for whether someone may be expressing to trust some particular institution either “usually” or “almost all of the time.” The substantive hypothesis in this case would imply a mean shift—trust in democratic institutions would be expected to be generally higher when macroeconomic environments are good than during a recession—but even more clearly it would involve an expectation about changes in the shape of the outcome distribution. Specifically, this consideration from classical political sociology would suggest that the variance of the outcome distribution increases during macroeconomic crises (or, as the flip side of the coin, that the trust distribution is relatively more compressed under normal times), and that the increased variance comes about as the lower tail of the distribution fanning out because a certain share of the citizenry loses basic faith in the institutions of democratic governance under economic distress.
To test substantive hypotheses like these, neither the fully generalized ordered logit model nor Williams’ (2006, 2016) partial proportional odds model would seem to fully meet the interests of substantively-minded social scientists. The fully generalized model clearly risks to provide excessive statistical detail, whereas the partial proportional odds model is setting statistical and data-analytic priorities rather than primarily substantive ones. Against that background, another type of generalization is to specify a generalized (and of course multiscale) ordered logit model in the form of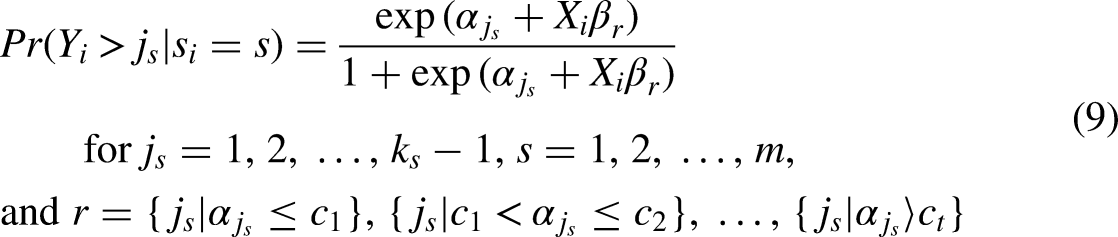
The Empirical Example Continued: Are There Any Asymmetries in the Effects of Covariates on Citizens’ Trust in Parliament?
To fix ideas, it seems straightforward to continue the earlier example, and to now examine whether some covariates may indeed show asymmetries in their association with citizens’ trust in the national parliament, and if so, which covariates might be important to avoid citizens turning away from the institutions of democratic governance. As before, the actual model to be estimated will be the multilevel extension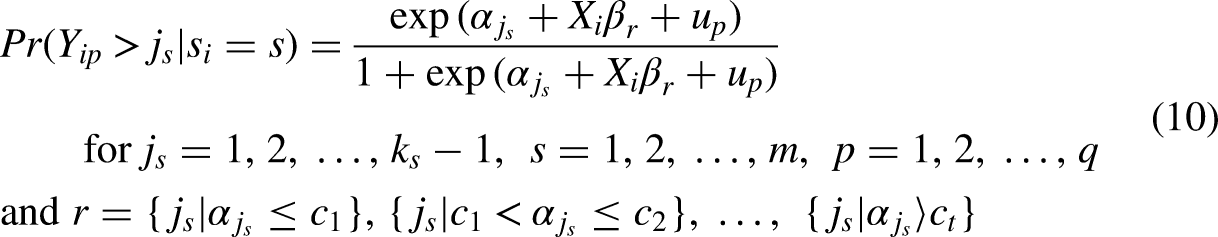
Macroeconomic and Demographic Determinants of Trust in the National Parliament Under Generalized Multiscale Ordered Logit Model Specifications.
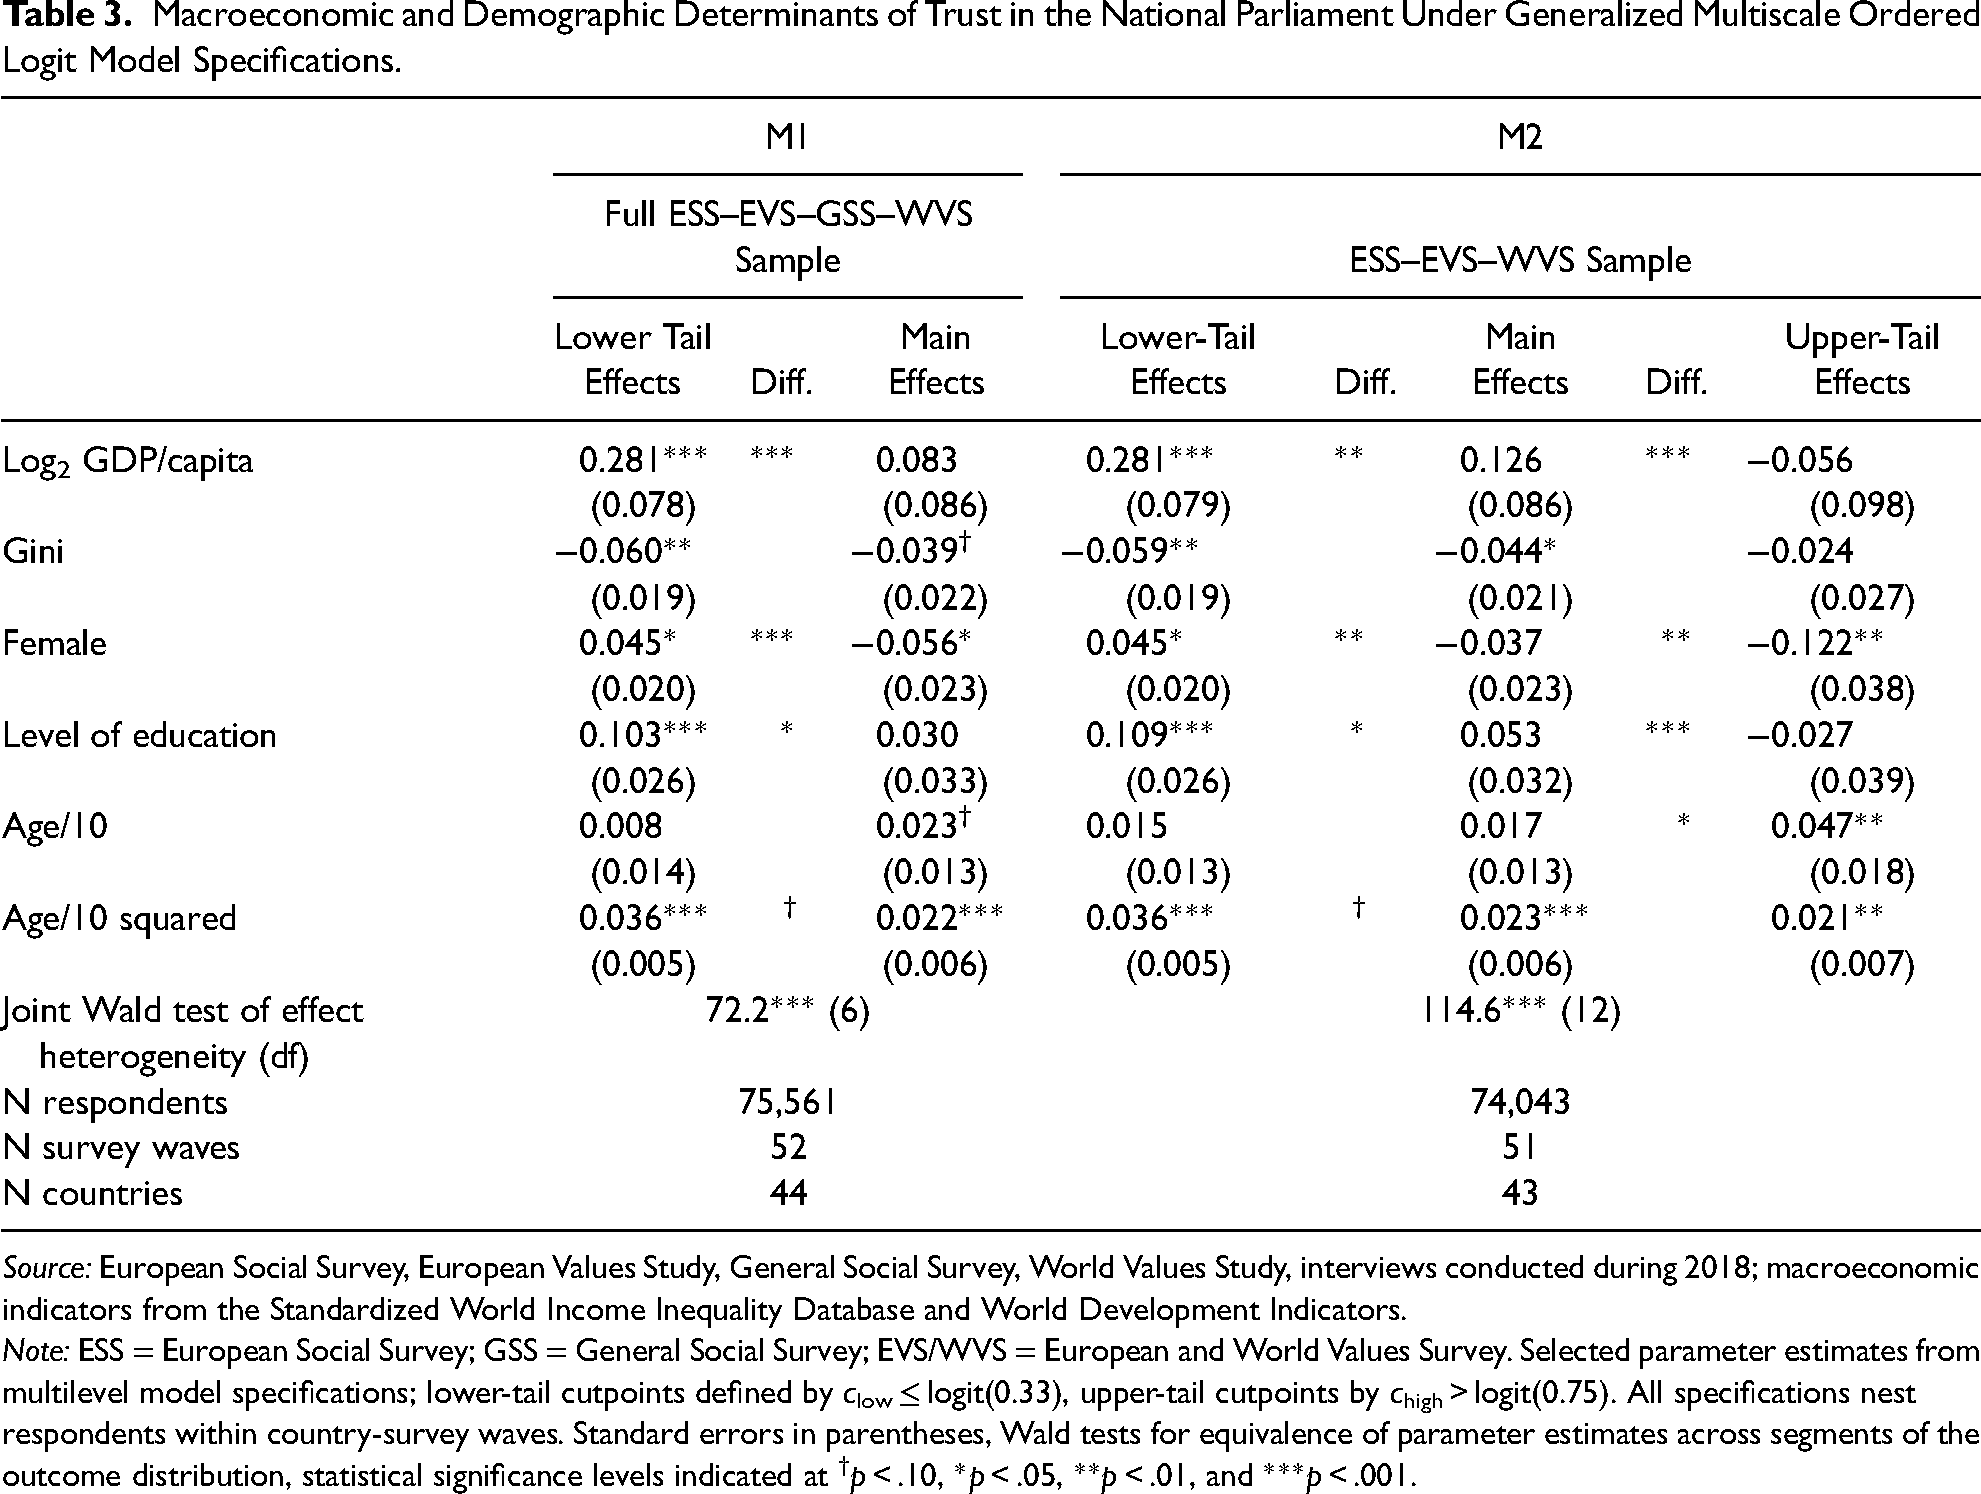
Source: European Social Survey, European Values Study, General Social Survey, World Values Study, interviews conducted during 2018; macroeconomic indicators from the Standardized World Income Inequality Database and World Development Indicators.
Note: ESS = European Social Survey; GSS = General Social Survey; EVS/WVS = European and World Values Survey. Selected parameter estimates from multilevel model specifications; lower-tail cutpoints defined by clow ≤ logit(0.33), upper-tail cutpoints by chigh > logit(0.75). All specifications nest respondents within country-survey waves. Standard errors in parentheses, Wald tests for equivalence of parameter estimates across segments of the outcome distribution, statistical significance levels indicated at †p < .10, *p < .05, **p < .01, and ***p < .001.
Empirically, it is self-evident from even the simplistic illustration of Table 3 why the standard proportional odds specification is often considered overly restrictive and substantively incomplete in the social sciences. Models 1 and 2 show clear evidence of effect heterogeneity in the associations between covariates and citizens’ trust in the national parliament, in fact, it turns out that there is not one in these five rather basic covariates where the proportional odds (parallel regression) assumption may unequivocally be maintained. And as expected from the above stretch of the classical literature, macroeconomic context indeed matters mostly in the lower tail of the distribution, that is, both prosperity and inequality are much more relevant in affecting citizens’ basic level of trust in the institutions of democratic governance (relative to losing faith in them entirely) rather than for determining whether citizens’ may be maintaining some dose of skepticism about institutions or may be seeing them as to deserve their full confidence. 7 At the individual level, a similar observation apparently holds for citizens’ level of education, where the pattern likewise changes from a strongly positive association in the lower tail of the trust distribution to a non-association at the highest levels of trust. There also seems to be an interesting gender difference insofar as gender is affecting the shape of the outcome distribution much more strongly than its central tendency. Whereas gender differences (as in the evidence reported before) are relatively minor in the middle of the trust distribution, women are less likely to express extreme (i.e., either very low or very high) levels of political trust than men, and seem to particularly shy away from expressing to have full confidence in parliament. As this is evidence of a gender difference more in the shape than in the location of the outcome distribution—with women's political evaluations being generally cast in more moderate terms than men's in this particular data, but not necessarily as more negative overall—it does indeed take a generalized ordered logit model specification to uncover the empirical regularity, and gender differences in the democratic trust would hence appear as less consequential when looked at only through the lens of a standard proportional odds model.
Potentials and Pitfalls
Rating scales are ubiquitous in the social sciences, yet their widespread usage implies the equally ubiquitous problem of how to handle the situation that response formats might have changed over time or might systematically vary across surveys. To achieve data integration in such cases, social scientists conventionally seek to adopt some plausible data harmonization protocol that exhibits at least some fair degree of face validity. To help avoid the inevitable level of indeterminacy and arbitrariness involved in taking such methodological choices, the current article has provided a straightforward generalization of the ordered logit model to a multiscale setting as a principled alternative. As it accommodates multiple scale formats in the measurement of a single rating construct, the multiscale ordered logit model permits the analyst to pool respective rating data even when it has been collected from different question formats, and it permits social scientists to work within the familiar and flexible statistical environment of logistic regression modeling as it inherits all standard features of the ordinary ordered logit model that it is descending from.
Even so, it is important to emphasize that the multiscale model is not meant to suggest any canned solution to the intractable problem of determining the substantive equivalence of verbal or numerical stimuli across different surveys and survey instruments. Instead, the contribution of the multiscale specification is to provide researchers with a statistical tool to effectively sidestep the comparability issue and to at the same time permit substantively meaningful data analyses across alternative question formats intended to measure the same index variable. The multiscale model inevitably does rest on certain statistical assumptions as well, but these appear as rather benign and, in fact, are the exact same as implied in any conventional regression model for ordinal outcome data. The proposed model, like its standard ordered logit cousin, best fits the case of any rating scale that may be considered as a categorical recording device to approximate an underlying continuum. Conceptually, this seems an adequate way of thinking about many survey items to measure respondents’ attitudes, beliefs, or intensity of affiliation, but it is equally clear that other types of ordinal data exist that do not easily match this description. Likewise, even when conceptual foundations may appear adequate in principle, the proposed multiscale model may still break down in practice and fail to produce meaningful results. When, for example, response categories happen to be very distinct and the overlap in response stimuli happens to be consequently slim across surveys, the model's implicitly relativist mode of data integration is likely to prove invalid at some point. But then, the purpose of the multiscale specification is not and cannot be to transform imperfect data into ideal ones. It is to provide researchers with a way forward in an all-too-common situation and to exploit the imperfect data that we all rely on as best as may be under reasonably mild and practically defensible assumptions.
Supplemental Material
sj-pdf-1-smr-10.1177_00491241231186655 - Supplemental material for A Generalized Ordered Logit Model to Accommodate Multiple Rating Scales
Supplemental material, sj-pdf-1-smr-10.1177_00491241231186655 for A Generalized Ordered Logit Model to Accommodate Multiple Rating Scales by Markus Gangl in Sociological Methods & Research
Footnotes
Acknowledgments
The author gratefully acknowledges the opportunity to draw on microdata from the European Social Survey, the European Values Study, the World Values Survey, and the General Social Survey for the present research. Of course, none of the original data collectors nor the data archives providing the scientific use files are responsible for the author's use of the data, nor for any interpretation that he is deriving from the analyses. The current research has benefitted from the generous funding provided by the European Research Council for the author's POLAR project (Grant Agreement no. 833196) under the European Commission's Horizon 2020 research and innovation program. Neither the ERC nor the European Commission is responsible for the research content or any of the views expressed in the article. The author also appreciates the generous and helpful feedback provided by the editor and the SMR reviewers on earlier versions of this article.
Declaration of Conflicting Interests
The author(s) declared no potential conflicts of interest with respect to the research, authorship, and/or publication of this article.
Funding
The author(s) disclosed receipt of the following financial support for the research, authorship, and/or publication of this article: This work was supported by the H2020 European Research Council, (grant number 833196 – POLAR – ERC-2018-ADG).
Data Availability Statement
A replication package for this article is available at ![]() . A Stata ado to estimate the multiscale ordered logit model is part of this replication package or may alternatively be downloaded via the command ssc install mscologit from within Stata. The replication package also contains instructions on how to obtain the scientific-use microdata files for the ESS, EVS, GSS, and WVSs, and on how to access the macroeconomic indicators from the World Development Indicator (WDI) database and Standardized World Income Inequality Database (SWIID) that have been merged to the survey data in the present work.
. A Stata ado to estimate the multiscale ordered logit model is part of this replication package or may alternatively be downloaded via the command ssc install mscologit from within Stata. The replication package also contains instructions on how to obtain the scientific-use microdata files for the ESS, EVS, GSS, and WVSs, and on how to access the macroeconomic indicators from the World Development Indicator (WDI) database and Standardized World Income Inequality Database (SWIID) that have been merged to the survey data in the present work.
Notes
Author Biography
References
Supplementary Material
Please find the following supplemental material available below.
For Open Access articles published under a Creative Commons License, all supplemental material carries the same license as the article it is associated with.
For non-Open Access articles published, all supplemental material carries a non-exclusive license, and permission requests for re-use of supplemental material or any part of supplemental material shall be sent directly to the copyright owner as specified in the copyright notice associated with the article.