
Abstract
Datasets and analysis scripts are becoming more available online, but most datasets are still unclear and difficult to use due to poor meta-data. Adopting standard variable label solves most of these problems and is easily implemented if we set the labels at the time of publication, that is, for authors to also establish standard variable labels when they establish for example, question wording. This simple step involves little effort but facilitates the sharing of datasets and analysis scripts enormously. Current initiatives to improve meta-data rely on users spending much time creating new meta-data for each variable, which is time consuming, unenjoyable, and hinders adoption. Some suggestions are made on how brief, unique, and clear variable labels can be developed, especially using the last two digits of the year the scale was published in. Standards for dataset and analysis script etiquette are the future, and the final section of the manuscript examines other easy places simple standards can save time and frustration for (re)users.
Keywords
Datasets are becoming more common online, but still actually using these datasets is most often difficult or impossible due to poor meta-data and a resulting lack of clarity. Some of the largest problems include the lack of clear variable labels (e.g. “var 1”), a lack of meta-data whereby those variable labels are matched with particular questions in the survey or experiment, or a lack of a survey file in general, and an inability to identify whether the “5” indicated in the dataset matches, for example, “extremely liberal” or “extremely conservative” indicated on the scale. Without a good ability to identify which columns in the dataset are which, the data are essentially worthless, and even small errors can cause significant misunderstandings down the line. In this regard, setting and using standard variable labels within research communities will go a long way to answer these questions—without any extra effort or aggravation for the individual user. These labels make it directly clear which columns in the dataset are which, and one can easily go and look up the paper where the scale was originally published to answer questions like what was the wording or what the scale values mean. This benefit goes further in being able to have machine readable datasets, so that I can search for a particular variable and receive datasets that contain that variable, and the data can be easily collated for analysis.
What holds back the meta-data revolution
There exist good standards on how to document papers, but not yet datasets and analysis scripts. For many years, the infrastructure to make one’s datasets simply did not exist, but in the last years, there has been an explosion of online repositories for research data. Most university libraries now have a repository, and there are hundreds of field and country-specific databases where one can upload their data, including several all-purpose repositories like Git. There is in fact even a repository of data repositories, which contains data on over 2000 data repositories (re3data.org/). This creates problems both in where to upload the data but more importantly where to look for data, as most of these databases still do not have functional search affordances (Buttliere, 2019).
Still but this ignores unpublished datasets and other gray work (e.g. master and PhD theses). The problem is no longer infrastructure, if anything there is too much infrastructure and an inability for that infrastructure to read and return the datasets in a useful way. Adopting standard variable labels solves these problems by making datasets machine readable and searchable.
Even when one is able to find datasets, they are most often difficult or impossible to use due to poor labeling and meta-data standards for indicate, for example, scale values. In this regard there are a growing number of initiatives to include better meta-data for datasets, including the Findable, Accessible, Interoperable, and Reusable (FAIR) principles and the Data Documentation Initiative (DDI) initiatives. The FAIR guidelines specify—in general terms—that data should be Findable, Accessible, Interoperable, and Reusable (Wilkinson et al., 2016). This initiative has received strong support from the community but does not make strong recommendations on how to achieve this goal. Conversely, the DDI is attempting to develop standards, especially for survey and observational methods in the social sciences, especially by developing software which will help researchers develop meta-data files which can be posted alongside a dataset. The problem here and with similar solutions is that they often take very much time, are often frustrating, and there is a good chance that nobody will ever use the meta-data file which is so frustrating and time consuming to create. This makes it feel unnecessary and limits adoption (Buttliere, 2014). There is also a problem with creating new special software to be used, which must be learned and used both by the uploader and reuser, especially given the rapidly changing research software landscape. Compare this with variable label standards which are software agnostic, clear, and can be implemented easily.
Adopting standard variable labels as a simple fix for a complex, multifaceted, problem
Adopting the use of standard variable labels, within one’s own community of practice, solves the aforementioned problems easily. Researchers must already remember variable labels, and knowing the standard variable labels in their field answers which columns are which, how the variable labels are applied, and moves the community toward discussing particular questions in texts more accurately, as well as the seamless sharing of code and analysis scripts in the community. Using standard labels makes things like plug and play analysis possible because scripts will already be coded to accept the variables and their labels. Finding data can also be made easier, as the datasets can be directly searched for the variables one is searching for, instead of getting thousands of tangentially related results.
Adopting standard labels eases the meta-data burden of both the uploader of the data and the eventual user. The meta-data is already established elsewhere, that is, in the publication that originally published the scale and set the labels, and it can be looked up with a simple Google search of the variable label. Especially by setting standard variable labels at the introduction of particular and specific scales and metrics, much of the confusion and difficulty in introducing these standards can be avoided, as the variable labels become another standard thing like the wording of the questions or the scale anchors. The goal is then to make suggestions as to how variable names and labels could be standardized to make datasets and analysis scripts easier to reuse.
The (not so!) simple step of developing standard scale and variable names—some specific suggestions
It is easy to say that standards should be set, but it is difficult to set standards in a way that they meet everyone’s needs. There are at least two problems. On one hand, different research communities have different needs and it is hard to set a standard even for one community, let alone a whole field. On the other hand, there is surprisingly little scientific work about how to develop clear variable names, with most of what is written being blog posts (MathBits, 2021), or more general guidelines, about the software design, where variable names are only an afterthought (Martin, 2000).
Difficulties due to different languages and programs
One of the largest problems is that different communities use different programs and languages in their work, each with their own standards and norms. An example of this is the simple period “.”; it is useful and my preferred variable delimiter (separator between scale and question indicators) in R and SPSS (2020; R, 2020), but causes problems in PHP or JavaScript. There are many such inconsistencies, and working around or incorporating all these difficulties into a single system is difficult. The C scheme of variable labels is useful, in that it allows basic letters, digits, and the underscore, and are already generally accepted (Pronk, 2019). The period is, in my personal opinion, more suitable than the underscore in manuscripts and especially tables because it looks more professional and takes up less space. The period also eliminates needing to hit the shift key, on my keyboard, and so halves the number of keystrokes and potential errors. This is especially important when typing variable names in the console or script, as they need to be exact, though tools or a simple find and replace can make any changes that are needed.
The point is not to develop a single standard for everyone, as it seems pure hubris to think that we can not only summarize and meet everyone’s current needs but also foresee where all these fields are headed. Rather, the argument is that these standards are developed within one’s own communities of practice. Still, there are some common sense and sensible suggestions which are likely to be found useful across communities, such as aiming to create brief, clear, and unique variable labels, avoiding too many capital letters or other uses of the shift key, and using publication year sensibly.
The psychological tensions between brevity, uniqueness, and clarity
There are competing needs when creating variable labels, and the prevalence of variable names like “var1” and “q2” demonstrates how most researchers intuitively assign and create their variable names. That is, it is clear to them (in this moment) and so they make them as short and easy to use as possible, even if they are not unique, useful, or memorable in the future. Thus, brevity and ease of use needs to be central to any lasting suggested solutions. On the other hand the digital object identifier (DOI) of a paper would be more useful and often shorter to put into the text of the paper than traditional citation practices, but they are unclear and difficult to remember. DOIs are very good for the machine to read, making matching easy, but they are not very useful for the human. Thus, there is a clear tension between making variable names computationally unique, and keeping them brief and memorable for the human scientists that actually do the science. The psychology of the scientist is central to implementing useful and long-lasting solutions (Buttliere, 2014). Asking people (scientists) to engage in frustrating or boring tasks, even if it is good for the community, is not sustainable; solutions must save time, effort, and frustration.
The goal is then to keep variable names short but to increase clarity and uniqueness as an aide to understanding at a broader scale. Long variable names like “Rosenberg_Self_Esteem_Scale_1965_1” are clear and unique, but they are tedious to type because of the length and the number of characters which require using the shift key to create (all capital letters and underscores). Such a label is in fact 43 keystrokes on my keyboard, which is unsustainable in the long term.
The magic of the last two digits of the year the scale was published in
Probably the best solution to this problem is the last two digits of the year the scale or metric was published in. The 1965 version of the Rosenberg Self-Esteem Scale (Rosenberg, 1965) can be abbreviated something like “esteem65” or “se65.” In this way, the 43 keystroke label can be reduced to 8 or even 4, with confidence that there will not be another self-esteem scale published in 1965 with the same number of questions and variable anchors. The last two digits of the year function to save that abbreviation for effectively 100 years, as if even a new or related version of the original scale were to come out (as happened in 1991; Heatherton and Polivy, 1991), that scale can be referenced as “se91” or “statese91.” Thus, one can compare multiple versions of the same or similar scales without trouble. After 100 years, it is unlikely people are still using the same scales, and the third digit can simply be added to make something like “se165” to keep the uniqueness up.
Differentiating between scale, item, and experiment levels
Having a solid scale level label is important, but there are also many instances where a scale is used pre and post some manipulation. In this regard, it makes sense to split the variable label into parts and order them from most general to least general, something like “scale.question.specificexperiment.” This keeps the most stable aspects of the variable label first and the computer can differentiate between the different sections using the period. There are many usages here that have likely not even been thought of yet, but it is easy to see a need to indicate things like the language the study is conducted in, the lab, the specific question, or other experimental aspects relevant to this particular question.
These intricacies can be worked into the labels. If the question is reverse coded, for instance, “se65.2r” would indicate the second question of the 1965 version of the Rosenberg Self-Esteem Scale, which is reverse coded. If the scale is used pre and post, or pre and post in Polish, the question might end up being labeled “se65.2r.pre” or “se65.2r.pre.pol,” respectively. Using the delimiter between the different sections of the label, and putting the more generally relevant scale and question data first makes it easier for the computer to overinclude data to be sorted out later. It is of course better to overinclude datasets for analysis and to remove them later than to miss them altogether.
Thinking about dataset and analysis script hygiene more generally
Standard variable labels are a good start, but there are also many other aspects of datasets and analysis scripts that can be standardized and made easier for everyone. A good example are those variables that are in essentially all datasets that are produced, such as the condition variable, the date or location the data were collected, or the participant identification variable. Standardizing these variables, and thinking more generally about how we can ease the development and implementation of a plug and play culture of data and analysis code would benefit everyone (Buttliere, 2014). There are currently no standards for dataset and analysis script hygiene in general, though it is clear that the future has them.
Again it is easy to say standards should be set but difficult to implement them. A good example of this confusion and difficulty is the “simple” gender or sex variable. Compared to a variable like nationality, this is a relatively simple variable to code, in theory, but there are of course not only new definitions of sex and gender, they are also simply coded differently. Looking through a few of the available datasets on PsychData, one can already see many variants on a gender variable, including SEX, GENDER, GESCH, GESCHL, GESCHLECHT, KIGESCH, M_W, T1SEX, V383, U1, V102, S_2, VPSEX, SEX0, SEXCODE1, SEX1, IGESCHL, VPI00GEN, AKSEX, SEX_T1, and SP1_A; this does not include how the variables are coded (Geschlecht is gender in German). How many gender labels should be included in a standard variable? Should men be coded as one or as two? Does putting men first mean we put them ahead of women, or putting them second mean they are worth more or bigger than women? These are the eternal questions which keep us awake at night. Beyond these important theoretical questions come those of practicality. Will it be more difficult to get people to agree on using some standard, or will it prove worthwhile to simply standardize? Time will tell, but it is clear that establishing standards, using the year they were developed, allows standards to be set but also flexibility in the development of our understanding about this concept. It seems clear, and all can agree that having some standards like “sex58” and “gender06” could be very useful for those who opt in to using them, allowing plug and play analysis and dataset compatibility. Large data handlers and collectors, like the census bureau, often have established norms about these basic demographic variables, but they have often not been implemented far beyond or between organizations.
Table 1 contains some examples of aspects of data and analysis scripts that can be usefully standardized, beyond only the variable labels. Experimental and control variables like the participant identification, condition, location, and similar can be set easily in an American Psychological Association (APA) style guide update, but it still makes sense to think about and develop them, given that the next update is likely a decade off. Directly observed variables and those derived from them can be differentiated, I believe, with a capital letter.
Some variables and aspects of datasets and analysis scripts that can be standardized relatively easily, with a suggested variable scheme in parentheses.
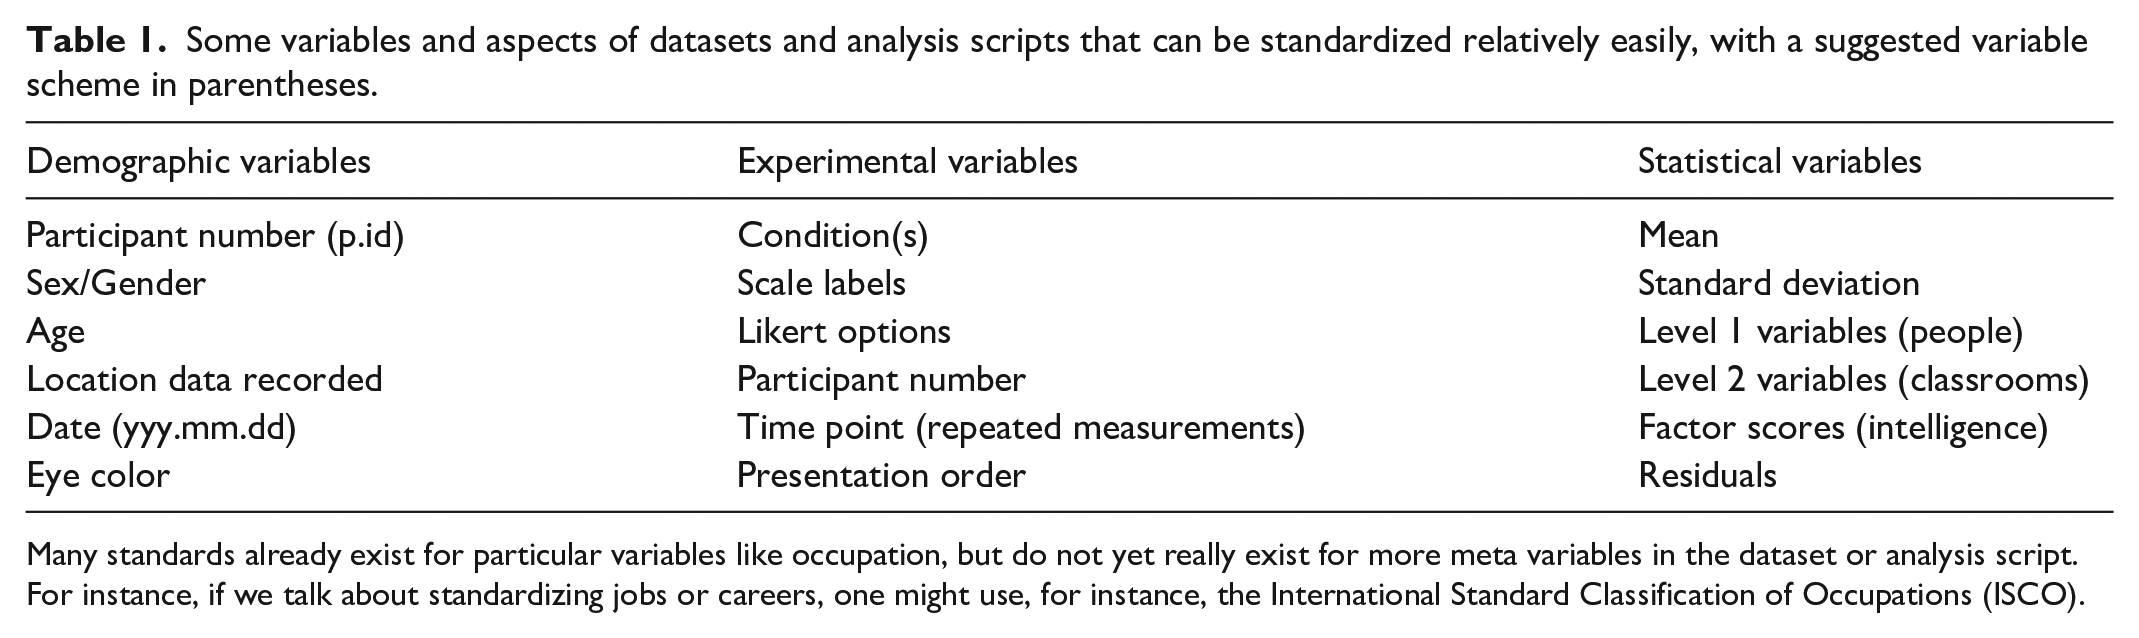
Many standards already exist for particular variables like occupation, but do not yet really exist for more meta variables in the dataset or analysis script. For instance, if we talk about standardizing jobs or careers, one might use, for instance, the International Standard Classification of Occupations (ISCO).
For instance, the Rosenberg Self-Esteem factor score might be represented with “SelfEsteem65” which can be used in further analysis. Similarly, second-level variables like country or state averages can be indicated with an M at the end (e.g. the average self-esteem of a country can be indicated with “Country.SE.m”). These are only first suggestions, and the discussion has quite literally not even begun yet, and the next steps are likely to look empirically at what is being used and what is most easy to use.
Many aspects of the analysis script can also be made more clear, for instance, by delineating between cleaning variables and analysis phases and more clearly marking particular functions to aide in plug and play analysis. In a theoretical future, even some link can be ported into an analysis script where the function came from, and even the function itself might not need to be copied into the script. These standards are far off, but even simple things like standards about notekeeping within the analysis script can be useful. It is clear that notes should be made, but little attention is given to how notes should be made. There currently exists almost nothing about dataset or analysis script etiquette, and I foresee a time where this becomes a standard part of the APA style guide taught to students in their methods courses. Even the composition of file names can be thought about intentionally, to, for example, indicate relationships between files, but these things are far into the future.
Instituting and implementing these standards
I am pessimistic about my own ability to take into account all the needs of different communities and to come up with, encourage, and “enforce” such standards (though enforcement is not the way; Buttliere, 2014). Again, the solution is to begin within one’s own community of practice, and I think especially when developing new standards and scale to put in the paper where that scale is published the variable names as one would put the question wording. A simple phrase like “we ask those who use this scale to use the associated variable labels (and to upload it to *******), so that it can be easily reused in larger scale analyses in the future. By using the standard labels you should also be able to directly use the analysis script provided at *******” already would go very far in my opinion. These small sentences make clear the value in using the standard labels, both for the community at large but more importantly for the researcher collecting the data, and should go a long way toward encouraging its use. A significant part of the work is simply to identify and synthesize the many existing standards.
Final comments
The establishment of clear variable names, labels, and the associated meta-data is a time-consuming and error-prone task that every data analyst must face. Establishing standard variable names eases the burden of creating meta-data, as well as makes the data and analysis scripts more reusable in the future—it is a win-win situation and a perfect instance for standardization to work. Even when one makes errors in using the system, the system makes it easier to identify and correct them, whereas in the current system, it is almost impossible to tell if two variable names got switched somewhere; this is of course especially problematic if you are trying to use someone else’s data.
The probability of developing a perfect set of standards that will meet all use cases on the first try is low. Rather than pretending we can have a perfect system at the get go, the key is to begin a discussion about how dataset and analysis script standards could be and to encourage you to establish and encourage the use of standards within your own communities. In this regard, it is worth again reiterating that setting the variable names and labels at the publication of the scale seems like the most effective approach, before people start implementing their own systems. To make them part of using the scale is the simplest and most effective solution I have found.
It seems clear that in 20 years that standards and norms will exist for datasets and analysis scripts, but still such standards are far off at this point. Unfortunately, as time goes by, there are only more unusable datasets on the Internet, and so it pays to set some standard as soon as possible, and to improve it overtime. Pairing these small improvements with more general improvements in data repositories and especially the search features in these repositories will enable the reuse of scientific data like never before.
Footnotes
Declaration of Conflicting Interests
The author(s) declared no potential conflicts of interest with respect to the research, authorship, and/or publication of this article.
Funding
The author(s) received no financial support for the research, authorship, and/or publication of this article.