
Abstract
Social science researchers now routinely use confirmatory factor models in scale development and validation studies. Methodologists have known for some time that the results of fitting a confirmatory factor model can be unduly influenced by one or a few cases in the data. However, there has been little development and use of case diagnostics for identifying influential cases with confirmatory factor models. A few case deletion statistics have been proposed to identify influential cases in confirmatory factor models. However, these statistics have not been systematically evaluated or compared for their accuracy. This study evaluated the accuracy of three case deletion statistics found in the R package influence.SEM. The accuracy of the case deletion statistics was also compared to Mahalanobis distance, which is commonly used to screen for unusual cases in multivariate applications. A statistical simulation was used to compare the accuracy of the statistics in identifying target cases generated from a model in which variables were uncorrelated. The results showed that Likelihood distance and generalized Cook’s distance detected the target cases more effectively than the Chi-square difference statistic. The accuracy of the Likelihood distance and generalized Cook’s distance statistics was unaffected by model misspecification. The results of this study suggest that Likelihood distance and generalized Cook’s distance are more accurate under more varied conditions in identifying target cases in confirmatory factor models.
Keywords
Confirmatory factor analysis has become a popular technique for scale development in quantitative research in the social sciences. Researchers have come to rely on fitting confirmatory factor models to determine the extent to which theory about a quantitative scale matches the pattern of responses observed in practice. However, the results of fitting confirmatory factor models can be unduly influenced by one or a few cases in the data (Bollen, 1989). In other modeling frameworks, such as ordinary least square (OLS) regression, there has been extensive development and widespread use of case diagnostics for identifying influential cases in a sample data set. Such has not been the case with confirmatory factor models, which were traditionally fit to descriptive statistics sans individual case data. Several case diagnostics have been proposed and illustrated with confirmatory factor models, but the accuracy of these statistics in detecting simulated target cases has not been systematically examined or compared. Without rigorous and systematic examination, social science researchers have little basis for selecting and using particular case diagnostics in practice. Comparison of the accuracy of case diagnostics in confirmatory factor analysis is warranted to provide practical guidance regarding which statistics are more accurate in identifying target cases under a variety of conditions.
The purpose of this study is to investigate the accuracy of deletion-style case diagnostics, called deletion statistics, available through the R package influence.SEM (Pastore and Altoe, 2017). Our goal is to determine which deletion statistics perform with relatively better accuracy in identifying simulated target cases across a variety of conditions in confirmatory factor models. In addition, we compare the accuracy of the deletion statistics to the accuracy of Mahalanobis distance (MD), which is widely used to identify unusual cases in multivariate data. We present a Monte Carlo simulation study that compared the accuracy of Likelihood distance, generalized Cook’s distance, and Chi-square difference with the accuracy of MD. We hypothesized that the case diagnostics would have different accuracy in detecting target cases across variations in sample size, proportion of target cases, and model specification.
Background
Case diagnostics have as their common goal the identification of unusual cases in the data. Unusual cases may be conceptualized as multivariate outliers (Hawkins, 1980), residual outliers (Hildreth, 2013), influential cases (Cook, 1977), or leverage observations (Yuan and Zhong, 2008). Of all these conceptualizations, influential cases are most important due to their demonstrated effects on model results. Multivariate outliers, residual outliers, and leverage observations may or may not be influential cases (for an overview see Flora et al., 2012). Deletion statistics are the most straightforward approach to quantifying case influence. By comparing model results with and without the presence of the ith case in the sample data, deletion statistics provide information about the global influence of the ith case on the results (Cook, 1977; cf Cadigan, 1995; Cook, 1986). The deletion statistic concept is well developed in the context of multiple regression models (e.g. Belsley et al., 1980; Cook and Weisberg, 1982). However, far fewer studies have approached deletion statistics in the context of confirmatory factor models. Studies that have approached this topic generally introduced and illustrated the use of deletion statistics, but did not systematically evaluate or compare their accuracy.
Few deletion statistics have been proposed for use with confirmatory factor models. One such statistic is an adaptation of Cook’s (1977) likelihood distance
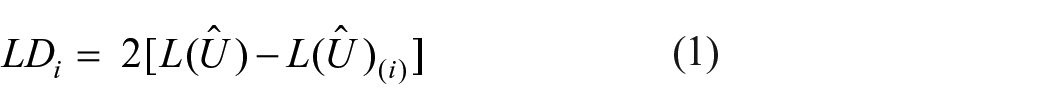
where i = 1, …, N and L(Ȗ) and L(Ȗ(i)) are the model likelihoods in the original sample and sample with the ith case deleted, respectively. Likelihood distance is a model-based measure of the influence of ith case on model fit (Cook, 1977, 1986; Cook and Weisberg, 1982). Likelihood distance provides information about both the magnitude and direction of change in the likelihood function resulting from removing the ith case from the data. Positive likelihood distance values indicate that removing the ith case worsens the model fit, and negative likelihood distance values indicate that excluding the ith case improves model fit.
Chi-square difference is also a model-based case influence measure of overall model fit. Chi-square difference is derived from likelihood distance using the maximum likelihood function

where X2 and X2(i) are model Chi-square statistics from the original sample and the sample with the ith case deleted, respectively (Pek and MacCallum, 2011; Zhao and Lee, 1998). The Chi-square difference statistic quantifies case influence on overall model fit by the change in the Chi-square model statistic after removing the ith case. Positive values of Chi-square difference indicate improvement in the model fit associated with the exclusion of the ith case, and negative values of Chi-square difference indicate the exclusion of the ith case worsens the model fit. This marks a distinction between good influential cases and bad influential cases (Pek and MacCallum, 2011). Variations of this approach have also been proposed for other model fit statistics in structural equation modeling, such as the Comparative Fit Index, Root Mean Square Error of Approximation, Tucker–Lewis Index, Akaike’s information criterion, and Bayesian information criterion (Pek and MacCallum, 2011), as well as for indexes of model comparison (Sterba and Pek, 2012).
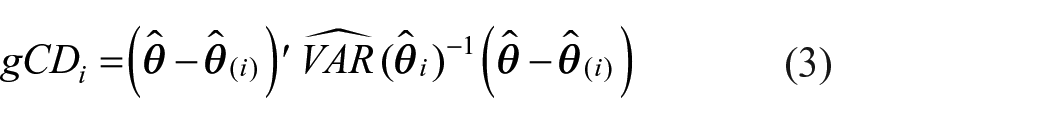
Variations on Cook’s distance have also been proposed for use with structural equation models (Pek and MacCallum, 2011; Zhao and Lee, 1998). Rather than examine influence on overall model fit, generalized Cook’s distance examines case influence on a set of L parameters
where
Given the quadratic form of generalized Cook’s distance, its lower bound is zero. Thus, generalized Cook’s distance always takes positive values and provides information about the amount of change in the set of L parameters but not the direction of change. A small value of generalized Cook’s distance indicates a small change in the set of L parameters estimates is associated with the exclusion of ith case from the sample. A large value of generalized Cook’s distance indicates a large change in the set of L parameters estimates is associated with the exclusion of ith case from the sample. The scaled difference
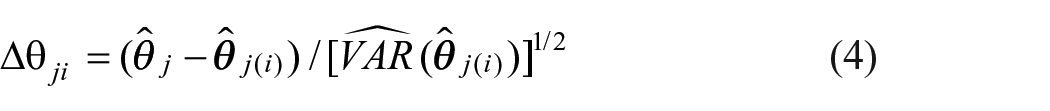
where
In the absence of the availability or awareness of these few case deletion statistics that exist for structural equation models, researchers routinely examine multivariate data using MD. MD is the squared Euclidean distance between the ith case and the remaining cases while accounting for the correlation in the data (Mahalanobis, 1936)

where
MD is a popular technique for detecting multivariate outliers and has broad applicability because it does not require fitting a model to the data. However, the multivariate outliers detected using MD are not necessarily influential cases. A number of case influence statistics proposed for use with structural equation models are highly correlated with MD, including COVRATIO (Pek and MacCallum, 2011), DSi (Pek and MacCallum, 2011), and
The deletion statistics likelihood distance, Chi-square difference, and generalized Cook’s distance proposed for use in structural equation modeling have not been rigorously tested for their accuracy. Zhao and Lee (1998) and Pek and MacCallum (2011) merely illustrated the use of these statistics using existing data sets. Lee and Wang (1996) simulated confirmatory factor model data to demonstrate the use of Cook’s distance. However, Lee and Wang used only a single replication and did not attempt to illustrate the accuracy of the statistic over a variety of conditions. Generally, the deletion statistics proposed for use in structural equation modeling have been introduced and illustrated in the existing literature, but not compared or evaluated for their accuracy.
The purpose of this study is to compare the accuracy of deletion statistics for their ability to identify target cases that could influence results while fitting a single model in confirmatory factor analysis. Furthermore, MD is investigated for the comparative utility of multivariate outlier screening for identifying target cases in confirmatory factor analysis. These case diagnostics are compared under a variety of systematically manipulated conditions while accounting for sampling variability using Monte Carlo (multiple replication) simulation.
Methodology
Data generation
This study used similar conditions as in Lee and Wang (1996), one of very few prior studies on case diagnostics in confirmatory factor analysis to use simulate data. Target cases were generated from a
Because sample size is a factor that may be expected to affect the accuracy of case diagnostics, data were simulated with three different sample sizes, 200, 400, and 600. As the proportion of influential cases increases, some deletion statistics may lose their ability to accurately detect individual cases affecting the results. Thus, four proportions of target cases to the number of non-target cases were applied, 0.10, 0.05, 0.02, and 0.01. Sample size and proportion of target cases were fully crossed for a factorial design with 12 conditions. Data were simulated in R v3.5.1 (R Core Team, 2018).
Case diagnostics
Likelihood distance, generalized Cook’s distance, and Chi-square difference statistics, as computed in the R package influence.SEM (Pastore and Altoe, 2017), were compared. Because model misspecification can affect the identification of target cases, both a correctly specified model, shown in Figure 1, and a misspecified orthogonal factors model, shown in Figure 2, were fit to the simulated data using the R package lavaan (Rosseel, 2012). Each factor variance was fixed to identify the model. All other parameters were freely estimated.
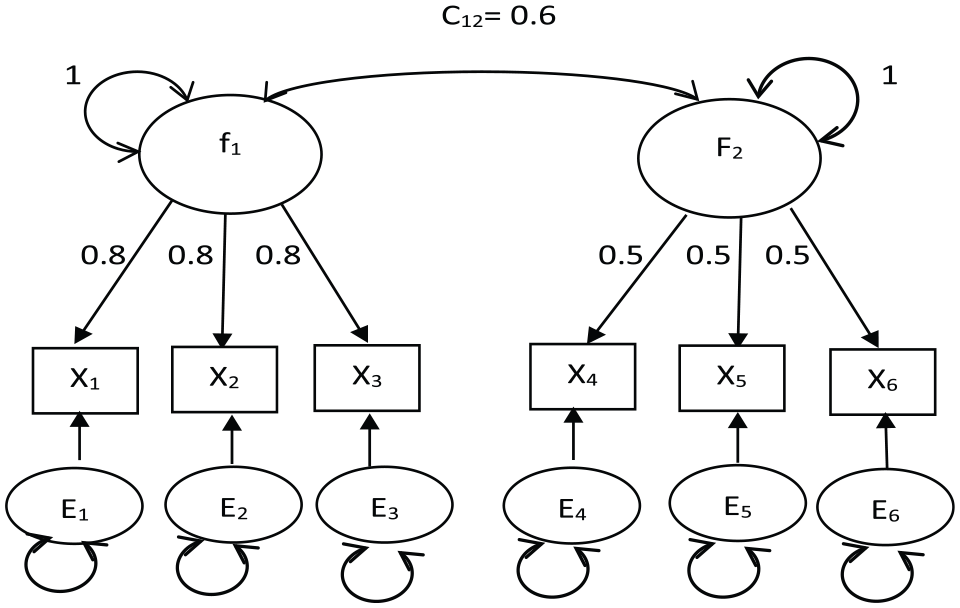
Correctly specified common factor model.
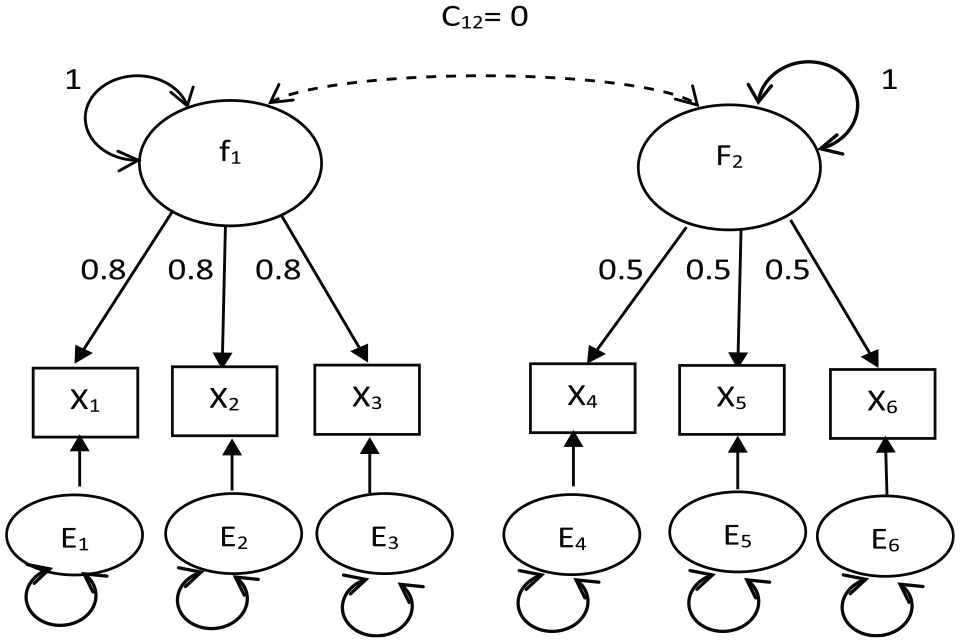
Misspecified orthogonal common factor model.
The Likelihood distance, generalized Cook’s distance, and Chi-square difference statistics used the boxplot criterion, the default in influence.SEM (Pastore and Altoe, 2017), for determining whether a case should be flagged as influential. The boxplot criterion establishes thresholds as a function of the first (Q1) and third (Q3) quartiles. For statistics whose range is
Robust MD using the minimum covariance determinant estimator was also calculated for the simulated data using the R package mvoutlier (Filzmoser and Gschwandtner, 2018; Filzmoser et al., 2005) to provide a popular baseline for comparison. The default of 0.5 proportion of the observations was used for minimum covariance determinant estimations. The procedure of Filzmoser, Garrett, and Reimann (2005) was used to determine outliers. In this procedure, the discrepancy statistic measures the departure of the empirical Chi-square distribution from the theoretical Chi-square distribution, but only in the tails (most extreme 2%) where outliers would be expected (Filzmoser, Garrett, and Reimann, 2005). The cut score used in this study for the discrepancy statistic was
To assess the accuracy of the case diagnostics under each simulated condition, the miss rate (MR), the ratio of missed target cases to generated target cases, and false alarm rate (FAR), the ratio of flagged non-target cases to generated non-target cases, were computed for each of the statistics for each replication. Results were averaged over 100 replications in R with confidence intervals computed using the standard error of the mean and the inverse t distribution. Averages were compared across different statistics and across systematic manipulations of the conditions.
Results
Tables 1 and 2 display the results of the simulation study for sample size 200 with the default and traditional thresholds, respectively. Likewise, Tables 3 and 4 display the results for sample size 400, and Tables 5 and 6 display the results for sample size 600. Generally, the likelihood distance and generalized Cook’s distance statistics had lower MRs than robust MD. However, the Chi-square difference statistic often had a higher MR than robust MD, particularly when the fitted model was misspecified. Figure 3 illustrates this trend. There was no consistent trend in MRs as the proportion of the target cases to non-target cases increased. Likewise, there was no consistent trend in MRs across sample sizes.
Miss rates and false alarm rates based on the cutoff 1.5 × IRQ for seven case detection statistics by proportion target cases for sample size 200.
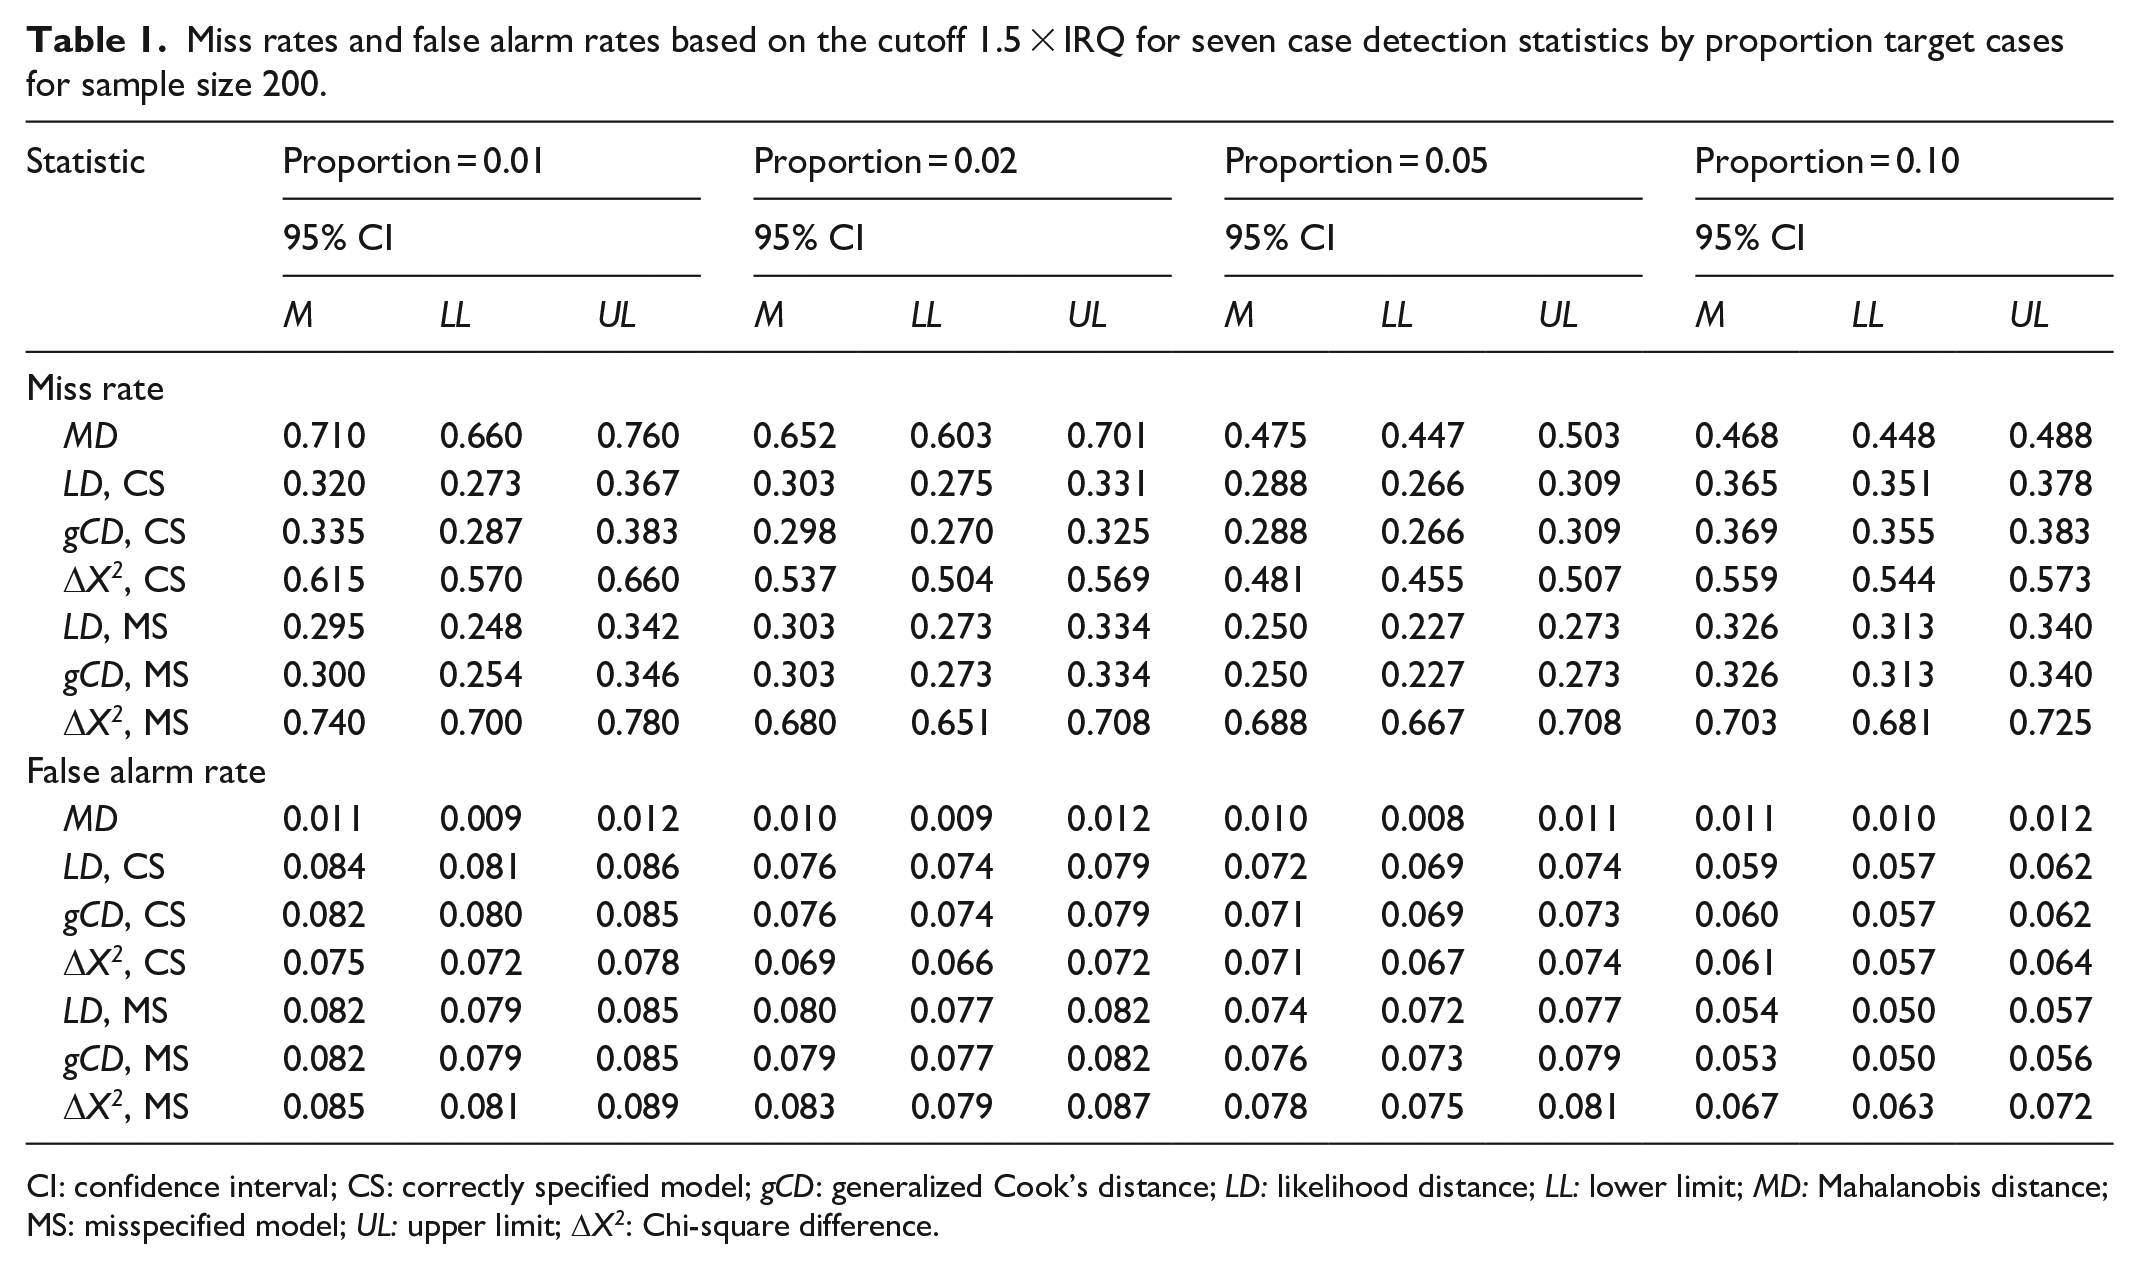
CI: confidence interval; CS: correctly specified model; gCD: generalized Cook’s distance; LD: likelihood distance; LL: lower limit; MD: Mahalanobis distance; MS: misspecified model; UL: upper limit; DX2: Chi-square difference.
Miss rates and false alarm rates based on the cutoff 3.0 × IRQ for seven case detection statistics by proportion target cases for sample size 200.
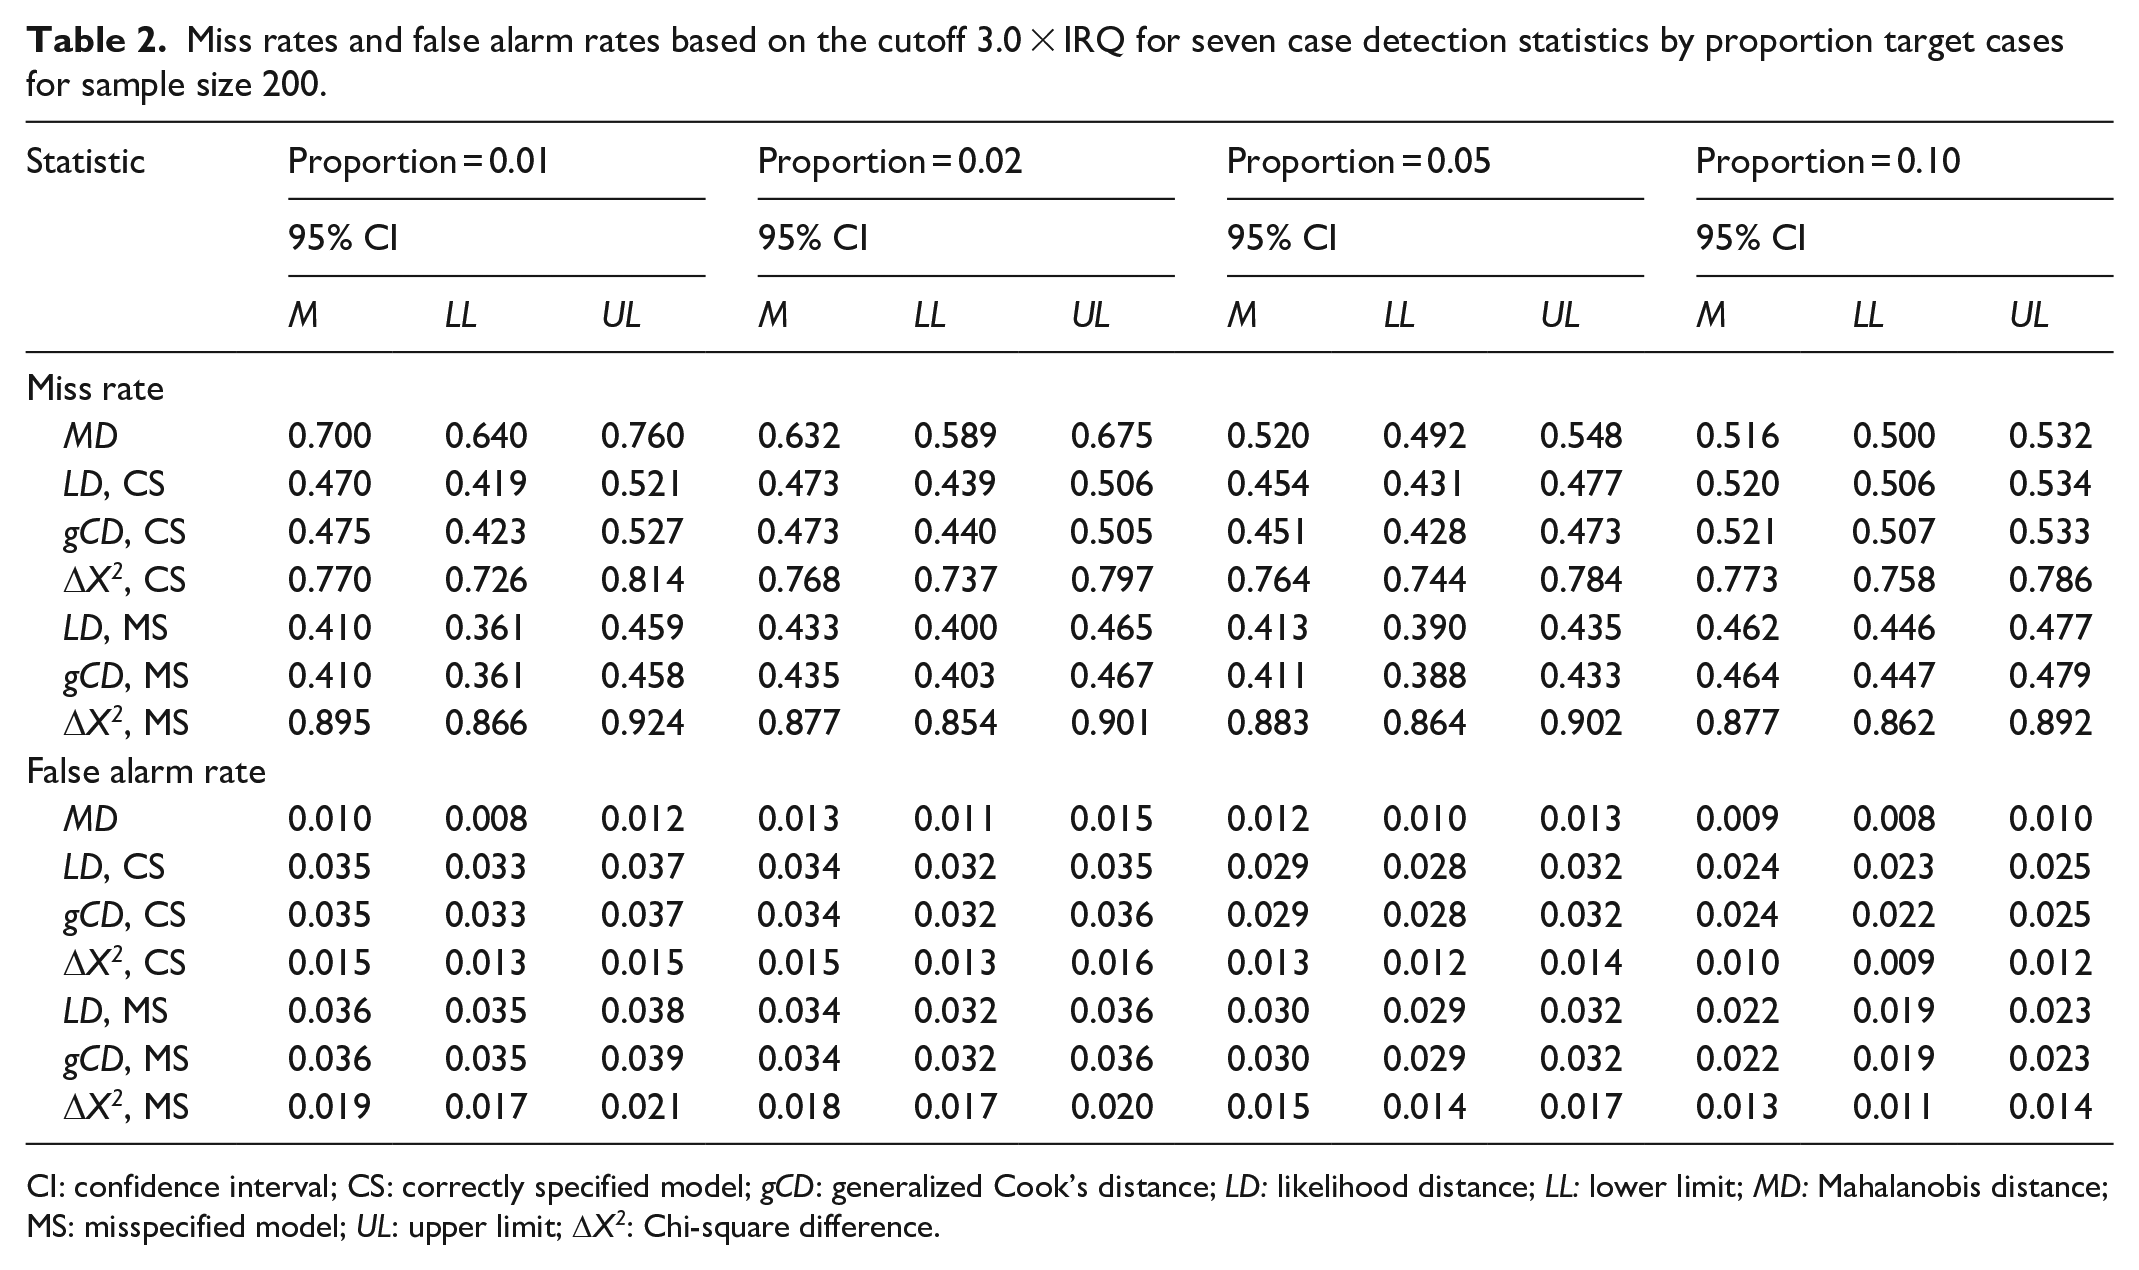
CI: confidence interval; CS: correctly specified model; gCD: generalized Cook’s distance; LD: likelihood distance; LL: lower limit; MD: Mahalanobis distance; MS: misspecified model; UL: upper limit; DX2: Chi-square difference.
Miss rates and false alarm rates based on the cutoff 1.5 × IRQ for seven case detection statistics by proportion target cases for sample size 400.
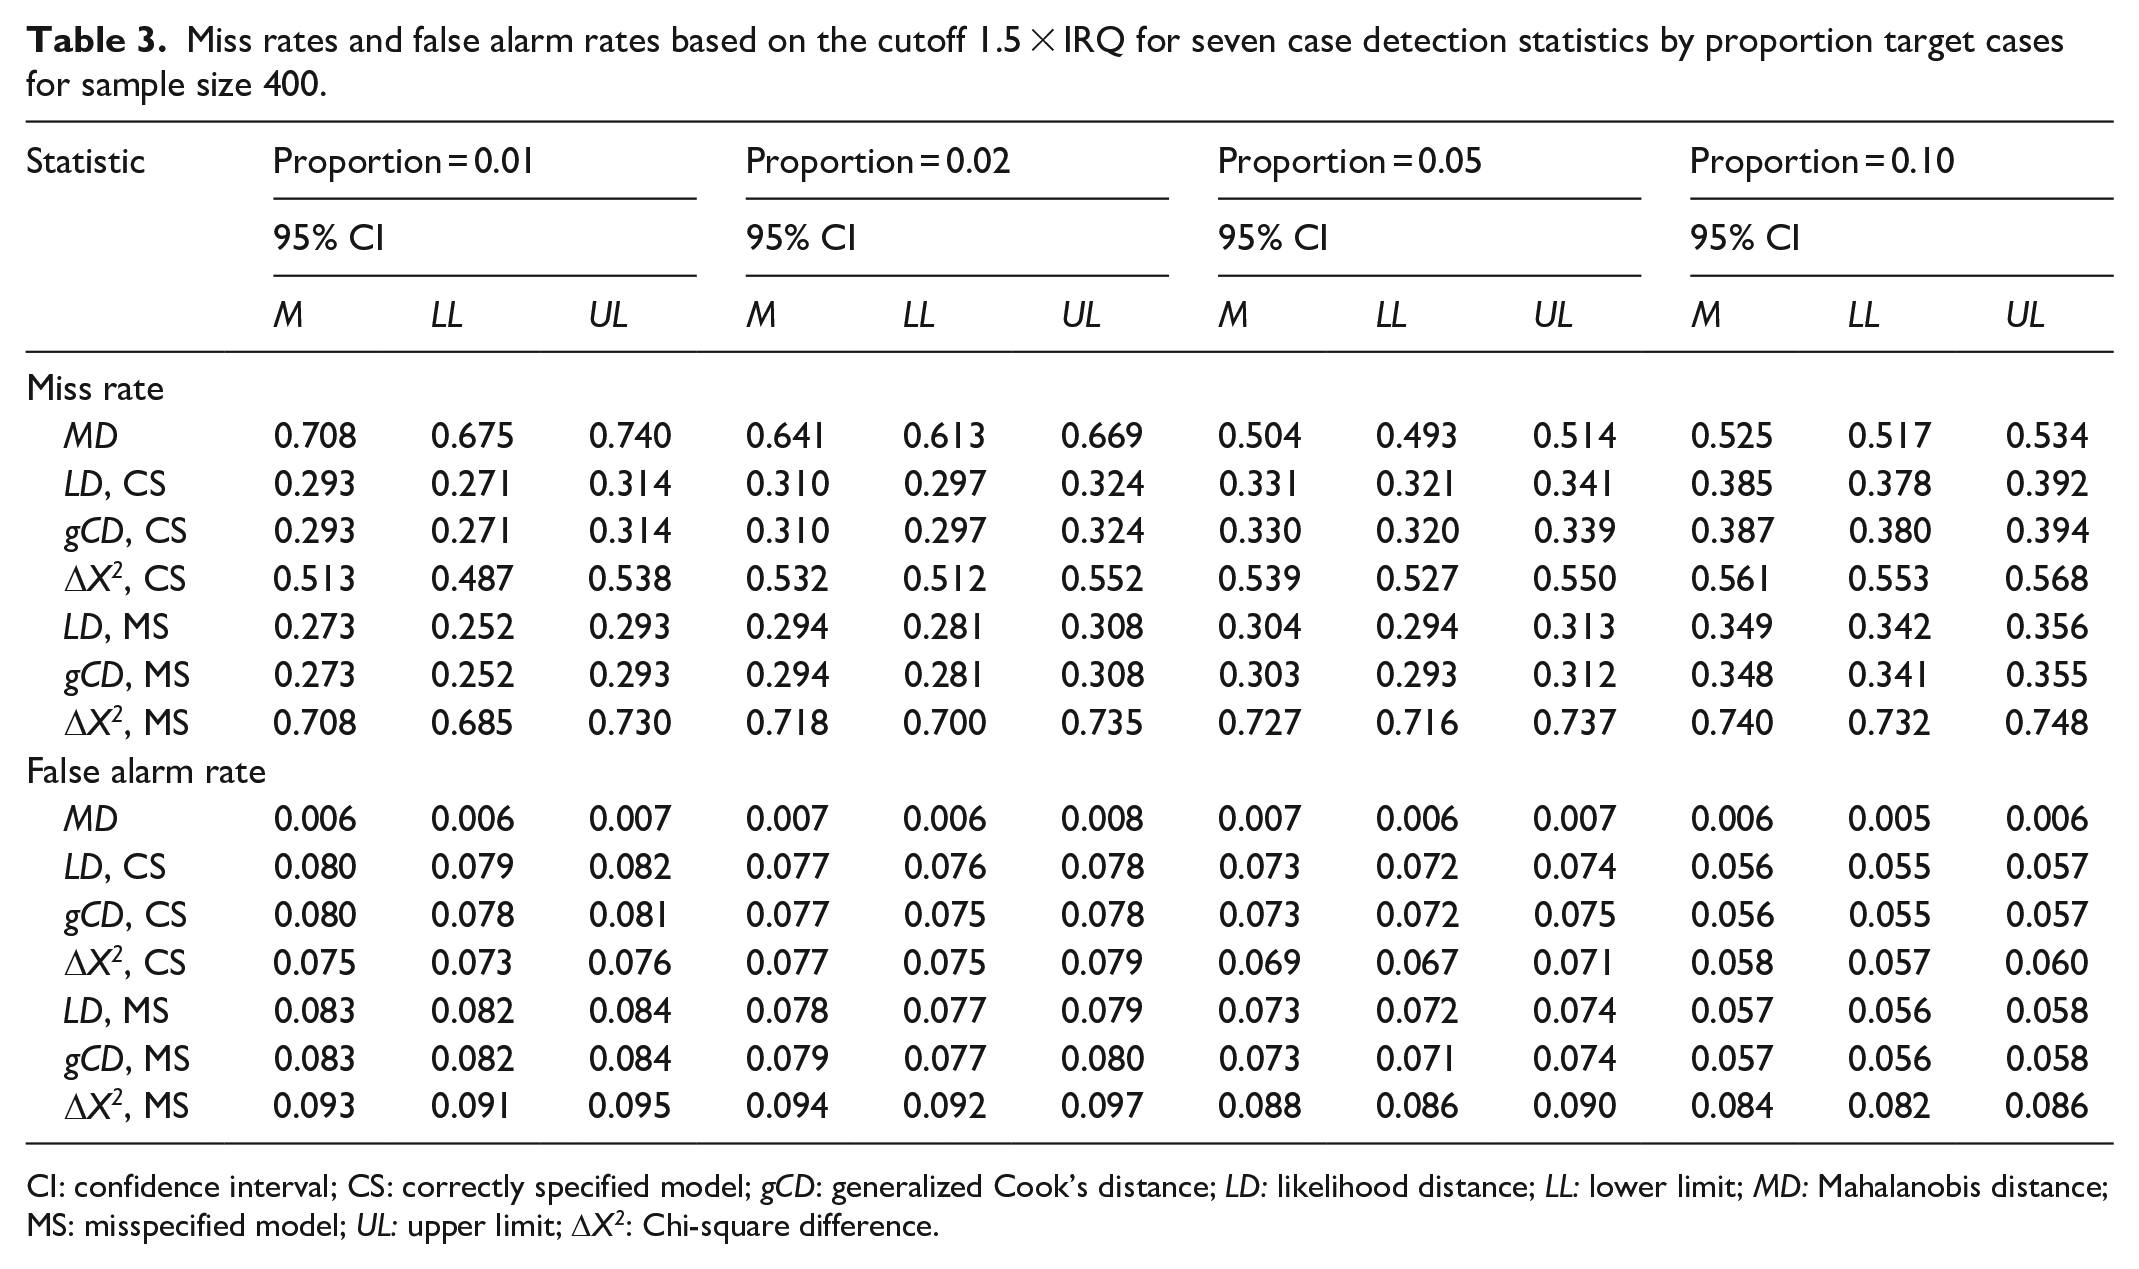
CI: confidence interval; CS: correctly specified model; gCD: generalized Cook’s distance; LD: likelihood distance; LL: lower limit; MD: Mahalanobis distance; MS: misspecified model; UL: upper limit; DX2: Chi-square difference.
Miss rates and false alarm rates based on the cutoff 3.0 × IRQ for seven case detection statistics by proportion target cases for sample size 400.
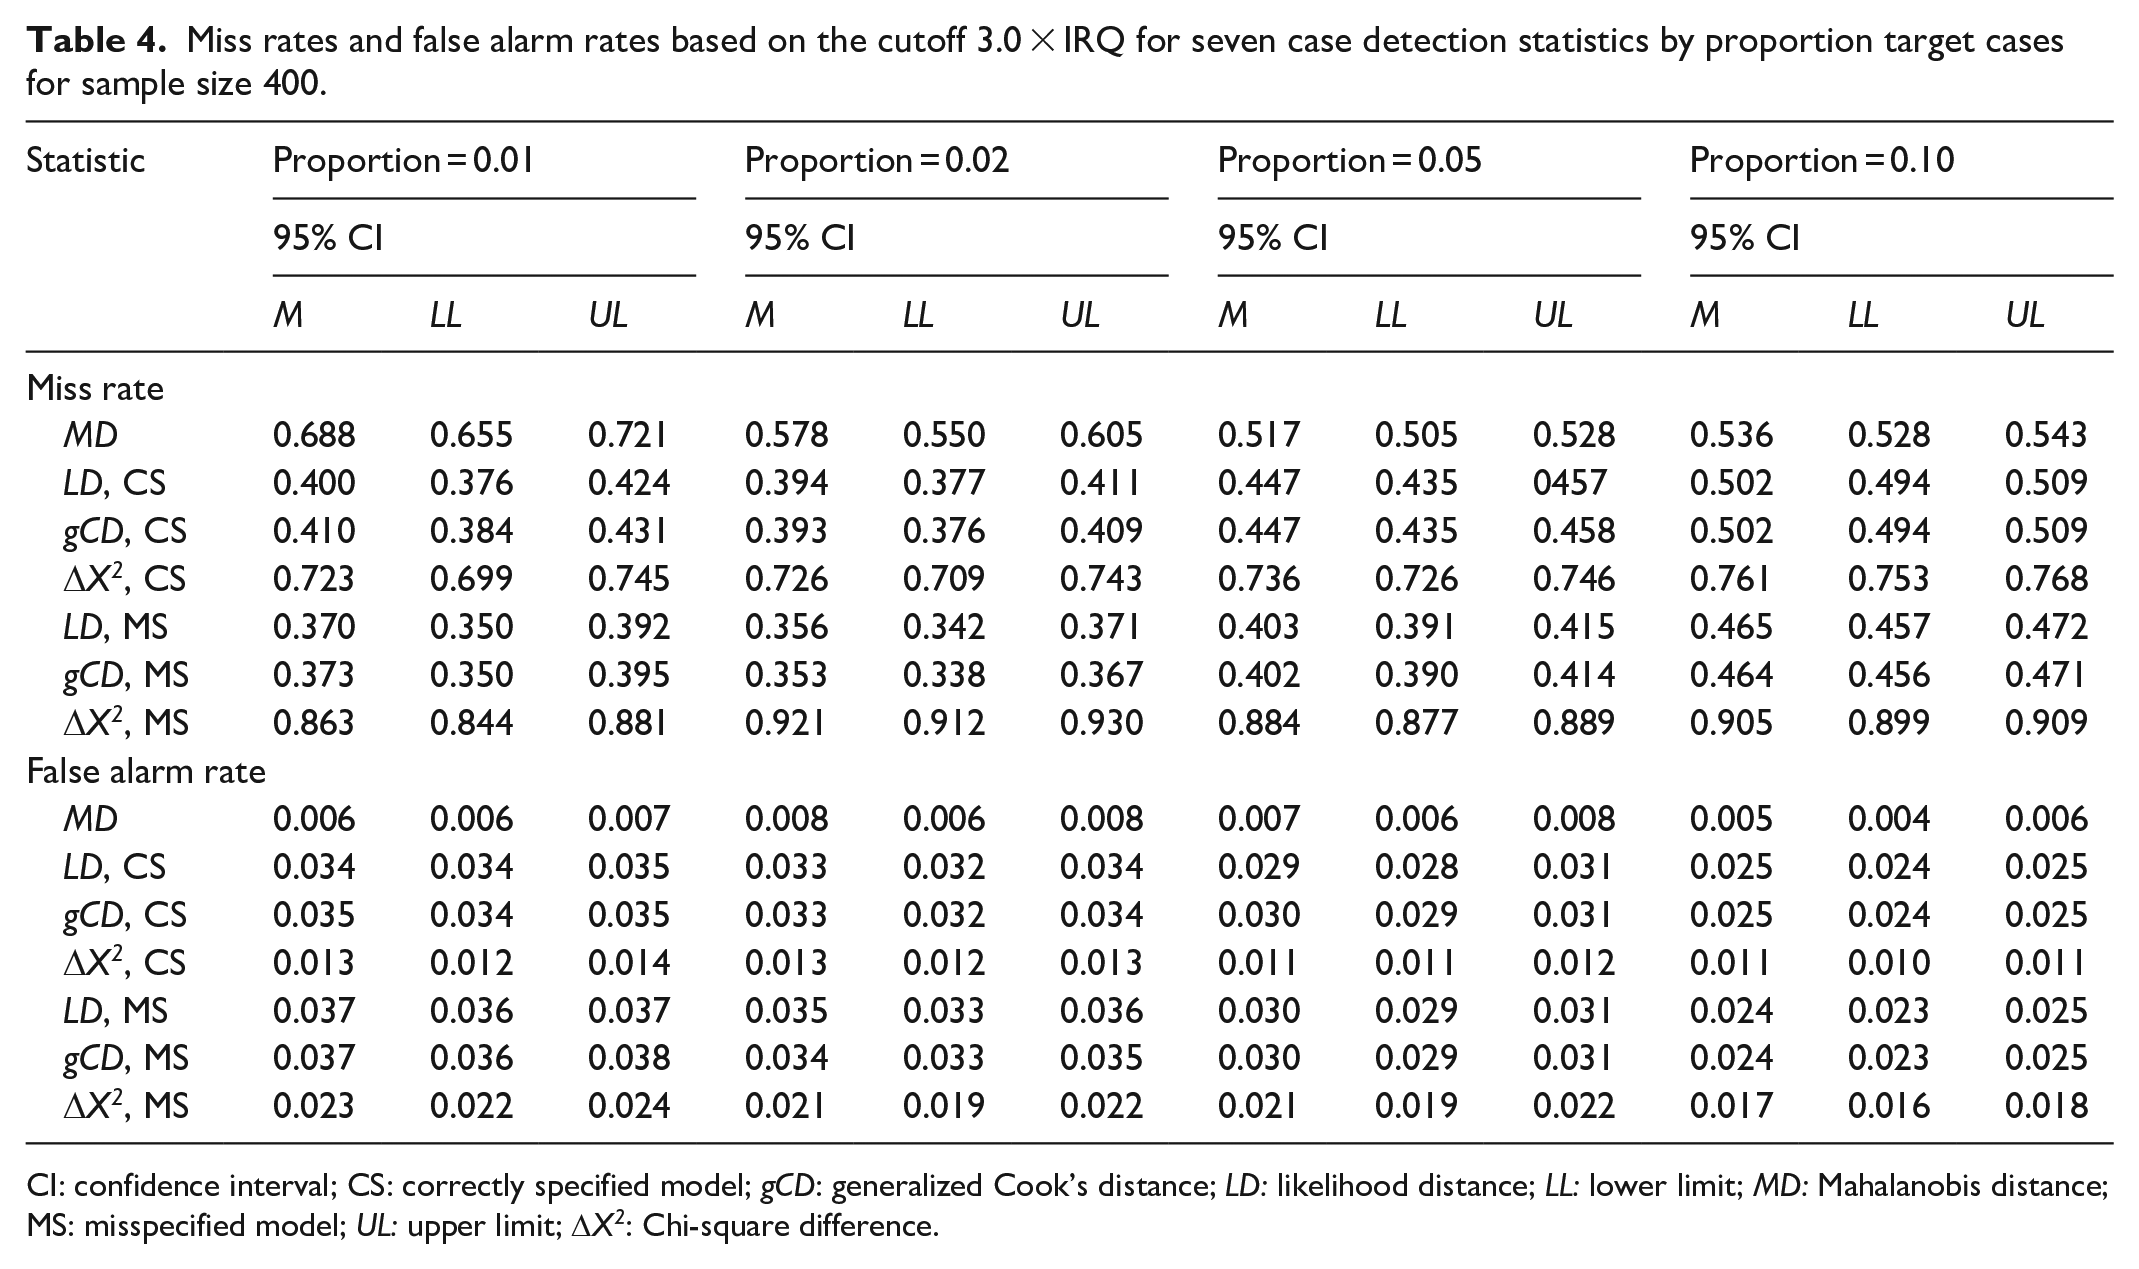
CI: confidence interval; CS: correctly specified model; gCD: generalized Cook’s distance; LD: likelihood distance; LL: lower limit; MD: Mahalanobis distance; MS: misspecified model; UL: upper limit; DX2: Chi-square difference.
Miss rates and false alarm rates based on 1.5 × IRQ cutoff for seven case detection statistics by proportion target cases for sample size 600.
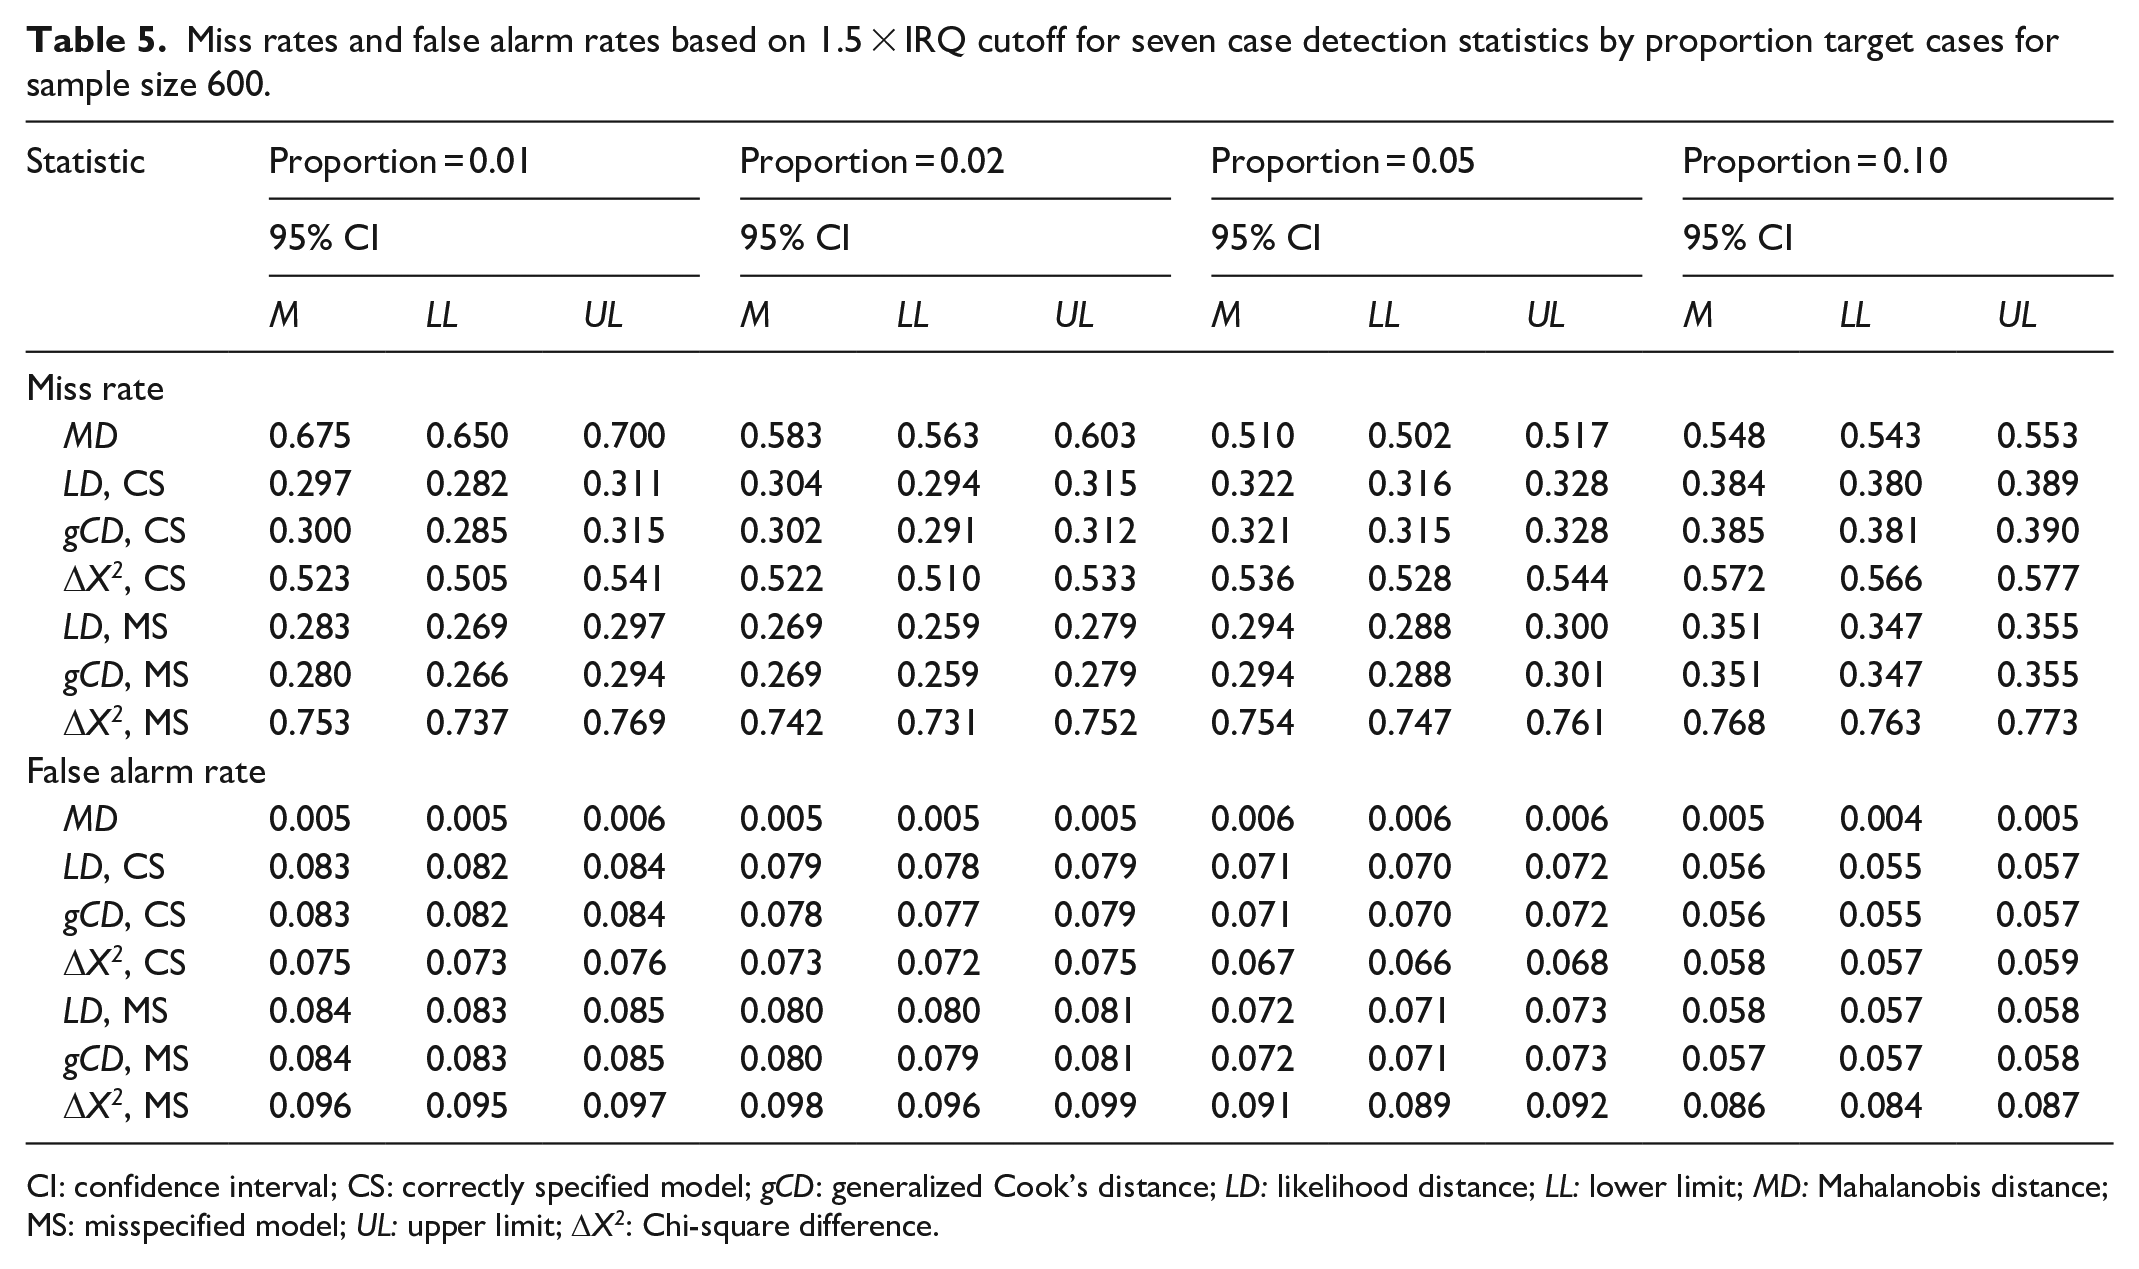
CI: confidence interval; CS: correctly specified model; gCD: generalized Cook’s distance; LD: likelihood distance; LL: lower limit; MD: Mahalanobis distance; MS: misspecified model; UL: upper limit; DX2: Chi-square difference.
Miss rates and false alarm rates based on the cutoff 3.0 × IRQ for seven case detection statistics by proportion target cases for sample size 600.
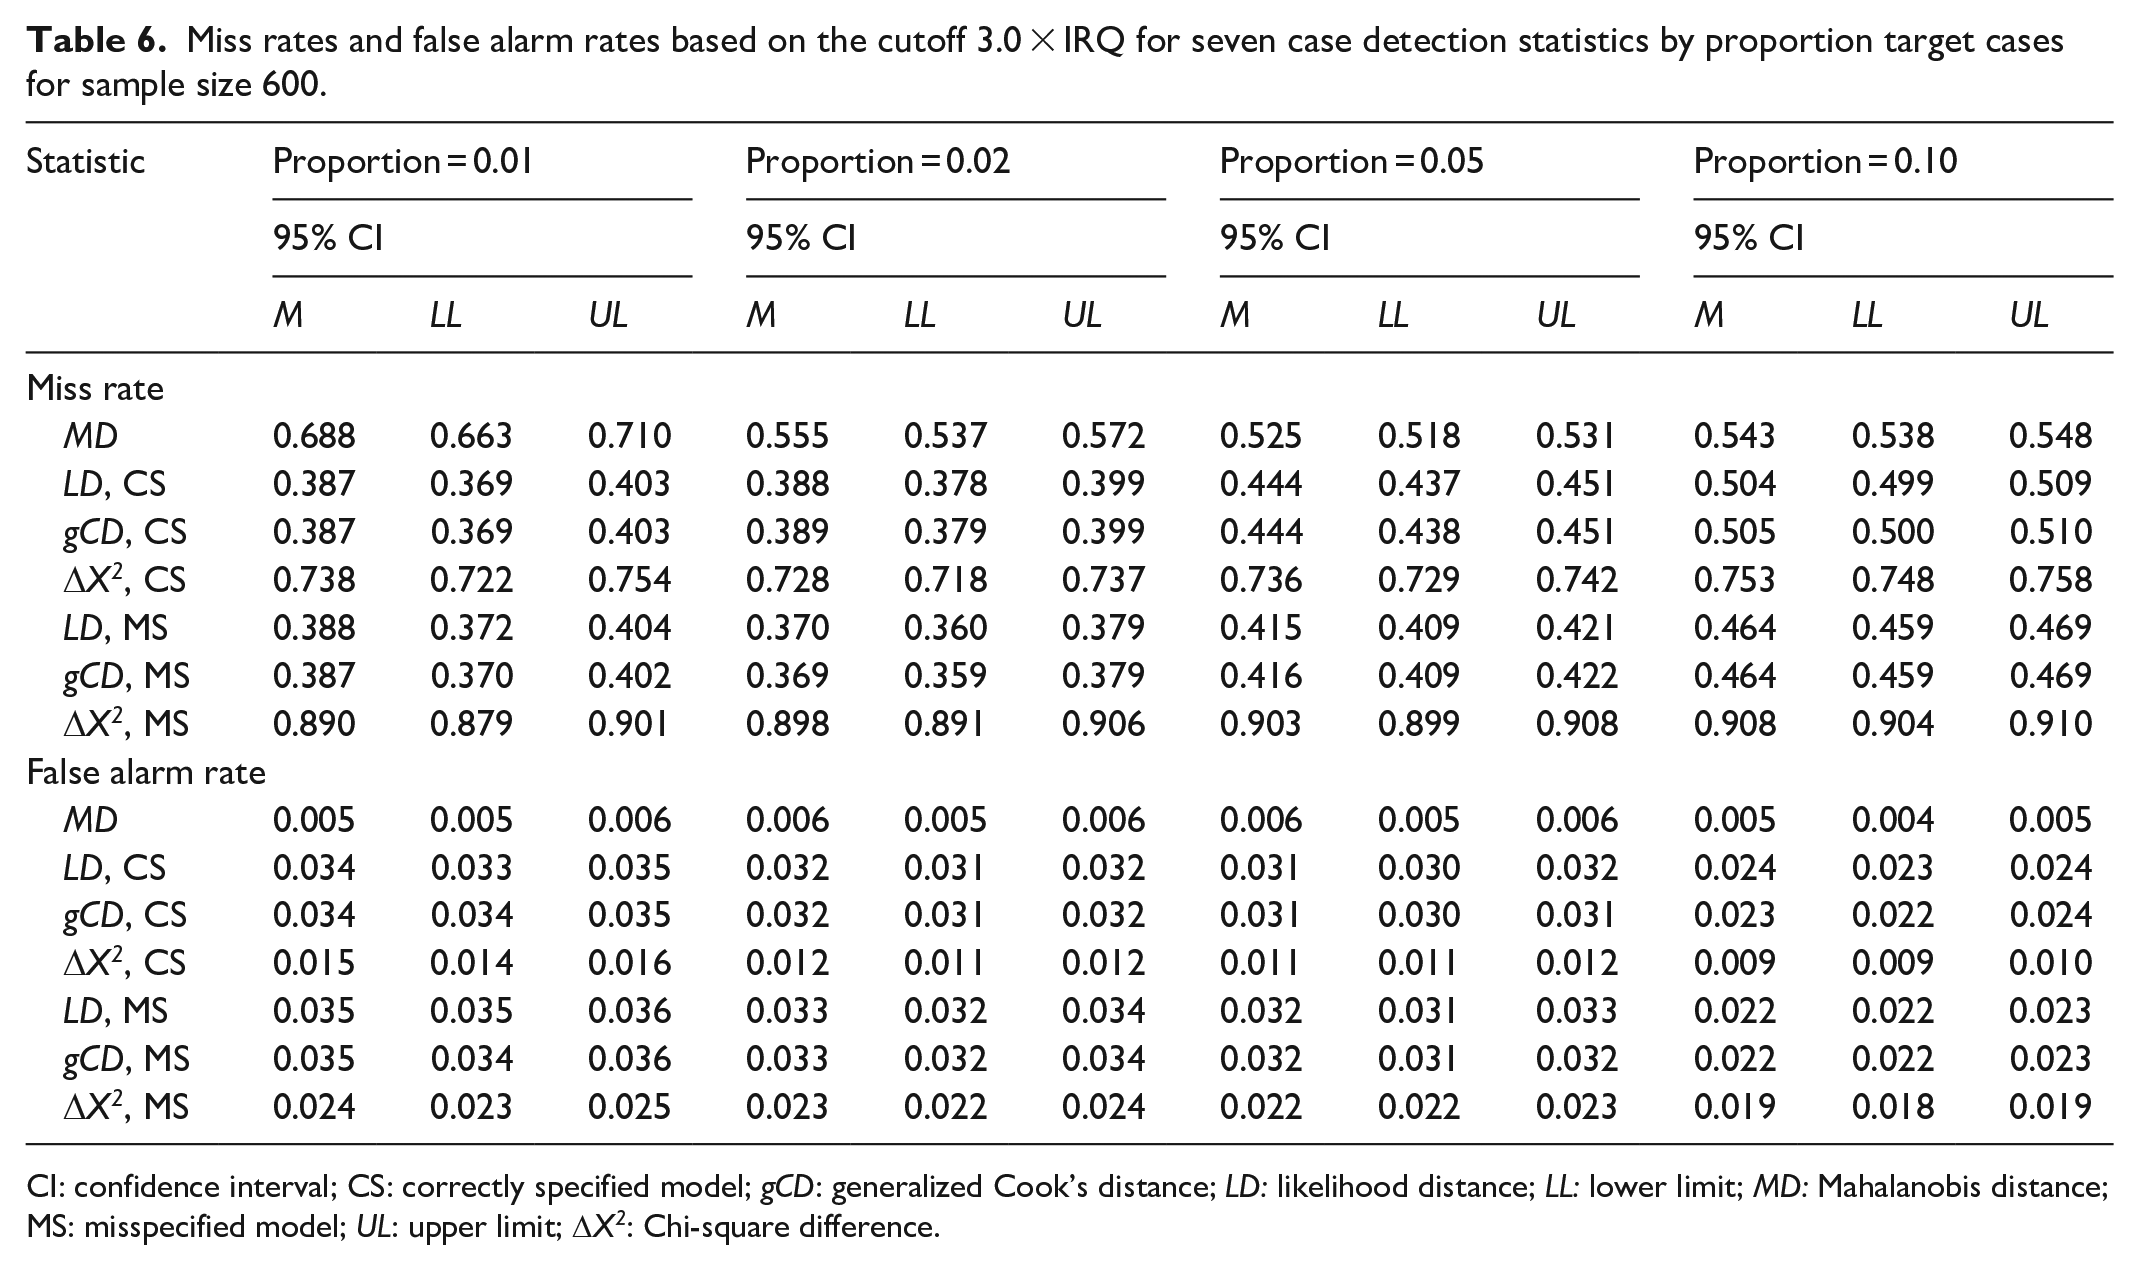
CI: confidence interval; CS: correctly specified model; gCD: generalized Cook’s distance; LD: likelihood distance; LL: lower limit; MD: Mahalanobis distance; MS: misspecified model; UL: upper limit;
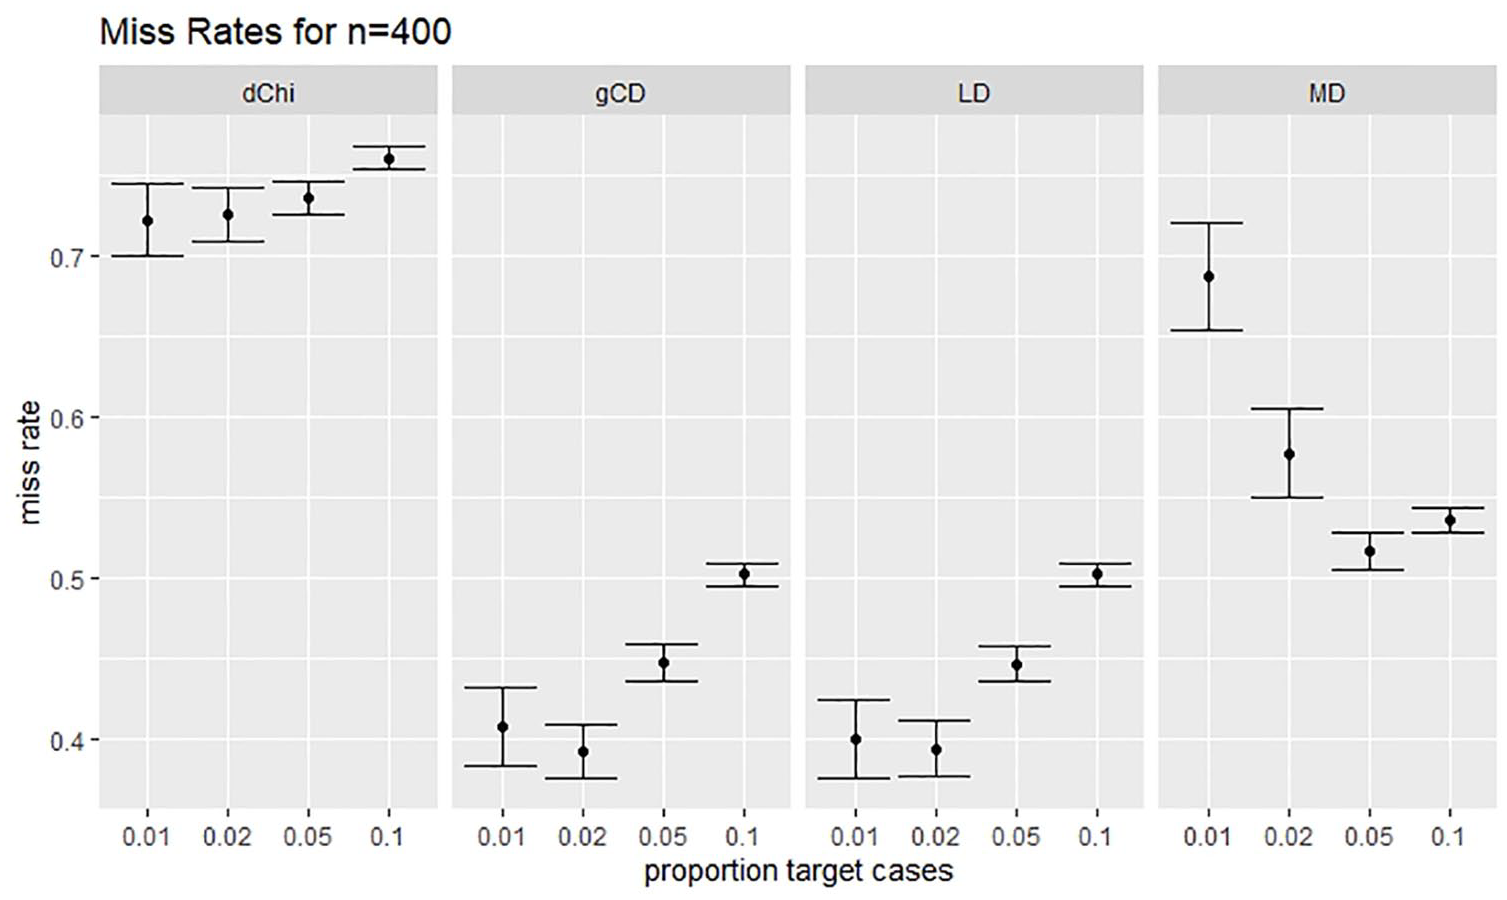
The MR using the cutoff 3.00 × IRQ for all statistics at N = 400.
Robust MD had a far lower FAR than any of the other statistics studied. The Chi-square difference statistic was the most sensitive to model misspecification. When the model was misspecified and the default cutoff was used, the Chi-square difference statistic generally had a higher FAR than any of the other statistics, except for conditions with both small sample size and low proportion of target cases to non-target cases. When the traditional cutoff was used, the Chi-square difference had FARs that were lower than likelihood distance and generalized Cook’s distance, but still notably higher than for MD. Figure 4 illustrates this trend.
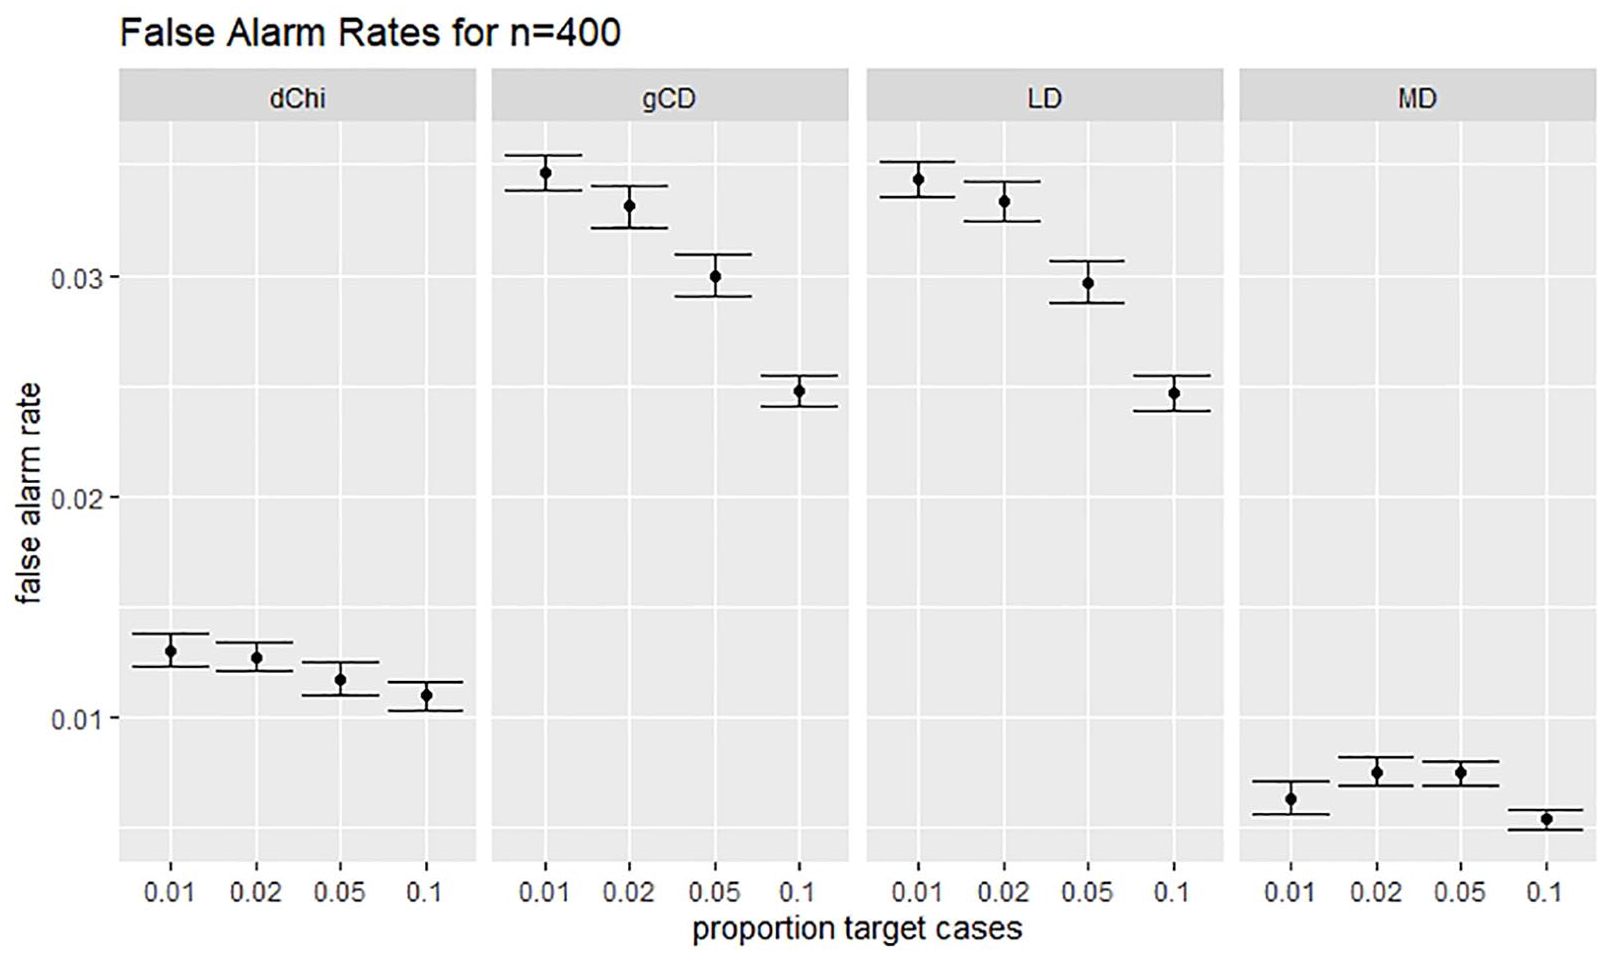
The FAR using the cutoff 3.00 × IRQ for all statistics at N = 400.
FARs for robust MD were remarkably stable as the proportion of target cases increased. FARs for the likelihood distance, generalized Cook’s distance, and Chi-square difference statistics generally decreased as the proportion of target cases to non-target cases increased. Only the Chi-square difference statistic showed occasional inconsistency in this regard. FARs for robust MD decreased as sample size increased. There was no consistent trend in FARs across sample sizes for the likelihood distance, generalized Cook’s distance, and Chi-square difference statistics.
Discussion
In this study, the accuracy of the deletion statistics likelihood distance, generalized Cook’s distance, and Chi-square difference was compared with the accuracy of the multivariate outlier detection statistic MD. Through systematic Monte Carlo simulation, the accuracy of these statistics was evaluated under a greater variety of conditions than in the previous literature. The results have important implications for the use of these case diagnostics with confirmatory factor models in practice.
The results of this study showed that the likelihood distance and generalized Cook’s distance statistics detected target cases more effectively than the Chi-square difference statistic under the software defaults in the influence.SEM package in R. Likelihood distance and generalized Cook’s distance overlooked fewer target cases, and their accuracy was not undermined by model misspecification. When traditional cutoffs were used in place of the defaults, the Chi-square difference statistic overlooked fewer target cases than likelihood distance and generalized Cook’s distance. Robust MD was far more conservative in identifying target cases than the deletion statistics in this study. Fewer target cases were identified using robust MD because fewer cases overall, both target and non-target, were flagged by robust MD.
These results extend the literature in a direction that is particularly important for practice. Prior studies on likelihood distance, Chi-square difference, and generalized Cook’s distance introduced and illustrated the use of these statistics but did not compare or evaluate them for their accuracy. Most studies have illustrated the use of these statistics with existing data sets (Pek and MacCallum, 2011; Zhao and Lee, 1998). One study, Lee and Wang (1996), used simulated data, but with only a single replication. These studies did not attempt to systematically evaluate or compare the accuracy of these statistics over a variety of conditions. Practitioners had no empirical evidence to support the use of one statistic over another. This study, although limited, produced some systematic evidence to support the conclusion that likelihood distance and generalized Cook’s distance perform more accurately under default conditions than the Chi-square difference statistic. However, the proportion of incorrectly flagged cases can be reduced by overriding the default with the traditional cutoff and using the Chi-square difference statistic.
Practitioners applying case diagnostic statistics should be aware that likelihood distance, generalized Cook’s distance, and Chi-square difference had a higher rate of flagging cases that should not have been detected (FAR) when compared to MD. Thus, once influential cases have been identified, it is necessary to investigate their nature before deciding their fate. This study has shown that, depending on the conditions, a substantial portion of ordinary cases may be identified using deletion statistics. Routine deletion of identified cases is strongly discouraged.
The results should be considered in the light of the Monte Carlo design used in this study. Target cases were generated using the same technique as in Lee and Wang (1996). Target cases were generated from an alternative model in which all variables were unrelated, consistent with an independent guessing or random response style. This model represents only one of many ways that influential cases may arise in the data. Furthermore, the alternative model used to generate the target cases had variances 2.25 times larger than the variances of the cases generated to fit the intended model. The greater variability may have mimicked a mechanism of transposition and other data entry errors that would produce influential cases from a distribution of unusually large variability due to, say, a value of 49 being recorded as 94 or a value of 1.1 being recorded as 0.11, for example. Thus, the alternative model generated target cases that were consistent with certain types of random errors, rather than producing target cases consistent with a systematic alternative arrangement of non-zero relations among the variables.
The fact that MD was more conservative in identifying cases than the deletion statistics in this study may be due to the choice of cut score for the statistic in this study. Other cut values for MD might produce results closer to those of the other statistics in this study. Nonetheless, the criterion used in this study was the default in the mvoutlier package (Filzmoser and Gschwandtner, 2018). Thus, this criterion is the one most likely to be used in practice.
Although the accuracy of the likelihood distance, generalized Cook’s distance, and Chi-square difference statistics was evaluated under a greater variety of conditions than in the previous literature, both the number of factors and the scope of conditions in a single study must be limited. Future research should consider additional models, models of different sizes, different types of model misspecification, and different methods for generating target cases. The method for generating target cases in this study resulted in some target cases that were indistinguishable from non-target cases due to some overlap in the generating models. This method was similar to that employed in Lee and Wang (1996), a prior study that used simulated data to investigate a deletion statistic in confirmatory factor analysis. Adoption of this approach in this study maintained continuity with the prior literature. The development of an alternative method for generating target cases, while outside the scope of this study, would be a useful avenue for further comparison of deletion statistics in confirmatory factor models.
A number of techniques were outside the scope of this study. Techniques for identifying residual outliers and leverage observations (e.g. Bollen and Arminger, 1991; Yuan and Zhang, 2008, 2012) and for testing local influence (e.g. Cook, 1986; Lee and Wang, 1996) require further study as well. Some case influence statistics avoid the computational intensity of the case deletion mechanism by approximating individual contributions to the model Chi-square statistic (Pregibon, 1981; Reise and Widaman, 1999; Tanaka et al., 1991). Further investigation of the accuracy of these statistics, as well as a comparison of their accuracy to that of deletion statistics, is warranted in further research. Finally, future research should also compare these approaches with forward search algorithms, which may be of interest for identifying groups of influential cases (Mavridis and Moustaki, 2008).
In this study, three case deletion statistics and one multivariate outlier detection statistic were systematically investigated using Monte Carlo simulation in the context of confirmatory factor analysis. The significance of this study is threefold. First, it helped to promote a little known area of research in confirmatory factor analysis. While case diagnostics are routinely used in other types of modeling, such as multiple regression, rarely does the potential influence of unusual cases receive attention in analyses applying confirmatory factor analysis. Second, the study extended the existing literature in which case deletion statistics have been introduced and illustrated but not tested or compared under varied conditions. Third, the results provided practical guidance to practitioners by making empirically based recommendations regarding the choice of one statistic over another.
Footnotes
Declaration of conflicting interests
The author(s) declared no potential conflicts of interest with respect to the research, authorship, and/or publication of this article.
Funding
The author(s) received no financial support for the research, authorship, and/or publication of this article.